


0
US Dollar Index
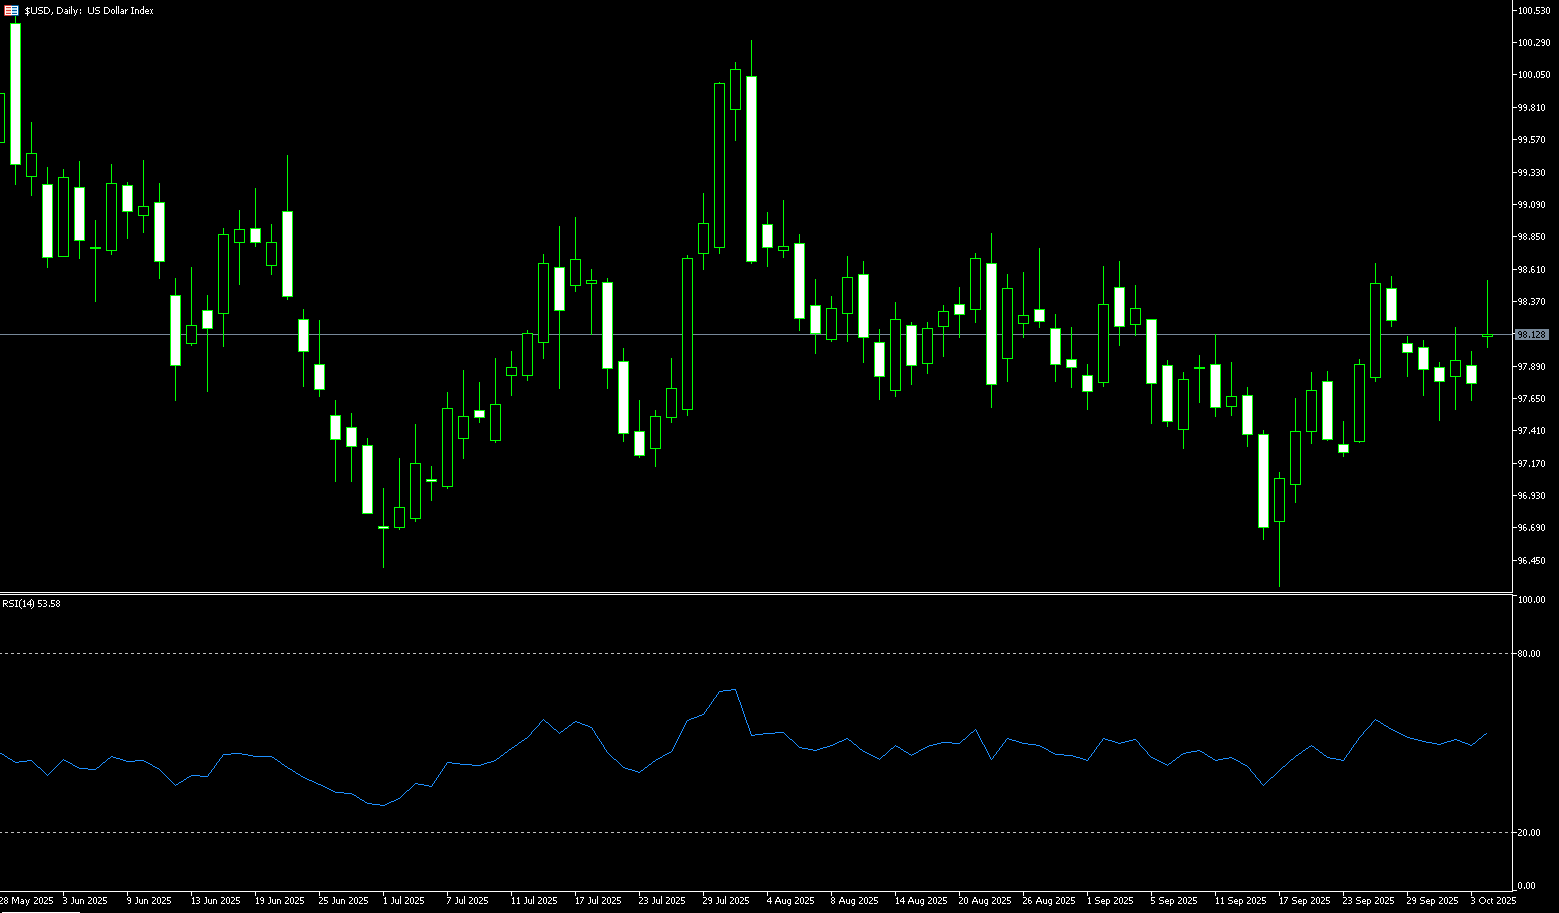
The US dollar index rose above 98.00 on Monday, reaching a near one-week high of 98.50, recovering last week's losses as investors weighed the economic impact of the government shutdown after lawmakers again failed to reach a funding agreement. The shutdown has suspended key federal programs and delayed key data releases, including the September jobs report originally scheduled for Friday. On the policy front, recent data has reinforced expectations for Federal Reserve rate cuts, with the market almost fully pricing in a quarter-point rate cut this month and another in December. Traders now await new signals from central bank officials this week, including speeches by Fed Governor Stephen Milan on Wednesday and Chairman Jerome Powell on Thursday. The dollar saw the biggest gains against the yen, surging over 1% after the ruling party voted in favor of fiscally dovish and pro-stimulus lawmaker Sanae Takaichi as Japan's next prime minister.
Technically, the index briefly reclaimed its 100-day moving average (98.19), a key technical resistance level that has been a key target for bulls this week. Below this level, the US dollar index's momentum continues to weaken, placing downward pressure on the market in sharp focus. On the downside, a break below 98.00 (a psychologically important market barrier) could trigger a more intense sell-off, potentially pushing the index towards last week's low of 97.46. Support lies at 97.21, the September 23rd swing low, and 97.17 (the 23.6% Fibonacci retracement level from 100.26 to 96.22). Any rebound is likely to face resistance below the 134-day moving average at 98.77 and the 99.00 (round-number barrier) unless overall macro uncertainty subsides. Traders should closely monitor interest rate commentary and Fed officials' statements in the coming sessions.
Consider shorting the US Dollar Index at 98.24 today, with a stop-loss at 98.35 and targets at 97.80 and 97.70.
WTI Spot Crude Oil
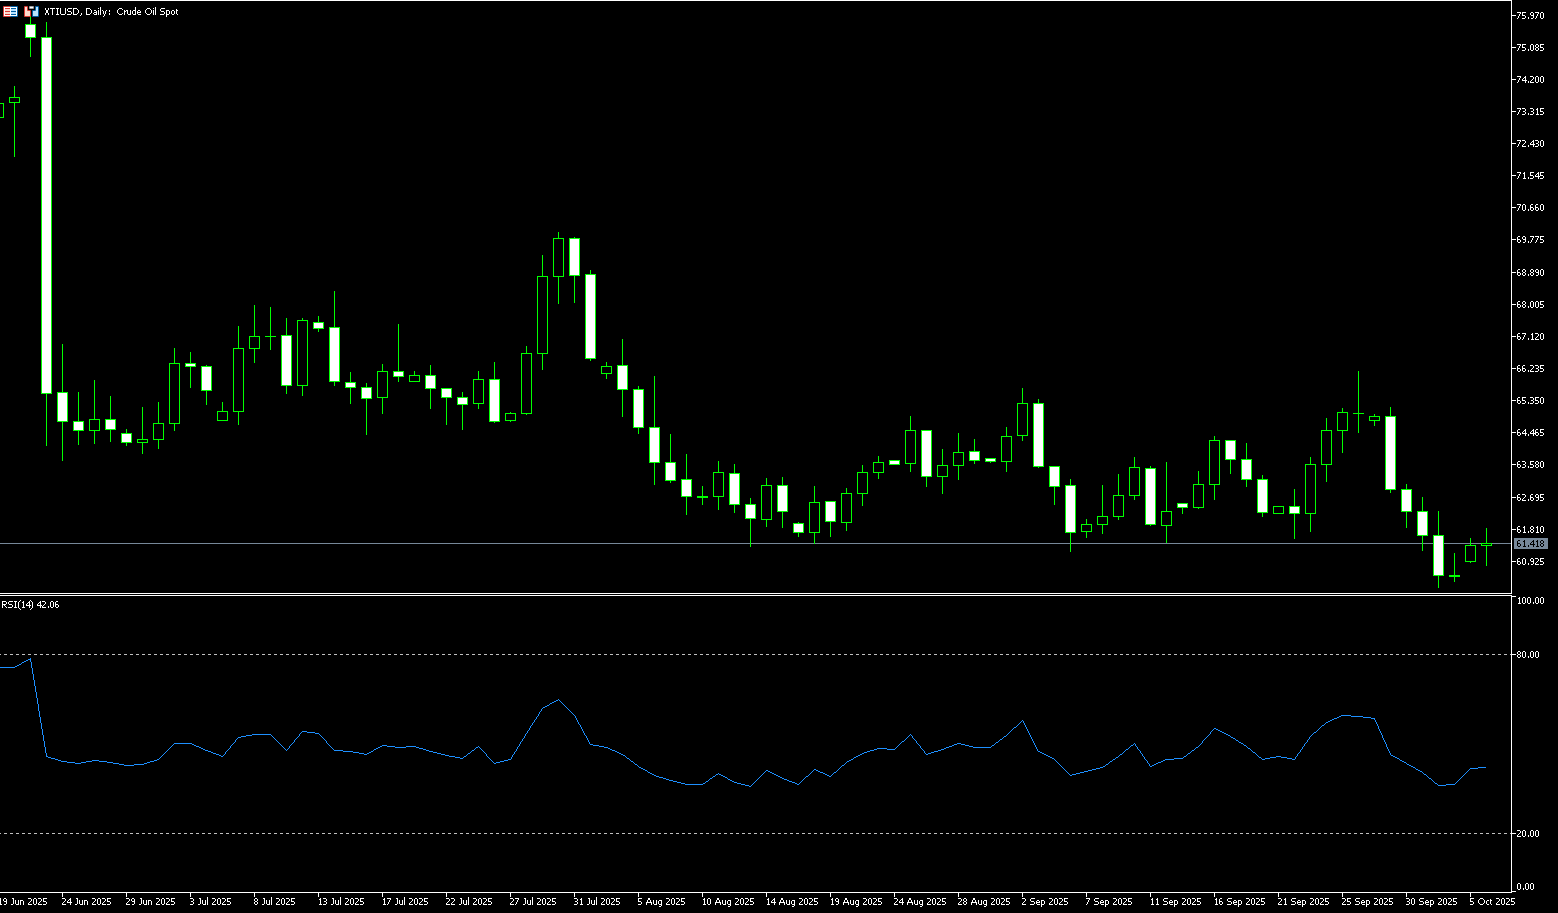
US crude oil began the week trading around $61.50 per barrel. OPEC+ announced on Sunday that it would increase oil production by 137,000 barrels per day starting in November, a relatively modest monthly increase, similar to October, due to persistent concerns about a potential oversupply. Last week, Brent crude oil fell 8.1%, its largest weekly drop in over three months. US WTI crude oil fell 7.4%. OPEC+ production increases and the reopening of the Iraqi/Kurdish pipeline after a two-year closure have continued to drive crude oil sellers, while Hamas has also begun peace talks with the Trump administration. Coupled with bearish EIA inventory data, it's difficult to be bullish on crude oil in the short term. The writing is on the wall: US crude oil inventories are expected to rise by the end of the year, and global visible inventories are also expected to rise. Combined with increased OPEC+ crude oil exports, this will ultimately lead to sustained oil market weakness.
Technically, US crude oil has broken below the key support level of $61.50, which has held since early August. The price has now fallen below both the 9-day and 50-day moving averages (62.68 and 63.56), reinforcing the bearish structure on the daily chart. On the downside, initial support lies at $60.22 (last week's low) and $60.00 (a psychologically important level). A break below this level opens the door to $59.50, which aligns with the May 30 swing low of $59.39. On the upside, $62.00 (round-number level) and $62.68 (9-day moving average) have become near-term resistance levels, requiring a daily close above these levels to signal a potential rebound. Even so, the range between $63.56 (50-day moving average) and $64.00 will continue to suppress any potential upside, maintaining a bearish trend.
Today, consider going long on crude oil at $61.40. Stop-loss: $61.20, target: $62.80, $63.00.
Spot Gold
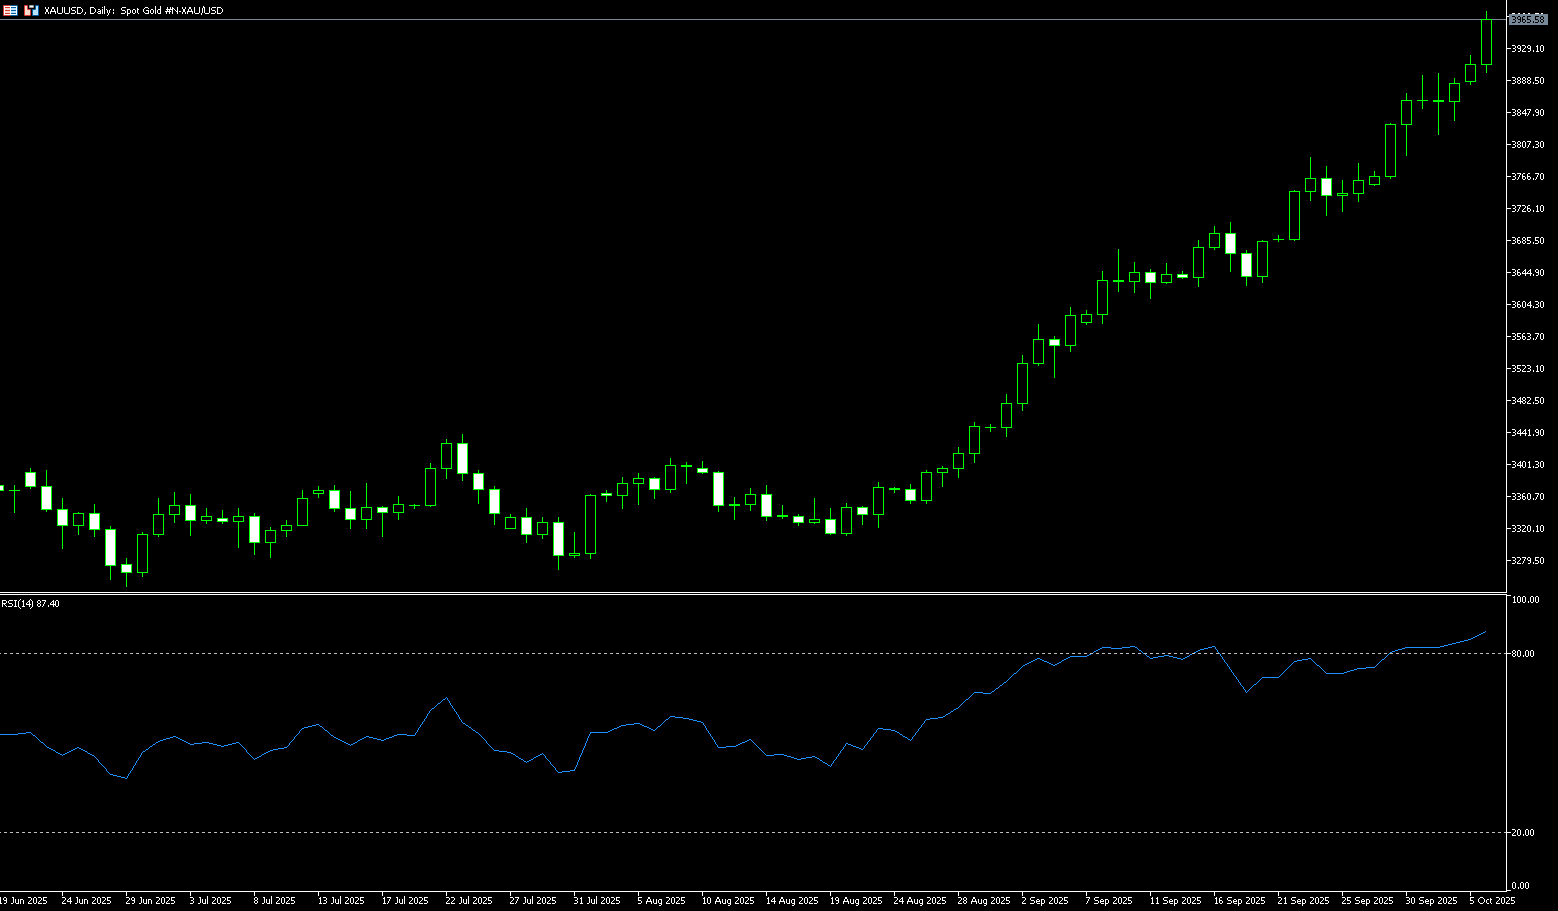
Spot gold surged over $80 to $3,970/oz in Asian trading on Monday, setting a new all-time high. This wasn't just a statistical extravaganza; it was a safe-haven event amidst a confluence of macroeconomic storms. From unexpected shifts in Japanese politics to mounting expectations of a Federal Reserve rate cut, to the political deadlock surrounding the Washington government shutdown, these factors combined to ignite a fervent rally in gold. In less than 10 days, gold's price surged from its first breakout above $3,800 to surpass $3,900, a dramatic surge that left investors both amazed and excited. As a timeless safe-haven asset, gold is experiencing its golden age in a world shrouded in uncertainty. Market bets on another Federal Reserve interest rate cut in October are virtually certain. This expectation stems from multiple signals: weak US economic data, persistent but manageable inflationary pressures, and the ongoing uncertainty surrounding the Trump administration's tariff policies. This has recently put downward pressure on the US dollar index, and the 10-year Treasury yield has also recently fallen, paving the way for gold's surge.
Gold prices began the week on an upward trend, breaking through $3,900 (a round number) to reach a new all-time high of $3,970, just shy of the crucial $4,000 mark. Momentum indicators suggest continued strengthening buying. Meanwhile, the Relative Strength Index (RSI), while overbought at 84.20, has a flat slope, suggesting a weakening of buyers' appetite for higher prices. If gold undergoes a technical correction below $3,900 (round mark), the next target is $3,864 (Monday's low). A break below this level would expose the October 2 low of $3,819, followed by $3,800. Conversely, if gold prices break above the new all-time high of $3,970, the first resistance level will be $3,980, followed by the psychological level of $4,000.
Consider going long on gold at $3,955 today, with a stop-loss at $3,950 and targets at $3,985 or $3,995.
AUD/USD
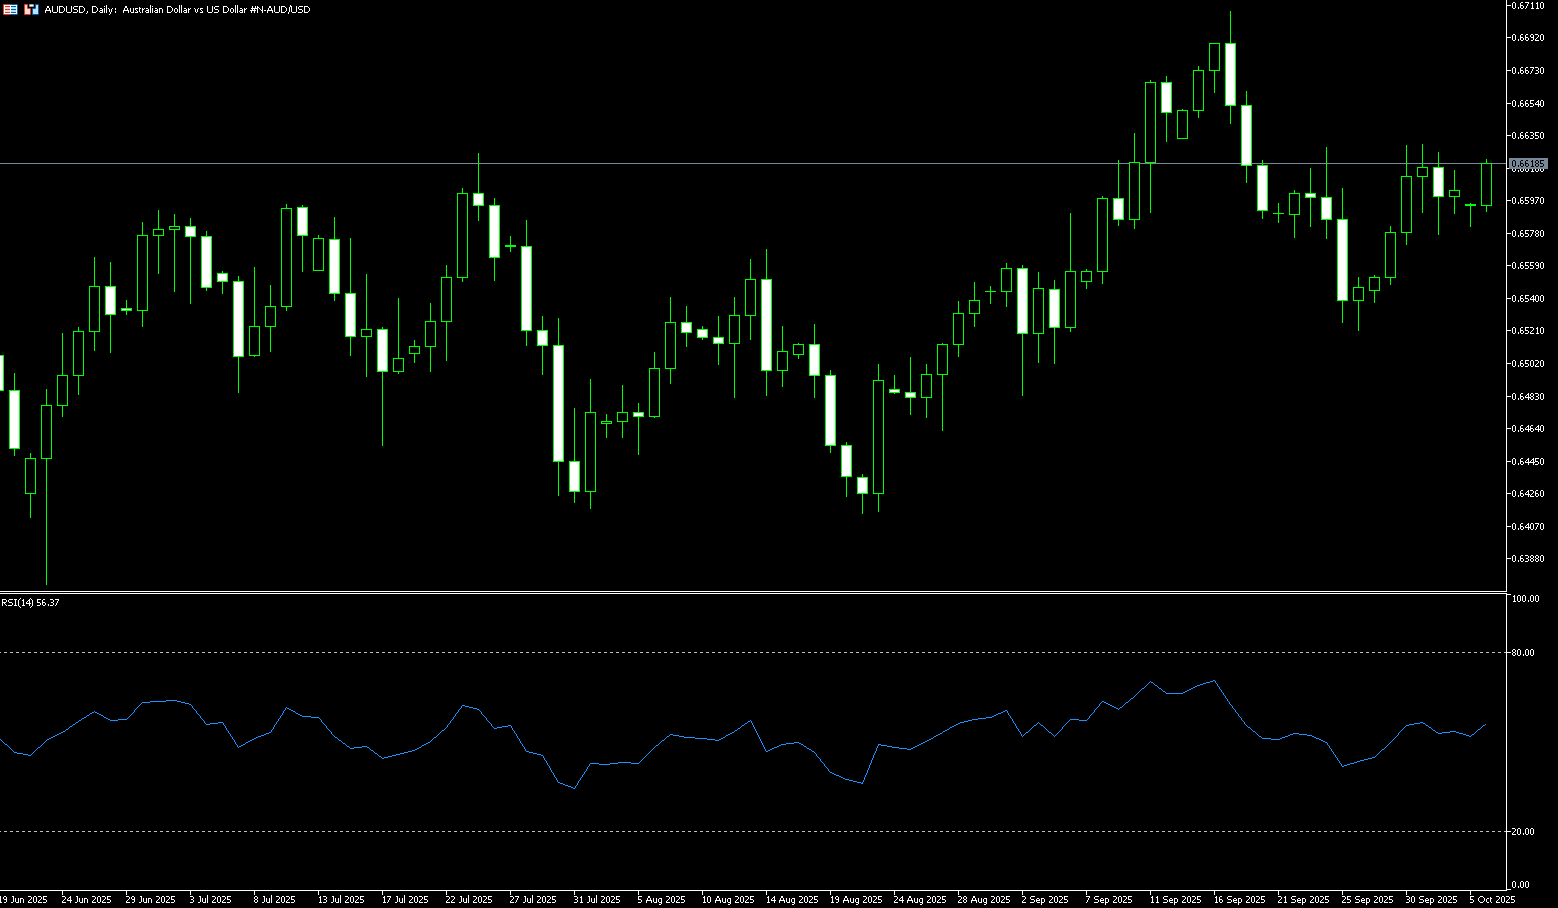
The Australian dollar traded slightly above $0.6600 on Monday, extending last week's gains as investors digested the latest inflation report. The Melbourne Institute's monthly inflation rate showed a 0.4% increase in September 2025, rebounding from a 0.3% drop in August. This rebound reinforces signs that inflation may be higher than expected in the third quarter, even as the Reserve Bank of Australia (RBA) seeks to maintain price growth within its 2-3% target range. The RBA kept interest rates unchanged at 3.6% in September, but noted that inflation remains stubborn, particularly in the services sector, amid a tight labor market. While most economists still expect further rate cuts in November and 2026, the market remains cautious, pricing in only a 40% probability of a cut next month. Investors now turn their attention to speeches by RBA officials this week, which are expected to provide further insight into the central bank's policy outlook.
AUD/USD traded in a narrow range around 0.6600 on Monday. Technical analysis on the daily chart suggests the pair is trading within an ascending channel, indicating a bullish bias. Furthermore, the 14-day relative strength index (RSI) is above 50, further reinforcing the bullish bias. On the upside, the pair's first target could be the September 18 high near 0.6660. A break below this level would target the 0.6700 level and the 12-month high of 0.6707 reached on September 17. Immediate support lies at the 50-day simple moving average at 0.6545, which could trigger a bearish bias and exert downward pressure on the pair, potentially leading to weakness towards the 0.6500 round-figure level.
Consider a long position on the Australian dollar at 0.6605 today, with a stop-loss at 0.6595 and targets at 0.6660 or 0.6650.
GBP/USD
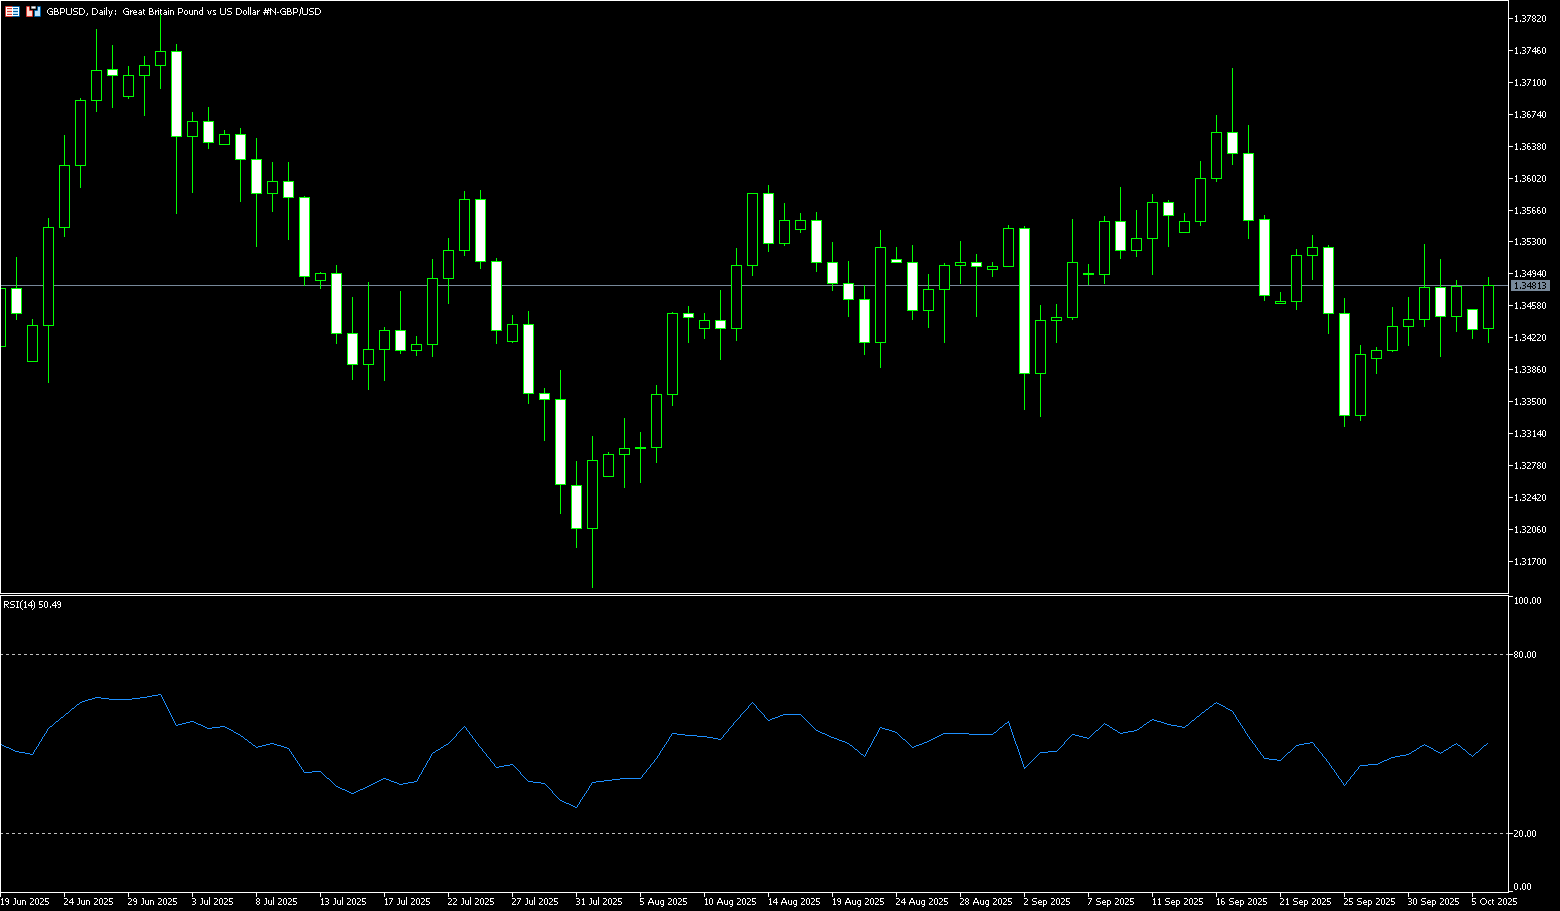
GBP/USD struggled to capitalize on Friday's strong gains, opening the new week with a bearish gap. During Monday's European trading session, the pair dipped to near 1.3420 before rebounding to 1.3480. Despite the risk of the White House being forced to implement large-scale layoffs following the partial US government shutdown, the US dollar rebounded strongly, putting selling pressure on the currency. This was due to the broad dollar strength. However, spot prices lacked follow-through selling and appeared to be stabilizing above 1.3400. Japan's ruling Liberal Democratic Party elected Sanae Takaichi as its new leader over the weekend. Given Takaichi's perceived fiscal dovishness, this outcome increased the likelihood that the Bank of Japan would delay further interest rate hikes and triggered a significant sell-off in the yen. This, in turn, provided good support for the US dollar, acting as a key factor weighing on GBP/USD. However, the dollar's upside appears limited as there is growing acceptance that the Federal Reserve will cut interest rates two more times this year.
Throughout the week, the British pound has traded against the US dollar within the 1.3395 to 1.3527 range seen last week, currently trading around 1.34270-80. The pair is struggling to retest its 20-day simple moving average at 1.3503 and above last week's high of 1.3527. If the pair breaks above 1.3500-1.3505, the next target price will be 1.3559 (the high of September 19). A break below this level could target 1.3600 (the psychological market level). The 14-day Relative Strength Index (RSI) has rebounded to near 47.50. If the RSI remains within the 45.00-50.00 range, the pair will likely remain sideways. If the GBP/USD pair breaks below 1.3400, 1.3374 (the 150-day simple moving average) will serve as key support. The September 25 low of 1.3324 and the psychological level of 1.3300 will act as short-term support.
Consider going long on the British pound at 1.3468 today, with a stop-loss of 1.3455 and targets of 1.3520 and 1.3530.
USD/JPY
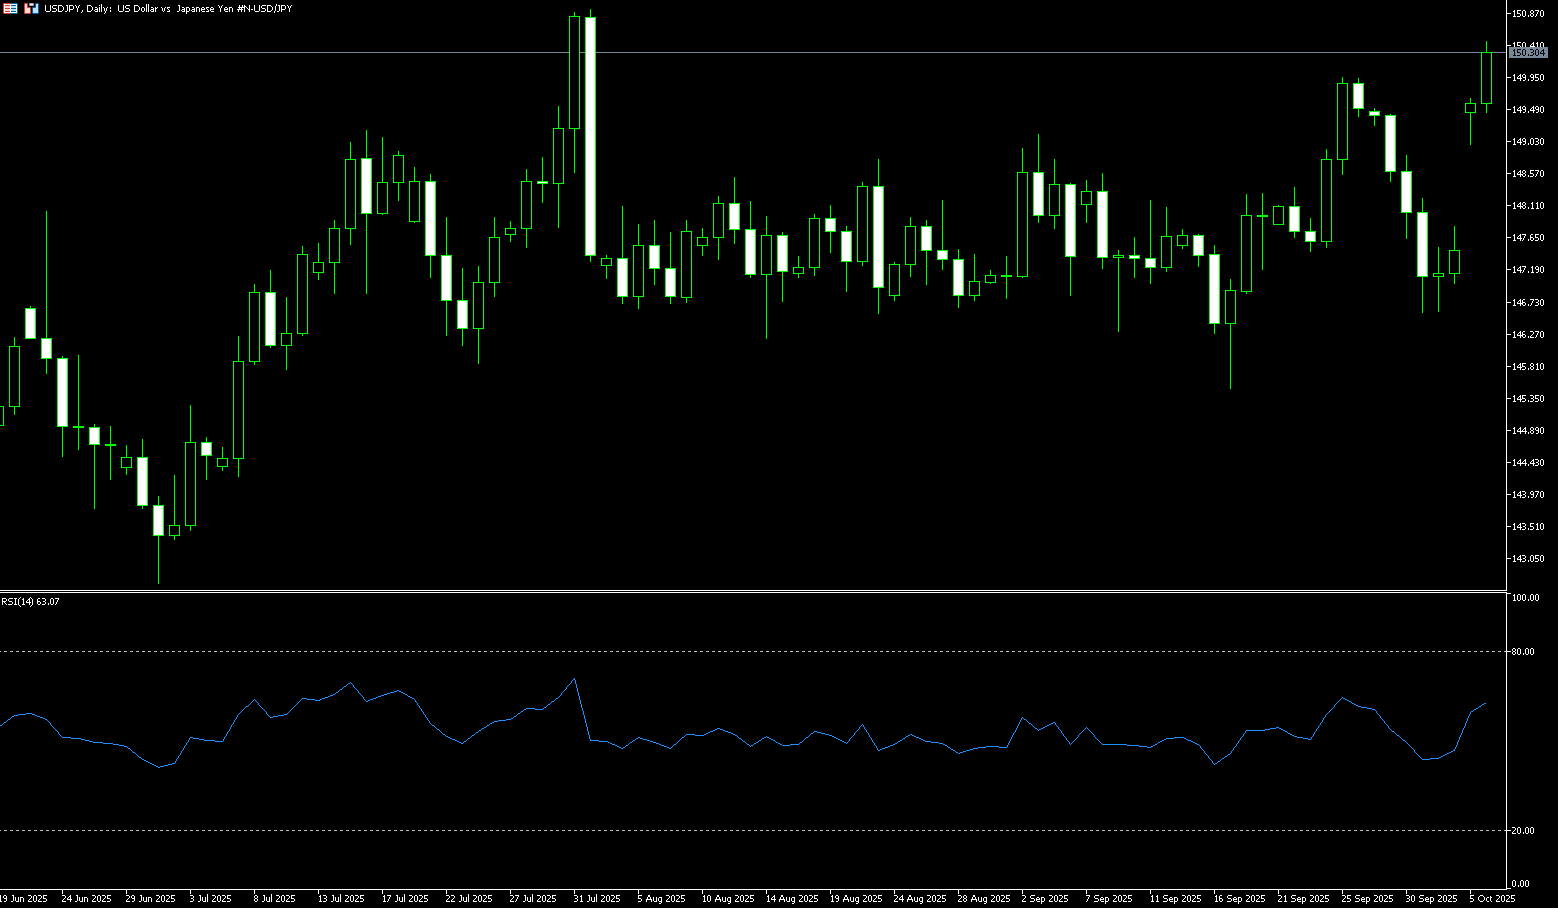
At the start of Monday's Asian session, the yen (JPY) exchange rate saw a sharp gap-down drop, surging as much as 2.0% against the yen to 150.47, approaching its highest level in more than two months. This dramatic volatility was no accident, but rather the direct result of a political upheaval in Japan. Former Minister of Economic Security Sanae Takaichi was elected as the new governor by a majority vote, practically guaranteeing her position as the next prime minister. This news was a bombshell, instantly roiling Tokyo's foreign exchange and bond markets. Takaichi, known for her unequivocal fiscal easing stance and her vocal opposition to further monetary tightening by the Bank of Japan, has fueled market concerns about the yen's outlook. While this political shift may be positive for the stock market, it is a further blow to the yen. While USD/JPY may be on the verge of hitting 150, the collapse of the yen, a traditional safe-haven currency, is directly amplifying volatility in the global foreign exchange market.
From a technical perspective, last week's rebound from the 200-day simple moving average of 148.20 and subsequent breakout above the psychological 150.00 round number should be seen as a new trigger for USD/JPY bulls. Given the renewed positive momentum in oscillators on the daily chart, the spot price could test the August monthly high (around 150.92), with some medium-term resistance around 152.03 (the February 14 high). On the other hand, a break below the immediate support level of 149.40 could be seen as a buying opportunity, with limited movement around the Asian session low, around 149.00. A break above the latter could drag USD/JPY to the next relevant support level of 148.35, potentially approaching the 148.00 round number and 147.80. A further breakout could prompt short-term traders to turn bearish.
Consider shorting the US dollar at 150.50 today. Stop-loss: 150.70, target: 149.50, 149.30.
EUR/USD
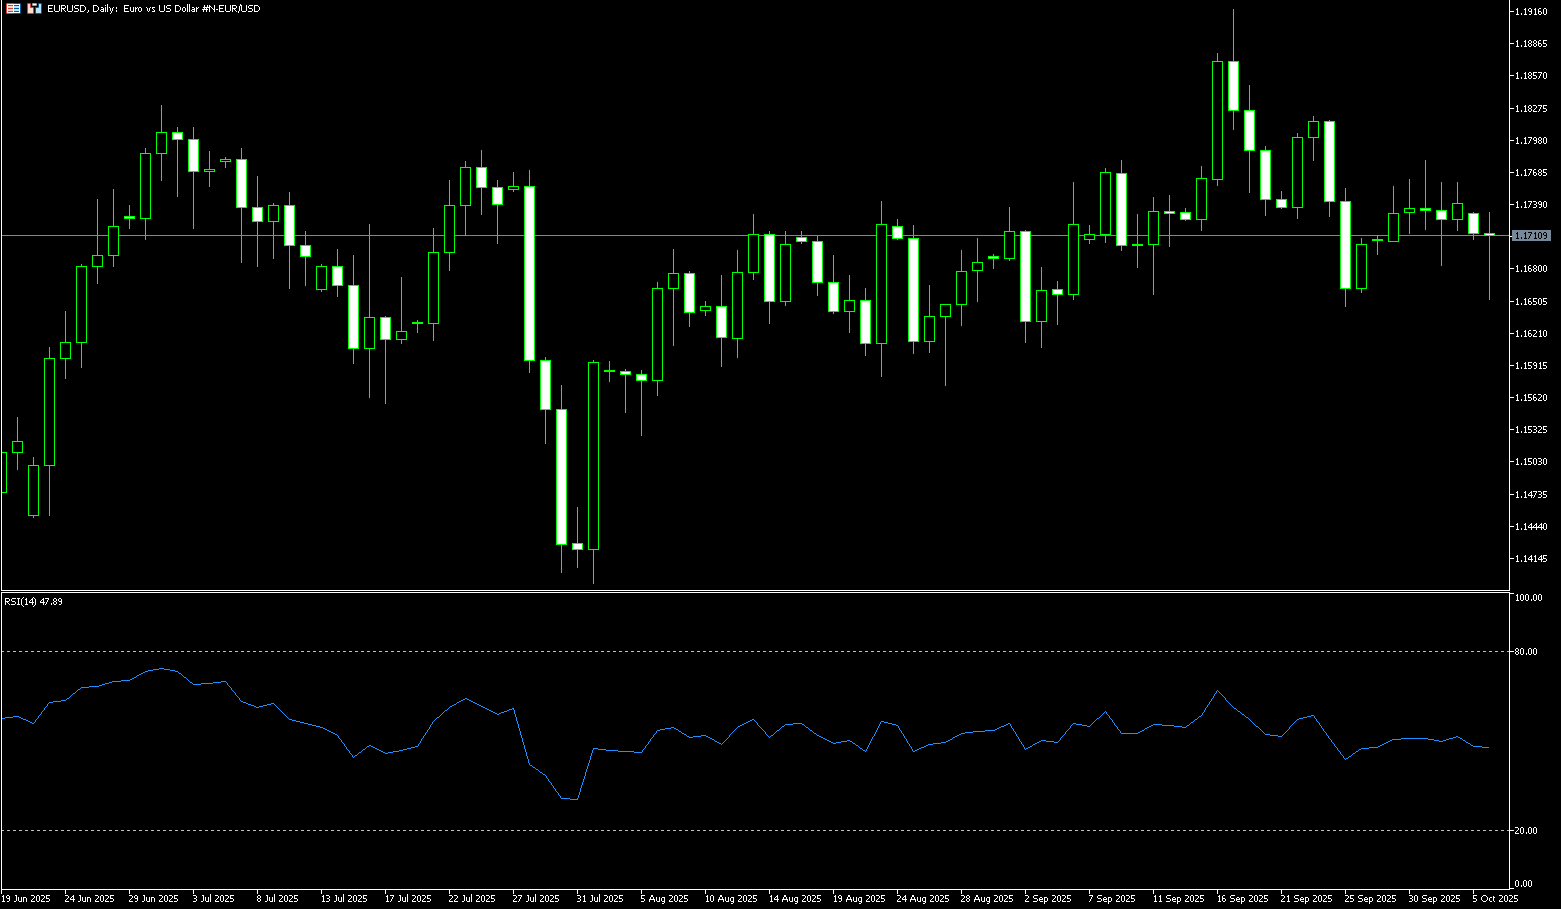
EUR/USD gave up recent gains from the previous trading week, trading below 1.1700 at the start of the week. On Monday, the euro fell to around $1.1660, its lowest level since September 25, following reports that France's new Prime Minister, Sebastien Le Cornu, had resigned. The move, following President Emmanuel Macron's decision to retain a largely unchanged cabinet, sparked swift criticism from the opposition. Le Cornu, who took office less than a month ago, faces the daunting challenge of pushing a budget through a deeply divided parliament. The upcoming fiscal plan is expected to include unpopular spending cuts and tax hikes aimed at curbing France's deficit—the largest in the eurozone—further escalating political tensions and investor concerns.
The daily chart shows that EUR/USD traded sideways above the 1.1700 round-number mark at the start of the week, briefly breaking below its 50-day simple moving average at 1.1680 for the first time in nearly a week. The 14-day Relative Strength Index (RSI) fell to near 48.50. If the RSI remains within the 45.00-55.00 range, EUR/USD will remain sideways. While the pair favors a bullish bias, traders must break above last week's high of 1.1778 to challenge the psychologically important 1.1800 level. A break above the latter would expose the July 1 high of 1.1830, followed by a test of the yearly high of 1.1918. Conversely, if EUR/USD fails to reclaim its 50-day simple moving average at 1.1682, the target is 1.1650, followed by the 100-day simple moving average near 1.1620, and then the 1.1600 round-number mark.
Today, you can consider going long on EUR at 1.1700, stop loss: 1.1690, target: 1.1750; 1.1760
Disclaimer: The information contained herein (1) is proprietary to BCR and/or its content providers; (2) may not be copied or distributed; (3) is not warranted to be accurate, complete or timely; and, (4) does not constitute advice or a recommendation by BCR or its content providers in respect of the investment in financial instruments. Neither BCR or its content providers are responsible for any damages or losses arising from any use of this information. Past performance is no guarantee of future results.
更多報導


 English
 简体中文
简体中文
 繁體中文
繁體中文
 Bahasa
Melayu
Bahasa
Melayu
 Tiếng
Việt
Tiếng
Việt
 ไทย
ไทย
 日本語
日本語
 한국어
한국어
 ភាសាខ្មែរ
 español


