


0
US Dollar Index
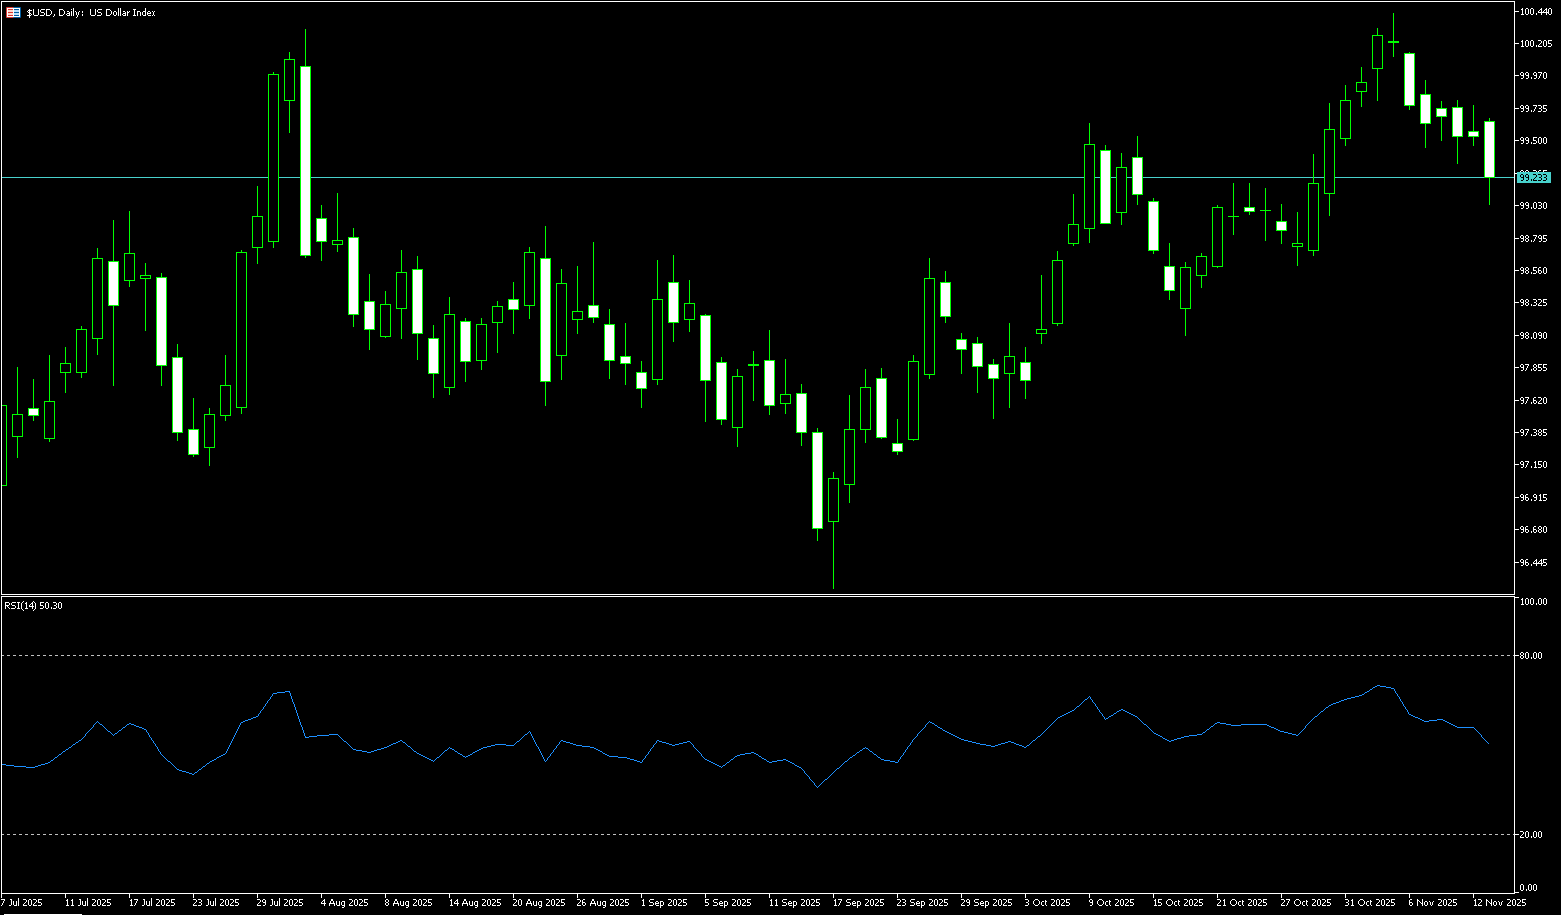
The US dollar index remained stable below 99.30 on Thursday, hitting a two-week low of 98.98. It has traded sideways at low levels so far this week after the House of Representatives passed a short-term funding bill, ending the longest government shutdown in US history. The measure is expected to be signed into law by President Trump, allowing government operations to resume within days. The end of the shutdown will also pave the way for a series of economic reports, although the White House said on Wednesday that October's jobs and CPI data may never be released. Regarding monetary policy, the market expects a 60% probability of a 25 basis point rate cut by the Federal Reserve in December, down from about 67% the previous day. Earlier this week, ADP data showed that private employers laid off about 11,250 people per week in the four weeks ending in October, exacerbating concerns about the labor market.
Since hitting an annual low of 96.22 in mid-September, the dollar has risen more than 3% so far. Currently, the 14-day Relative Strength Index (RSI) has retreated to 52, indicating that momentum remains weak. However, a more sustainable rally requires the US dollar index to convincingly break through the psychological level of around 100.00 and the key 200-day simple moving average area of 100.09. A break above these resistance areas would target the November 5 high of 100.36. Conversely, temporary support lies at the psychological level of 98.98 (Thursday's low) and the psychological level of 99.00, with the next support level at the 50-day simple moving average of 98.52.
Today, consider shorting the US Dollar Index at 99.28, with a stop-loss at 99.40 and targets at 98.80 and 98.70.
WTI Crude Oil
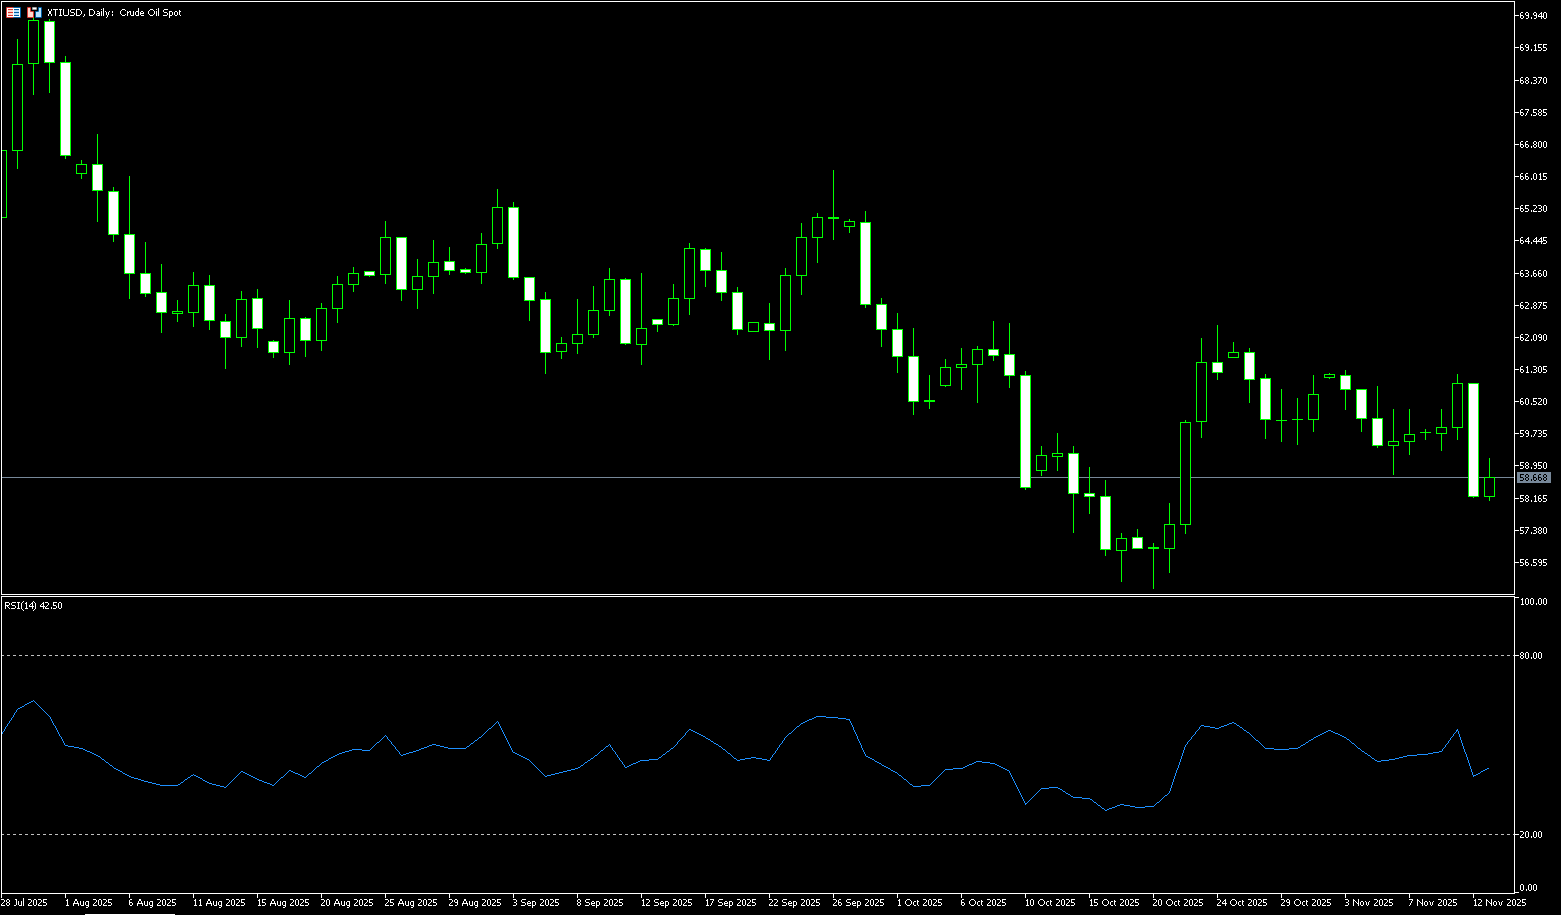
US crude oil is trading around $58.60 per barrel. Oil prices fell more than 4% on Wednesday, mainly due to an OPEC report predicting that global oil supply will reach parity with demand in 2026, marking a further shift in its forecast from a supply shortage to a supply-demand balance. From a fundamental perspective, although hopes for a demand rebound are emerging, crude oil remains under pressure from oversupply. The Organization of the Petroleum Exporting Countries and its partners (OPEC+) recently announced a pause in production increases in the first quarter of 2026, but previous production increases are still having an impact. Meanwhile, the US government's reopening may boost consumer confidence and oil demand in the short term, but at current inventory levels, this impact is likely to be relatively mild. New uncertainties have been added to the demand-side debate, with the International Energy Agency (IEA) releasing a major announcement on Wednesday, abandoning its previous forecast that global oil demand would peak this decade.
The daily chart shows that WTI crude oil is currently fluctuating between $60.00 (a psychological level) and a near three-week low of $58.12. At the beginning of the week, oil prices briefly tested $61.20 (this week's high) but failed to sustain the upward momentum. Combined with the 55-day simple moving average at $61.27, this forms a key short-term resistance area; initial resistance is at $60.00 (the psychological level). Currently, the 14-day Relative Strength Index (RSI) has fallen to 40.00, indicating continued weak momentum. If oil prices continue to trade below the psychological level of $60.00 and the 9-day simple moving average of $59.71, it will open up downside potential to $57.31 (the low of October 22nd), and a break below that would target the psychological level of $57.00.
Today, consider going long on crude oil at 58.45, with a stop-loss at 58.30 and targets at 59.90 and 60.00.
Spot Gold
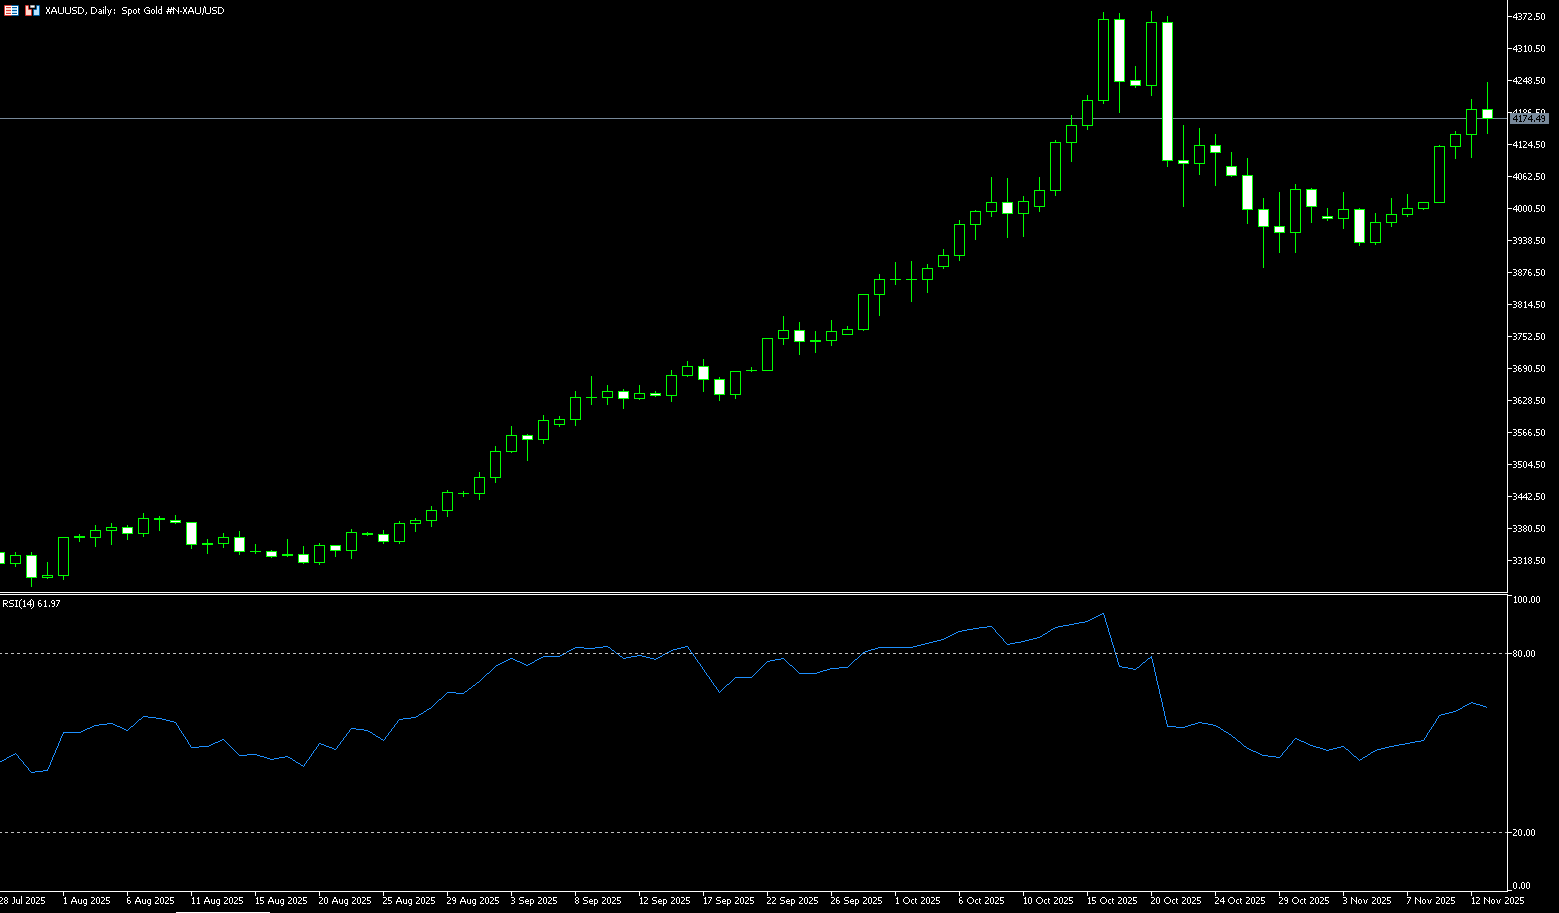
After several weeks of silence, the gold market has once again become the focus of global investors. Gold prices surged more than 4% in a single week, strongly breaking through the key level of $4,160 per ounce, and once touched a high of $4,245 during the session, marking the highest level since October 21. This sudden surge was not accidental, but the inevitable result of multiple factors. On Thursday during the US session, spot gold traded around $4,180 per ounce; the market generally expected a flood of economic data after the government reopened, with September's employment data likely to be released first. However, the White House also cautiously warned that the October employment and inflation reports might not be released due to data collection difficulties. This uncertainty, in turn, exacerbated market concerns about the economic situation, providing continued momentum for gold's rise. With the US government about to reopen, gold is approaching the $4,200 mark, and its future movement will closely depend on economic data and policy signals from the Federal Reserve. In this era of uncertainty, gold's brilliance may have only just begun to shine.
Gold's upward trend remains intact, but a strong gain of over 4% in the first half of the week suggests that prices may consolidate in the short term. The 14-day Relative Strength Index (RSI) on the daily chart confirms further upside potential to the 65.25 level, with the RSI continuing to climb. A daily close above $4,250 could push prices towards $4,300, followed by the all-time high of $4,381. Conversely, the first support level is at the October 22 high of $4,161, followed by the psychological level of $4,100. A break below the latter would expose prices before the 20-day simple moving average at $4,075, and then test the psychological level of $4,000.
Consider going long on gold at 4,173 today, with a stop loss at 4,168 and targets at 4,200 and 4,210.
AUD/USD
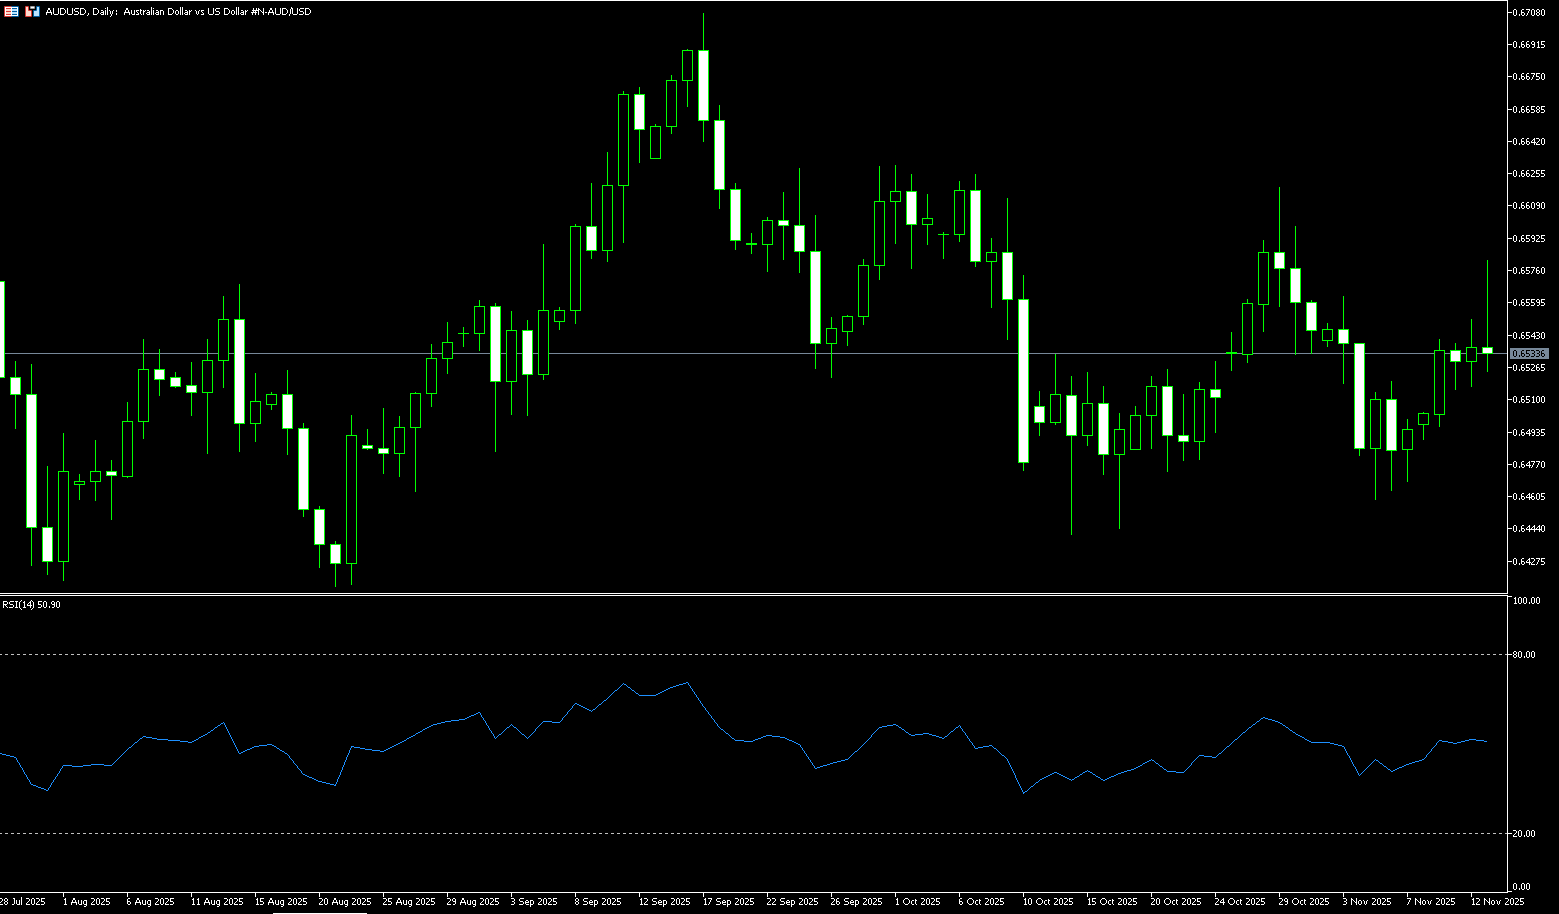
The Australian dollar rose to around US$0.6580 on Thursday, extending its gains to a two-week high, after solid employment data reduced the prospect of a near-term interest rate cut. Data from the Australian Bureau of Statistics showed that employment surged by 42,200 in October, more than double the forecast. The unemployment rate also fell to 4.3%, below the forecast. The strong data reinforced the Reserve Bank of Australia's view that the labor market remains tight, leaving policymakers with little urgency for further easing after three rate cuts this year. The market quickly priced in expectations of another rate cut, with the probability of a May 2026 rate cut falling from nearly 70% before the release to 32%. The data also highlighted stronger consumer demand and renewed confidence in the economy, consistent with signs of improved sentiment and a steady recovery in the housing market.
The Australian dollar traded around 0.6530 against the US dollar on Thursday. From the daily chart, the pair appears to be consolidating within a rectangular range, exhibiting a sideways trend. Nevertheless, it remains above the 10-day simple moving average at 0.6521, indicating strong bullish momentum in the short term. AUD/USD may target the psychological level of 0.6600. A break above this rectangle would create a bullish bias and push the pair to test the upper boundary of the rectangle around 0.6630. The next level is 0.6707 (the high of September 17th). On the downside, immediate support lies at the 10-day simple moving average at 0.6521, followed by 0.6500 (a psychological level). A break below these levels would weaken medium- to short-term price momentum and prompt AUD/USD to test the 200-day simple moving average near 0.6455 and the five-month low of 0.6414 reached on August 21st.
Consider going long on the Australian dollar at 0.6520 today, with a stop loss at 0.6510 and targets at 0.6570 and 0.6580.
GBP/USD
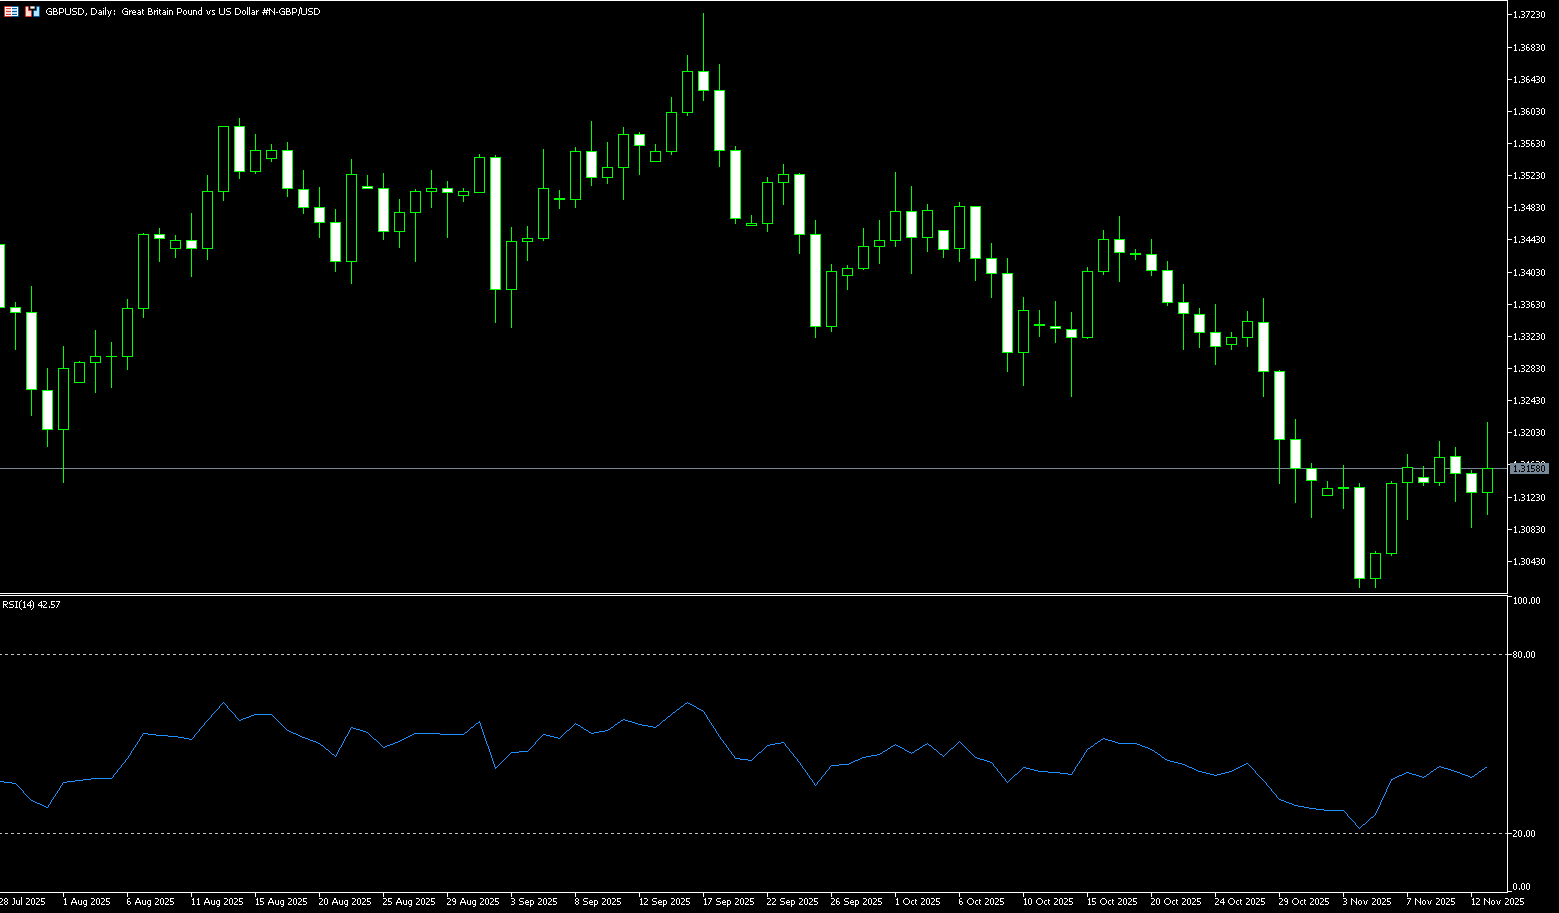
During Thursday's American trading session, the pound remained weak against the dollar, hovering around 1.3180. The market is widely concerned that the Bank of England may cut interest rates in December against the backdrop of sluggish economic growth and slowing inflation. The Bank of England's policy outlook has been closely watched recently. Bank of England policymaker Megan Green noted on Tuesday that next year's wage agreement level is "above the ideal range" and expressed concern about persistent inflation. She emphasized that monetary policy may still need to maintain a certain degree of tightening to ensure that inflationary pressures truly subside. However, the market generally believes that if economic data weakens further, the Bank of England may be forced to ease monetary policy earlier than expected, an expectation that limits the pound's upside potential. On the other hand, the Federal Reserve stated that the October employment and inflation data report "will not be released at this time," meaning that the delay in some economic data may temporarily affect market judgment.
From a macro perspective, the current weakness of the pound sterling reflects not only domestic economic uncertainty in the UK but also the divergence in policy pace between the Federal Reserve and the Bank of England. GBP/USD may accelerate its decline. Conversely, if the economy unexpectedly stabilizes, the pound could rebound to above 1.3200. Technically, GBP/USD has been under pressure for three consecutive days, consolidating between 1.3084 (November 12 low) and 1.3200 (psychological level). Short-term support is around 1.3084; a break below this level could lead to further declines towards 1.3010 (November 4 low) and 1.3000 (psychological level). Resistance levels are concentrated at 1.3200 (psychological level) and 1.3278 (200-day simple moving average); a break above these levels could trigger a short-term rebound.
Today, consider going long on GBP at 1.3175, with a stop-loss at 1.3162 and targets at 1.3230 and 1.3240.
USD/JPY
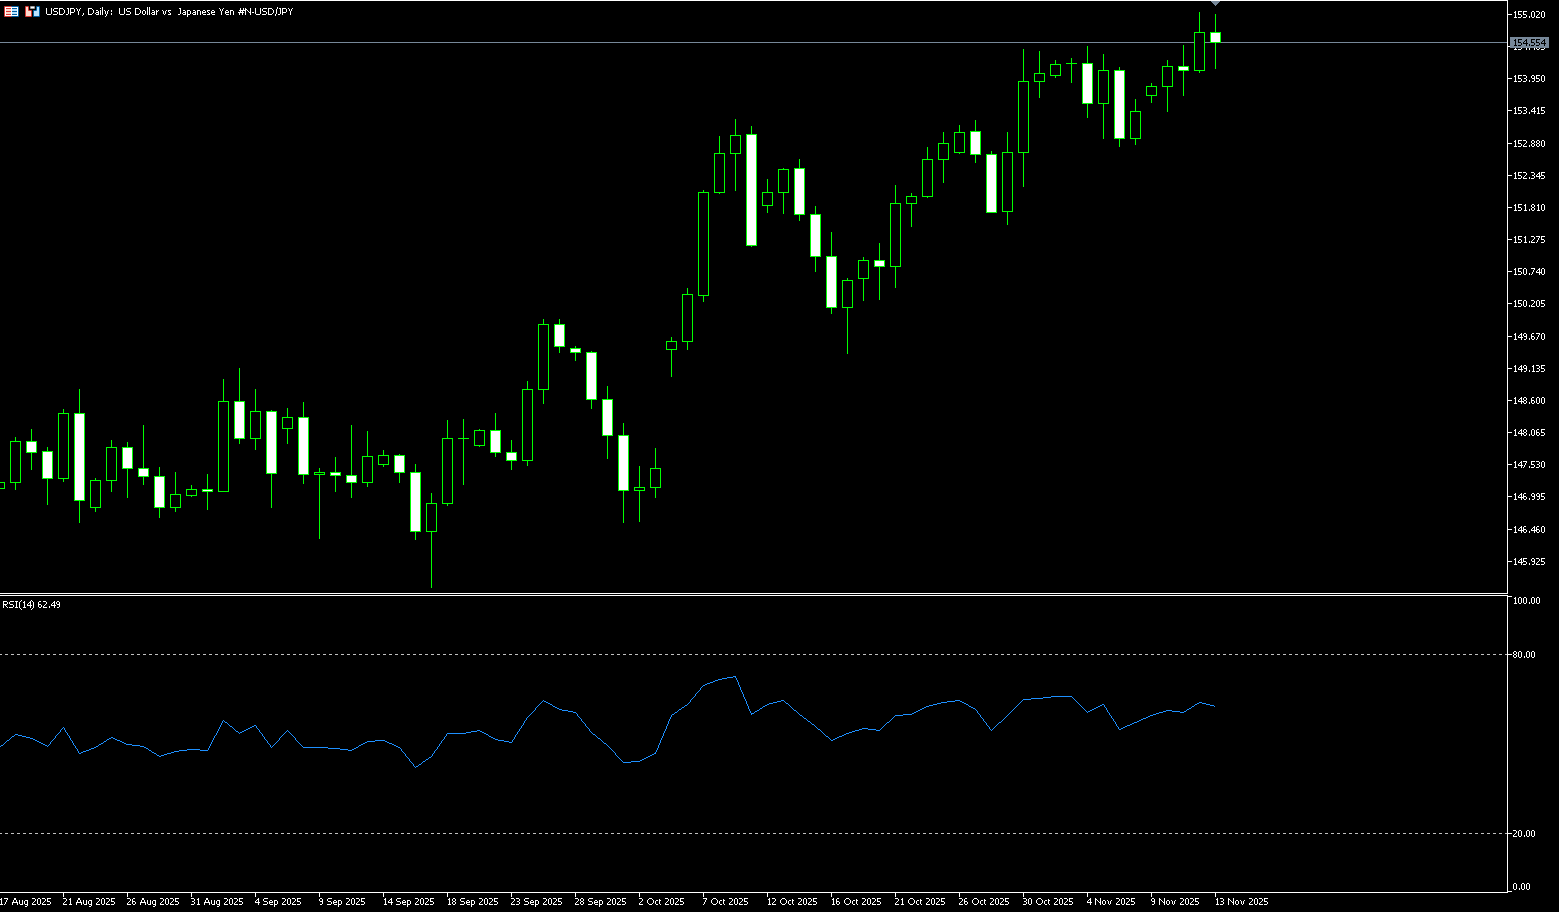
The yen continued to weaken during Thursday's Asian session, despite slightly optimistic comments from Bank of Japan Governor Kazuo Ueda, who stated that underlying inflation is gradually accelerating and approaching the central bank's 2% target. However, market doubts remain about when the central bank will tighten policy, especially given Prime Minister Sanae Takaichi's insistence on continuing the "Abenomics" policy mix and maintaining low interest rates. Meanwhile, the easing of the US government shutdown crisis has led to increased global risk appetite, weakening the appeal of the safe-haven yen. Ueda pointed out that the improvement in the Japanese economy is supported by wage growth, with household income and consumption showing resilience. He emphasized that the central bank will help achieve moderate and sustainable inflation by maintaining an accommodative environment. Prime Minister Takaichi reiterated on Wednesday that the government and the central bank will continue to work closely together to promote domestic economic development and hopes the central bank will fully cooperate with fiscal policy. This statement has sparked market speculation that Japan may consider intervening in the foreign exchange market to curb the yen's decline.
From an overall perspective, the policy divergence between the Japanese government and the central bank has become the focus of the market. Sanae Takashi's stimulus stance and Kazuo Ueda's moderate tightening signals have created a "policy tug-of-war," making it difficult for the market to predict the yen's medium-term trend. In the short term, if the government does indeed take foreign exchange intervention measures, the yen may experience a phased rebound; however, if some of these measures remain merely verbal, the USD/JPY pair may still head towards the 156 level. Technically, the USD/JPY pair broke through the 154.50 resistance level (November 4th high) mid-week, forming new upward momentum. If the price stabilizes above the psychological level of 155.00, it will confirm the continuation of the bullish trend, with a target range around 155.88 (January 31st high) to 156.00 (psychological level). Conversely, if the exchange rate falls below 154.17 (the 5-day simple moving average), it may find support around 154.00, but a break below 154.00 would trigger technical selling, potentially pushing it further down to the 153.50 area.
Consider shorting the US dollar at 154.75 today. Stop loss: 155.00. Target: 153.70, 153.50
EUR/USD
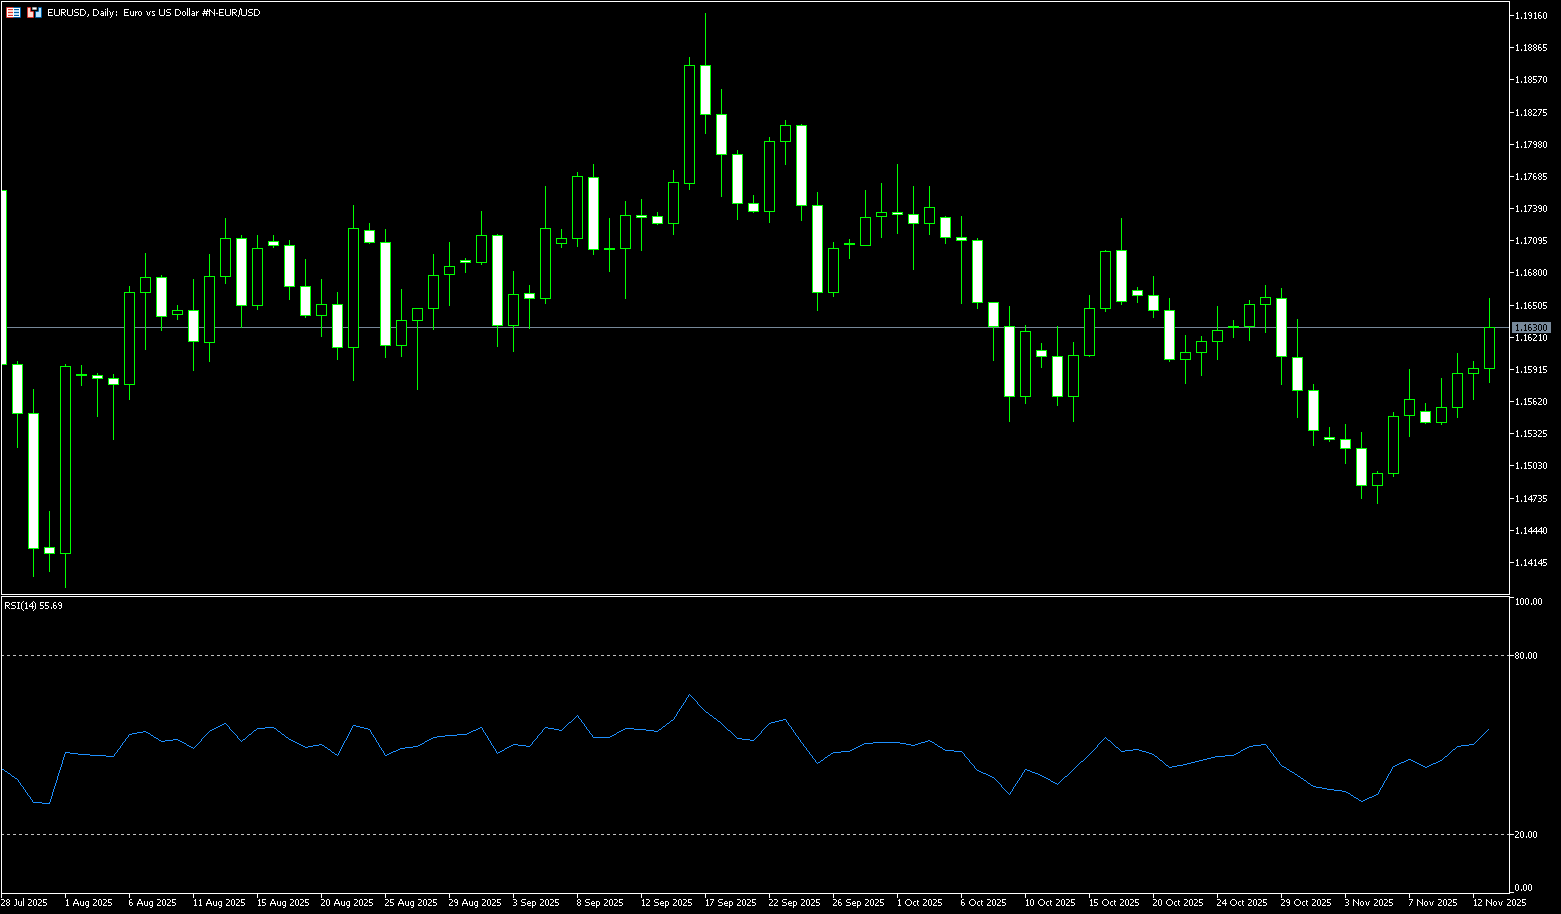
The EUR/USD pair fluctuated slightly after six consecutive days of gains, trading around 1.1630 on Thursday. The dollar remained stable as US President Trump signed the government funding bill on Thursday, officially ending the record 43-day government shutdown in US history. The dollar remained silent amid uncertainty surrounding the US economic outlook and the Fed's policy outlook. On the other hand, the EUR/USD pair may continue its upward momentum as the euro is supported by a cautious outlook for the European Central Bank's policy. The ECB is expected to keep interest rates unchanged for the time being, benefiting from stable economic performance and inflation near its target. European Central Bank Executive Board member Isabel Schnabel said on Wednesday that there was no need to adjust interest rates under current conditions, emphasizing that the central bank's main focus remains core inflation. Schnabel added that interest rates are "absolutely" at an appropriate level, while noting that food price inflation remains relatively strong.
On the daily chart, the bearish trend of the 100-day simple moving average at 1.1664 limited gains near the intraday high. Meanwhile, momentum indicators are directionless below the midline, while the RSI is slightly upward, around 50, showing a slight positive skew. EUR/USD is trading slightly above 1.1600, indicating limited downside. The rising 5-day simple moving average around 1.1583 provides near-term support. The 14-day Relative Strength Index (RSI) is near positive territory, reflecting a relatively stable trend. Downside potential lies at 1.1500, which would expose the 5-day cycle low of 1.1468, reinforcing the broader downtrend. Conversely, the October 17 high of 1.1650 and the 100-day simple moving average of 1.1664 are key resistance levels for the upside; a break above these levels would pave the way for a challenge of the 1.1700 level.
Today, consider going long on the Euro at 1.1620, with a stop-loss at 1.1606 and targets at 1.1660 and 1.1670.
Disclaimer: The information contained herein (1) is proprietary to BCR and/or its content providers; (2) may not be copied or distributed; (3) is not warranted to be accurate, complete or timely; and, (4) does not constitute advice or a recommendation by BCR or its content providers in respect of the investment in financial instruments. Neither BCR or its content providers are responsible for any damages or losses arising from any use of this information. Past performance is no guarantee of future results.
更多報導


風險披露:衍生品在場外交易,採用保證金交易,意味著具有高風險水平,有可能會損失所有投資。這些產品並不適合所有投資者。在進行交易之前,請確保您充分了解風險,並仔細考慮您的財務狀況和交易經驗。如有必要,請在與BCR開設帳戶之前諮詢獨立的財務顧問。
BCR Co Pty Ltd(公司編號1975046)是一家依據英屬維京群島法律註冊成立的公司,註冊地址為英屬維京群島托爾托拉島羅德鎮Wickham’s Cay 1的Trident Chambers,並受英屬維京群島金融服務委員會監管,牌照號碼為SIBA/L/19/1122。
Open Bridge Limited(公司編號16701394)是一家依據2006年《公司法》註冊成立並在英格蘭及威爾斯註冊的公司,註冊地址為 Kemp House, 160 City Road, London, City Road, London, England, EC1V 2NX. 本公司僅作為付款處理方,並不提供任何交易或投資服務。

 English
 简体中文
简体中文
 繁體中文
繁體中文
 Bahasa
Melayu
Bahasa
Melayu
 Tiếng
Việt
Tiếng
Việt
 ไทย
ไทย
 日本語
日本語
 한국어
한국어
 ភាសាខ្មែរ
 español