


0
US Dollar Index
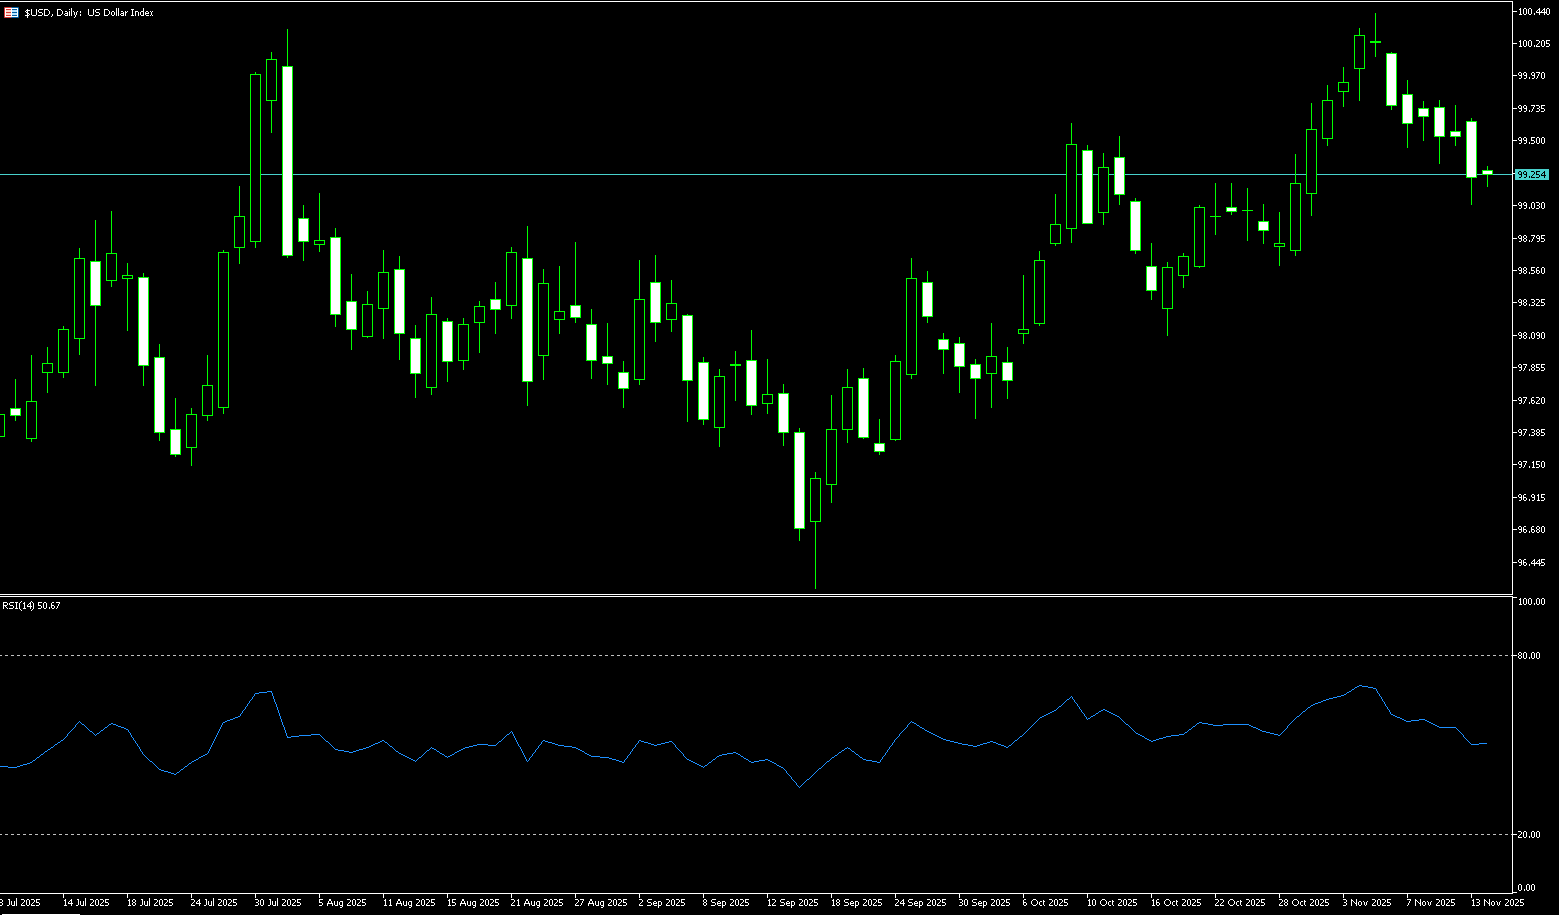
The US dollar index saw its second consecutive weekly decline, briefly falling below the 99.00 level in late last week. Investors worried that the data backlog following the reopening of the US government could reveal an economic slowdown. This is a classic "buy the rumor, sell the fact" scenario: the government reopening eliminated uncertainty, but led to a collective profit-taking by investors, dragging the dollar into a vortex of declines in the stock, bond, and precious metal markets. The recent decline in the dollar coincided with the sell-off in US stocks and bonds, reflecting weakening confidence in US assets amid escalating uncertainty. US President Trump signed a short-term funding bill last week, ending the longest government shutdown in US history and paving the way for the backlog of economic reports. However, the White House stated that some October data may never be released because some agencies were unable to collect data during the shutdown, adding to the uncertainty. The market also reduced bets on a December Fed rate cut, now with about a 50% chance of a 25 basis point reduction, compared to over 95% a month ago, although expectations for rate cuts next year remain unchanged.
The technical chart of the US dollar index last week showed initial signs of a reversal. On the daily chart, the dollar index is currently hovering slightly above 99.00. At present, the index is close to the Bollinger Band middle line at 99.34, with the band slightly upward, indicating that the bearish pressure may be easing. The MACD has converged after a death cross, and the histogram is shortening slightly below the zero line, suggesting a weakening of downward momentum. This indicator combination echoes the fiscal developments in the fundamentals: the dollar has rebounded from a two-week low of 98.98 (the low on November 13), and short-term bulls are attempting to recreate last week's high of 99.74, and even return to the psychological level of 100.00. However, the sustainability of this rebound is highly dependent on subsequent data confirmation: if the delayed official employment report continues the softening tone of the private sector, the dollar's bullish momentum will quickly fade. The first support zone is between 99.00 (psychological level) and 98.98 (November 13 low). This zone is based on static support from recent lows and psychological levels, driven by oversold conditions after five consecutive days of declines. A break below this level would widen the downtrend to 98.54 (50-day simple moving average) and 98.44 (lower Bollinger Band).
Today, consider shorting the US Dollar Index near 99.40; Stop loss: 99.53; Target: 98.90; 98.80
WTI Crude Oil
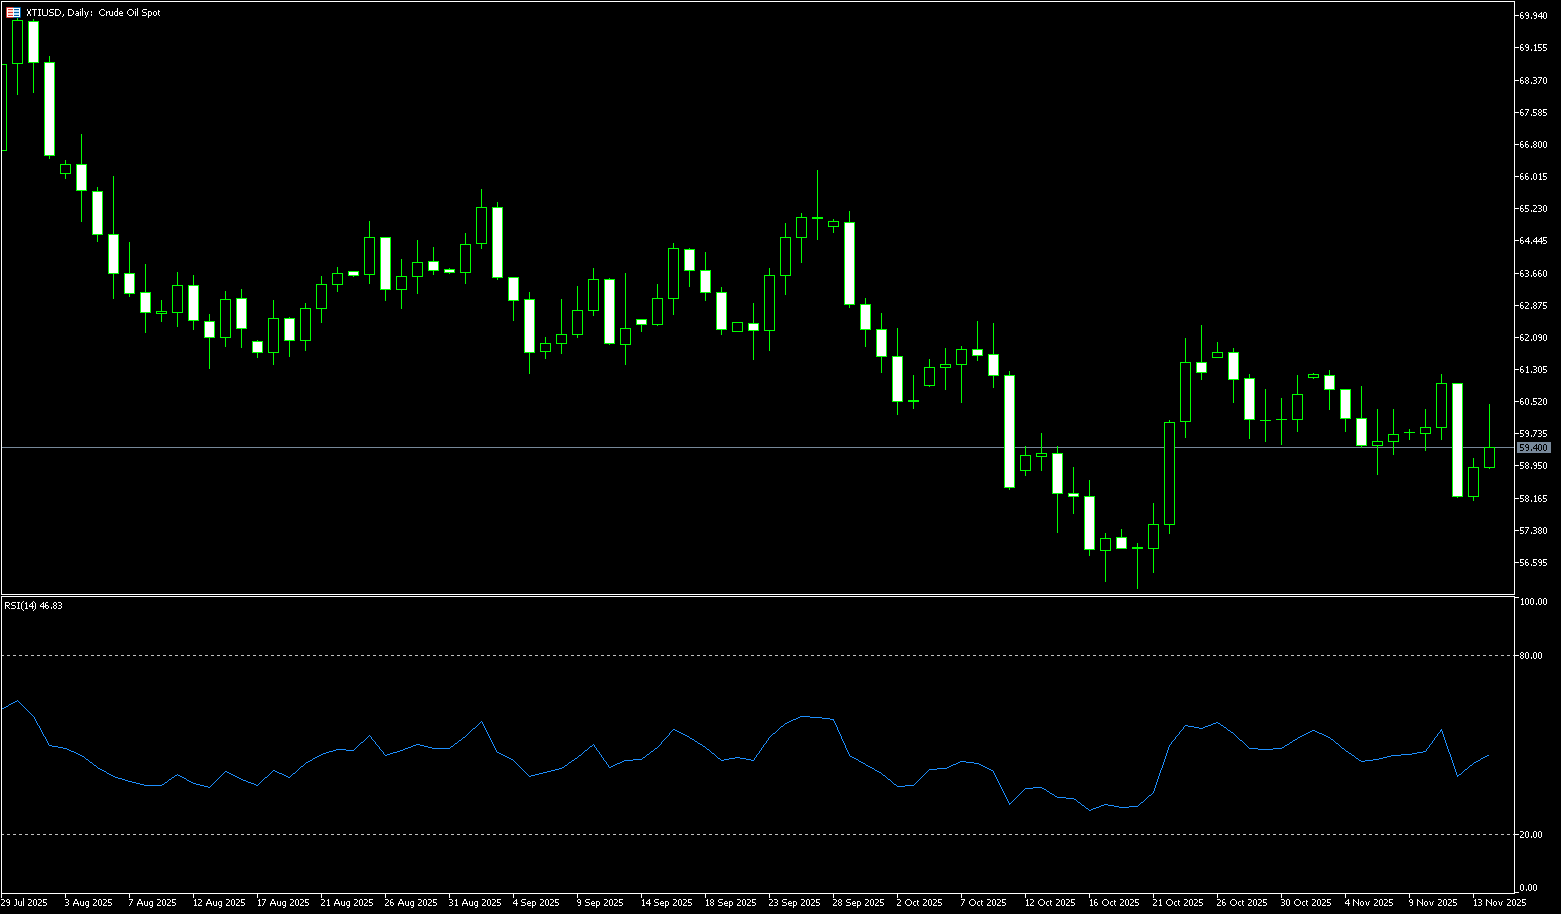
WTI crude oil traded slightly below $60/barrel before last week. The market weighed ongoing concerns about a global supply glut against potential supply disruptions from sanctions on Russia's Lukoil. Oil prices should find considerable support around $60/barrel, especially considering the potential short-term disruption to Russian exports should stricter sanctions be implemented. Last week, WTI crude oil prices plummeted below $60 per barrel, a drop of over 4%, driven by market reactions to a shift in the supply-demand dynamics—recent signals indicate continued easing of supply pressures and a weakening demand growth momentum that may persist into early 2026. On the other hand, with increased production and rising inventories among non-OPEC oil-producing countries, the organization abandoned its earlier supply gap forecast. This revised view was detailed in OPEC's monthly oil market report, triggering a new round of selling. The market reaction was immediate. Traders stated that the latest revision confirmed that supply was exceeding previous demand expectations, especially given that updated data from the International Energy Agency also pointed to slowing consumption growth. As funds reduced their long positions, crude oil futures continued to decline, further exacerbating the downward pressure that had already begun to emerge at the start of last week—when oil prices had already fallen due to weakening market sentiment and declining refinery utilization rates.
The daily chart shows that after WTI crude oil prices reached highs of $76.74 in late June and $70.02 per barrel in July, a downward trend line with consecutive lower highs and lows was formed, until it found support at $55.97 on October 20th. Recently, oil prices have formed a potential downward channel. After a significant drop in the mid-week trading session, oil prices have returned to the downward channel (currently around $60.45). Significantly suppressed by the downward channel, the short-term trend is likely to remain bearish. The Relative Strength Index (RSI) and MACD are both in negative territory, suggesting a more likely downward move in the short term. Therefore, initial support levels are $58.12 (last week's low) and $58.00 (a psychological level). A break below $58.00-$58.12 could further strengthen the bearish momentum to the October 22nd low of $57.31. Ultimately, the October low of $55.97 will once again become the market focus. On the upside, the first resistance is at the psychological level of $60.00, and the $60.45 area (the downward channel resistance line). Oil prices need to recover the $60.00-$60.45 level to potentially test the 65-day simple moving average at $61.54. A break above this level would strengthen the short-term bullish bias and push oil prices to challenge the key resistance area of $62.38 (the October 24 high) and the 85-day moving average at $62.36.
Today, consider going long on WTI crude oil near $59.60; Stop loss: $59.40; Target: $60.80; $61.00
Spot Gold
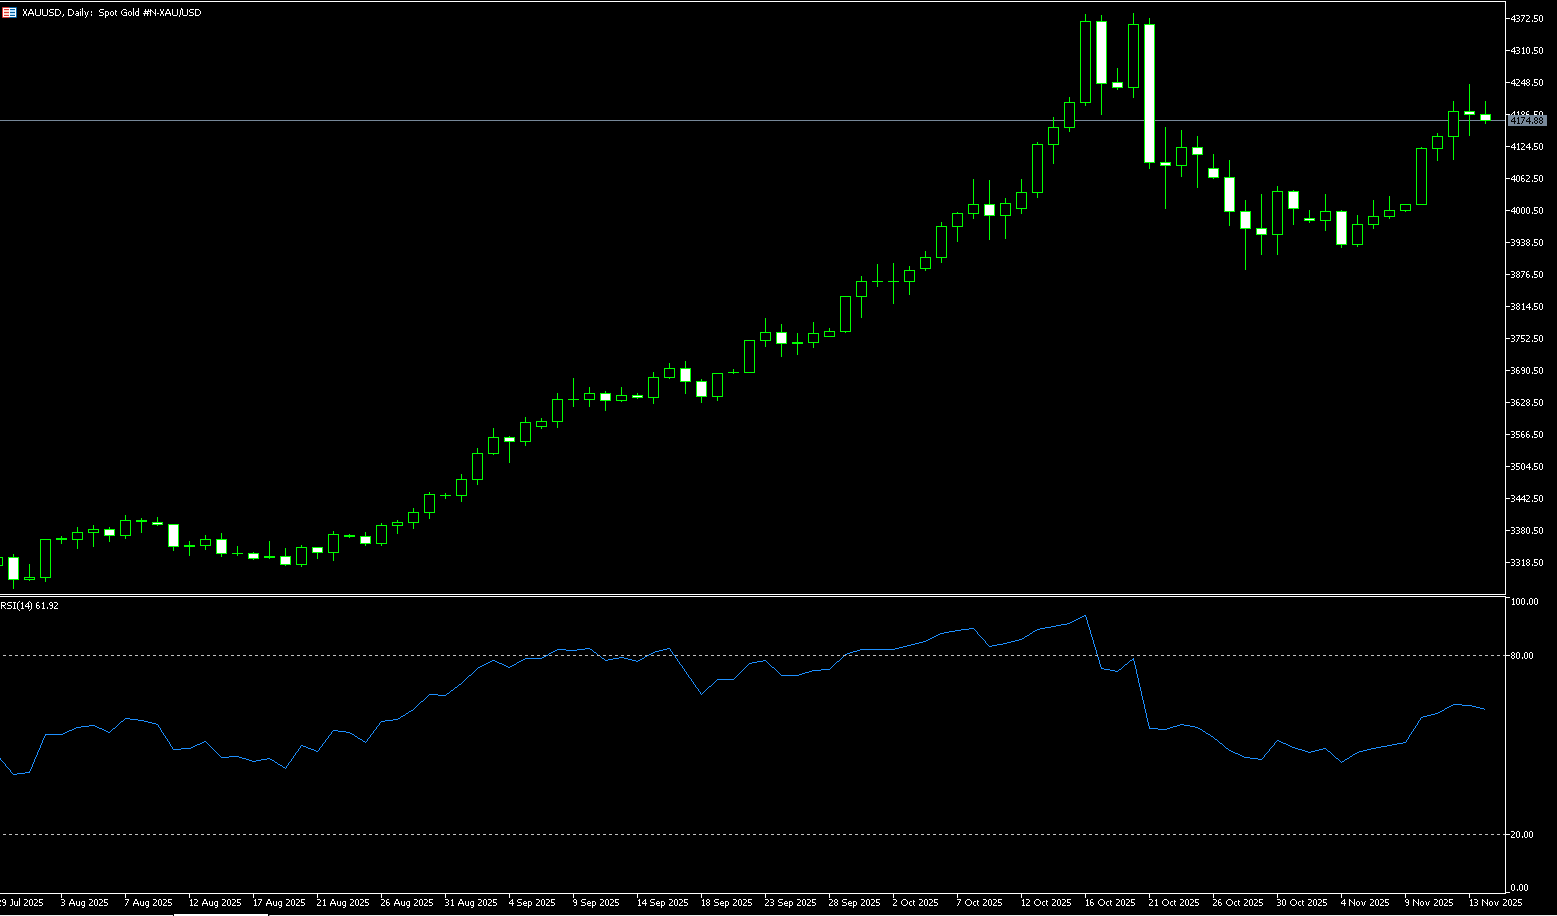
After experiencing the longest shutdown in history at 43 days, the US government finally restarted operations last week with an agreement signed by Trump, with federal funds continuing until January 30. This news should have brought a breather to the market, but unexpectedly triggered a global sell-off in assets. Spot gold rose more than 5% last week, hitting a three-week high of $4,245 before falling sharply, but still posting its biggest weekly gain in four weeks. Before the weekend, gold prices plummeted more than 4.0% from their three-week high, hitting a low of $4,032 per ounce. This was a classic "buy the rumor, sell the fact" scenario: government reopening eliminated uncertainty, but led to widespread profit-taking by investors, dragging the precious metals market into a vortex of declines in stocks, bonds, and the dollar. On the other hand, the growing divergence in monetary policy among Federal Reserve policymakers became a key driver of the gold price decline. Despite private sector surveys and ADP data showing a weak job market, inflationary pressures persist. The Fed has already cut interest rates twice this year, and Chairman Powell warned last month that further easing is not a certainty due to data gaps and a relatively stable labor market. In the short term, the gold bull market faces the risk of cooling; if the Fed confirms a pause in easing, investors should be wary of further gold selling. However, from a long-term perspective, the data vacuum left by the shutdown, tariff inflation risks, and geoeconomic uncertainties will continue to support gold's core value as a safe-haven asset. The market is at a turning point, and gold bulls need to patiently wait for clear inflation data or a new safe-haven event to trigger a resumption of the upward trend.
In the short term, the upward trend in gold remains intact. The current price is hovering above the Bollinger Band midline at $4,065.70 on the daily chart, with the band sloping upwards, suggesting continued bullish dominance. While the MACD histogram momentum is slowing, its position above the zero line maintains the integrity of the buy signal. This combination reflects gold's digestion phase after the recent rebound: upward momentum is not yet exhausted. The 14-day Relative Strength Index (RSI) suggests that bullish momentum may be weakening, but it still indicates that buyers are in control. Currently, the key support area is locked around $4,099 (last Wednesday's low) – $4,100 (the psychological level). If gold prices decline, this area will test the strength of the bulls' defense. Intraday trading volume will be crucial: a surge in volume accompanied by a rapid rebound confirms the support level; conversely, a continued break below this level could trigger tests of the psychological levels of $4,000.00 and the 50-day simple moving average at $3,938.50. Regarding resistance, $4,200 (last week's high) acts as a short-term upward bottleneck, as do $4,270 (the upper Bollinger Band) and $4,294. The logic is based on the dynamic resistance of $4,270 (the upper Bollinger Band) and the previous high of $4,381. A break above these levels would challenge the $4,500 level.
Today, consider going long on spot gold around 4,082; Stop loss: 4,077; Target: 4,120; 4,130
AUD/USD
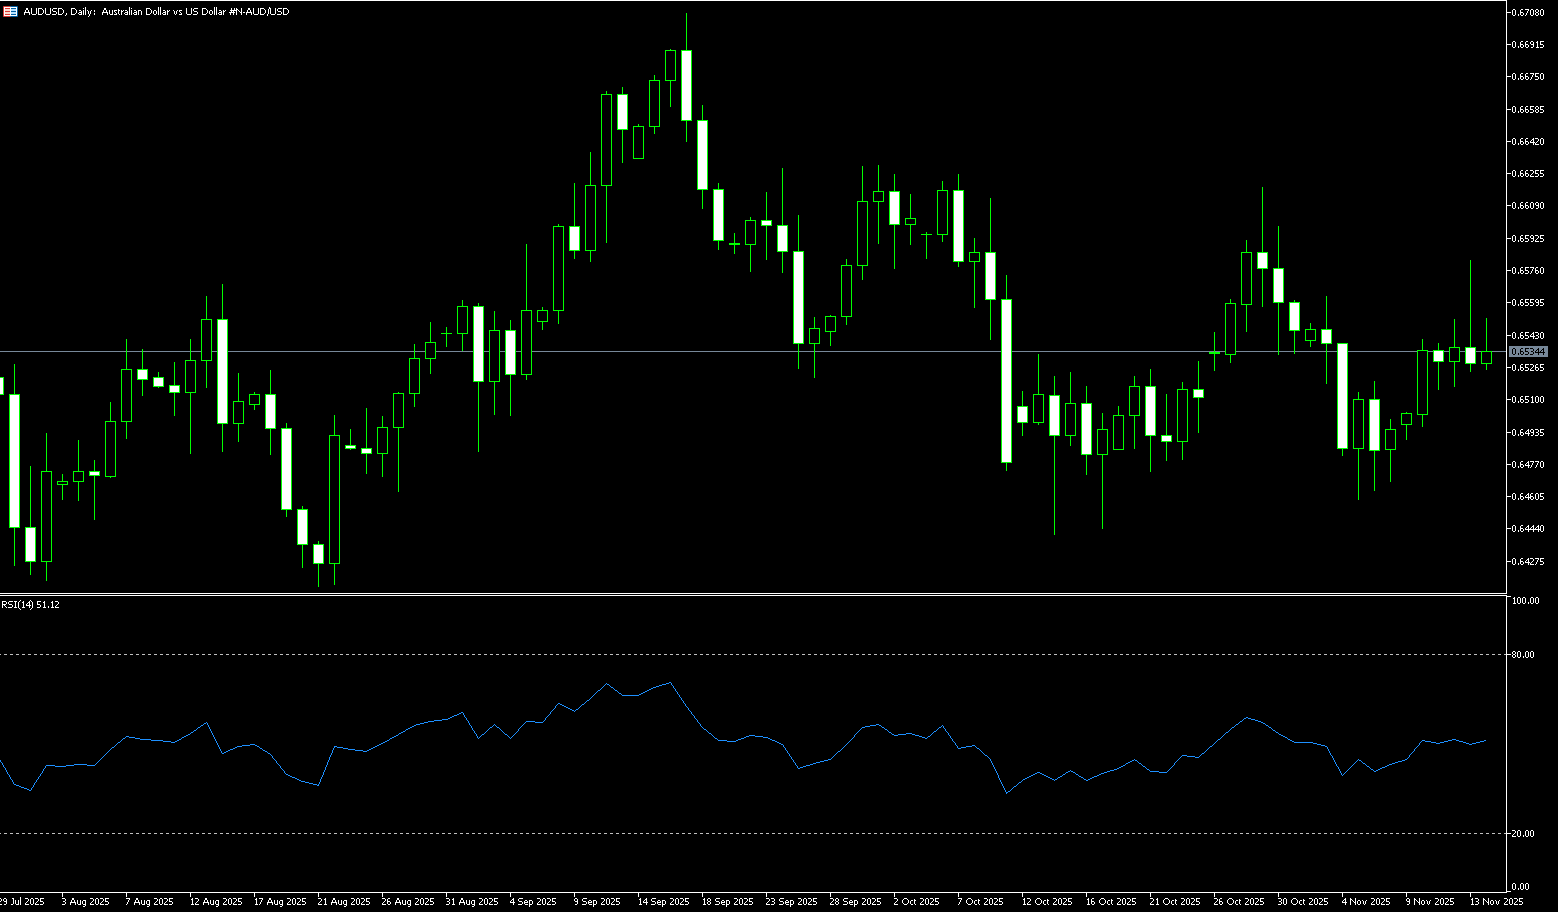
Last week, the Australian dollar appreciated to a near three-week high of US$0.6580, as solid employment data reduced the likelihood of a near-term interest rate cut. Data showed that employment surged by 42,200 in October, more than double the forecast. The unemployment rate also fell to 4.3%, below forecast and down from a near four-year high of 4.5%. The strong data reinforced the Reserve Bank of Australia's view that the labor market remains tight, leaving policymakers with no urgency to further ease policy after three rate cuts this year. The market quickly eliminated expectations of another rate cut. The Australian dollar was supported by improved Australian employment data, which increased caution regarding the RBA's policy outlook. Furthermore, a weaker US dollar provided support as investors worried that a backlog of economic data following the government's reopening could foreshadow slower growth. On the other hand, the Australian dollar found support against the US dollar following the release of China's October industrial production and retail sales data, and the National Bureau of Statistics' overview of its economic outlook at a press conference on Friday, indicating a continued commitment to nurturing new productivity. Any changes in the Chinese economy could impact the Australian dollar, as China is a significant trading partner for Australia.
The Australian dollar rebounded last week, rising to a near three-week high of 0.6580, and is currently trading near 0.6530. On the daily chart, the pair appears to be consolidating above the psychological level of 0.6500, while the 14-day Relative Strength Index (RSI) is near the 50 level, reflecting a continued sideways trading pattern. Nevertheless, the pair remains above the 0.6515 level (the 9-day simple moving average), indicating strong bullish momentum in the short term. The pair may retest last week's highs, around 0.6580. A break above this level would create a bullish bias and support a test of the 0.6600 (psychological level) and 0.6630 (October 1 high), with a further break targeting the 13-month high of 0.6707 reached on September 17. On the downside, immediate support lies at 0.6516 (9-day simple moving average) and the 0.6500 level, followed by the 200-day simple moving average at 0.6456. A break below these levels would weaken medium- to short-term price momentum and prompt the AUD/USD pair to test the five-month low of 0.6414 reached on August 21.
Consider going long on the Australian dollar around 0.6523 today; Stop loss: 0.6510; Target: 0.6570; 0.6580
GBP/USD
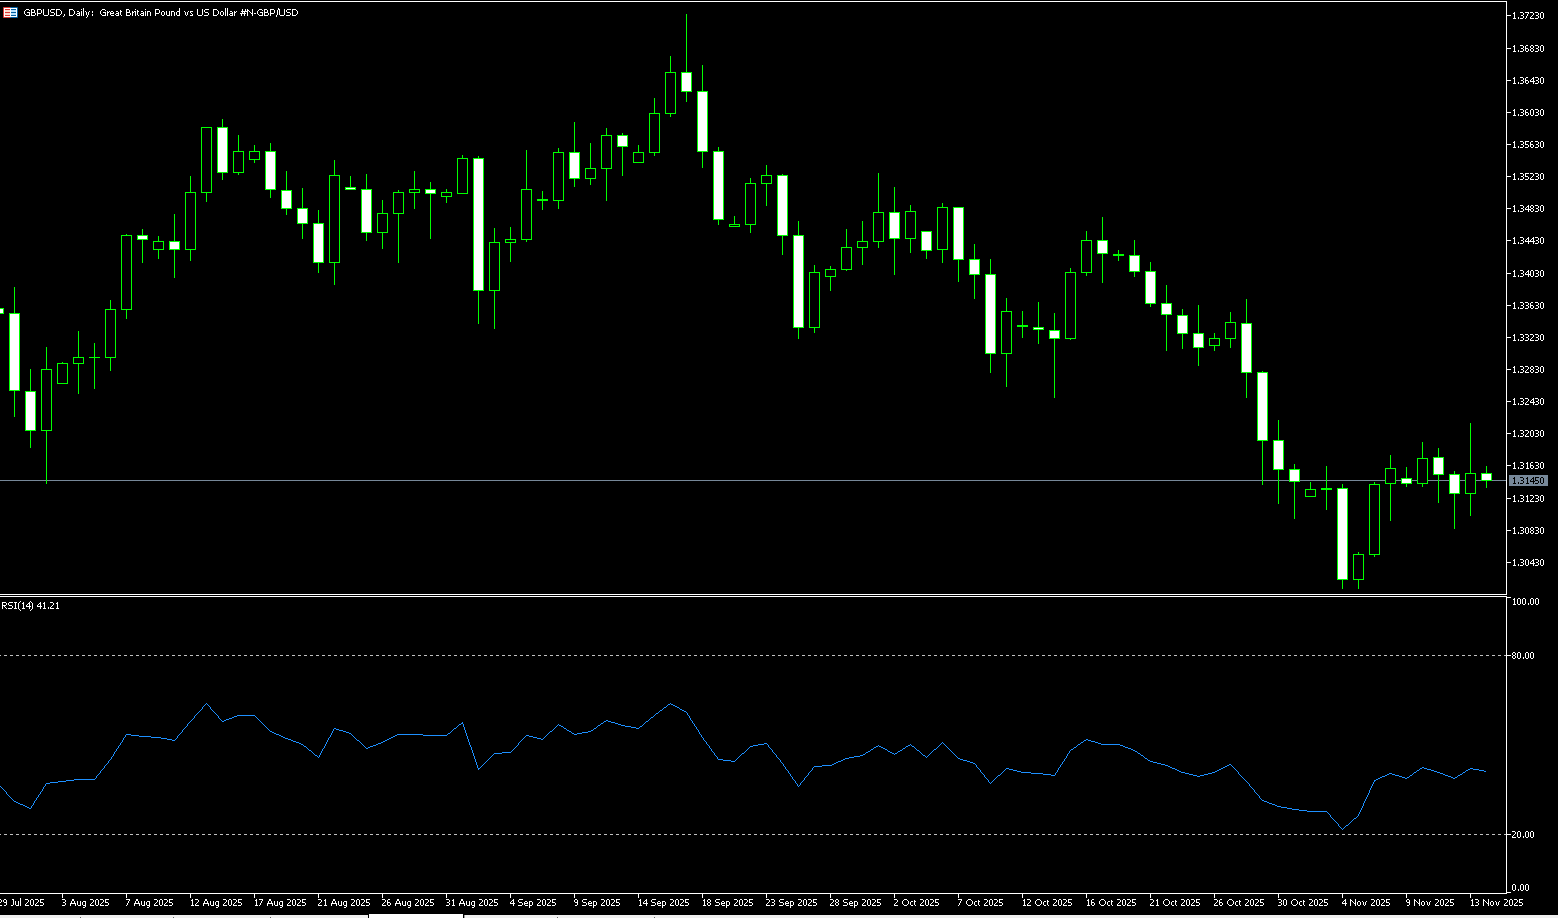
The pound performed poorly last week due to heightened fiscal risks in the UK, weakening against other currencies after the Financial Times reported that Prime Minister Keir Starmer and Chancellor Rachel Reeves might cancel plans to raise basic and higher tax rates in the upcoming autumn budget on November 26. The UK government may avoid increasing the personal burden and seek other indirect revenue to cover the £30 billion fiscal shortfall. The lack of tax increases could trigger fiscal debt risks by increasing interest obligations on government debt. Reports of Chancellor Rachel Reeves canceling plans to raise income tax are putting pressure on the pound. The bond market rally is supported by expectations that the income tax increase will achieve the necessary fiscal tightening without triggering inflation, ultimately leading the Bank of England to cut interest rates in December and beyond. The pound remains weak, and downside risks for the pound have increased. The dollar also faced pressure as investors became cautious awaiting the release of US economic data, which was delayed due to the government shutdown. Investors will be watching the UK's October Consumer Price Index (CPI) data, to be released on Wednesday.
The daily chart shows that the break below the technically important 200-day simple moving average (last traded at 1.3282) since the end of last month is considered a key trigger for bearish sentiment in GBP/USD. Furthermore, the daily Relative Strength Index (RSI) has moved out of oversold territory {initially at 42.88}, which, along with the negative oscillator on the daily chart, suggests that the rebound from the psychological level of 1.3000 and the area around 1.3010 {the November 5th low} may quickly fade. Therefore, it would be prudent to wait for further buying opportunities near last week's high, around the 1.3215 area, before taking further profits. The GBP/USD pair may be heading towards a challenge of the 1.3200 (psychological level) and the 1.3215 (last week's high) area. A break above this level would point towards the 1.3282 (200-day simple moving average), while the 1.3300 level should be a key pivot point for short-term traders. On the other hand, the 1.3100 (psychological level) - 1.3085 (previous low) area may act as immediate support. A break below this area could see GBP/USD retest the psychological level of 1.3000, or the lowest level since April reached last week at 1.3010. Some follow-through selling should pave the way for deeper losses towards the 1.2950 medium-term support, before the spot price could eventually fall below 1.2900.
Today, consider going long on GBP/USD around 1.3155; Stop loss: 1.3142; Target: 1.3200; 1.3210
USD/JPY
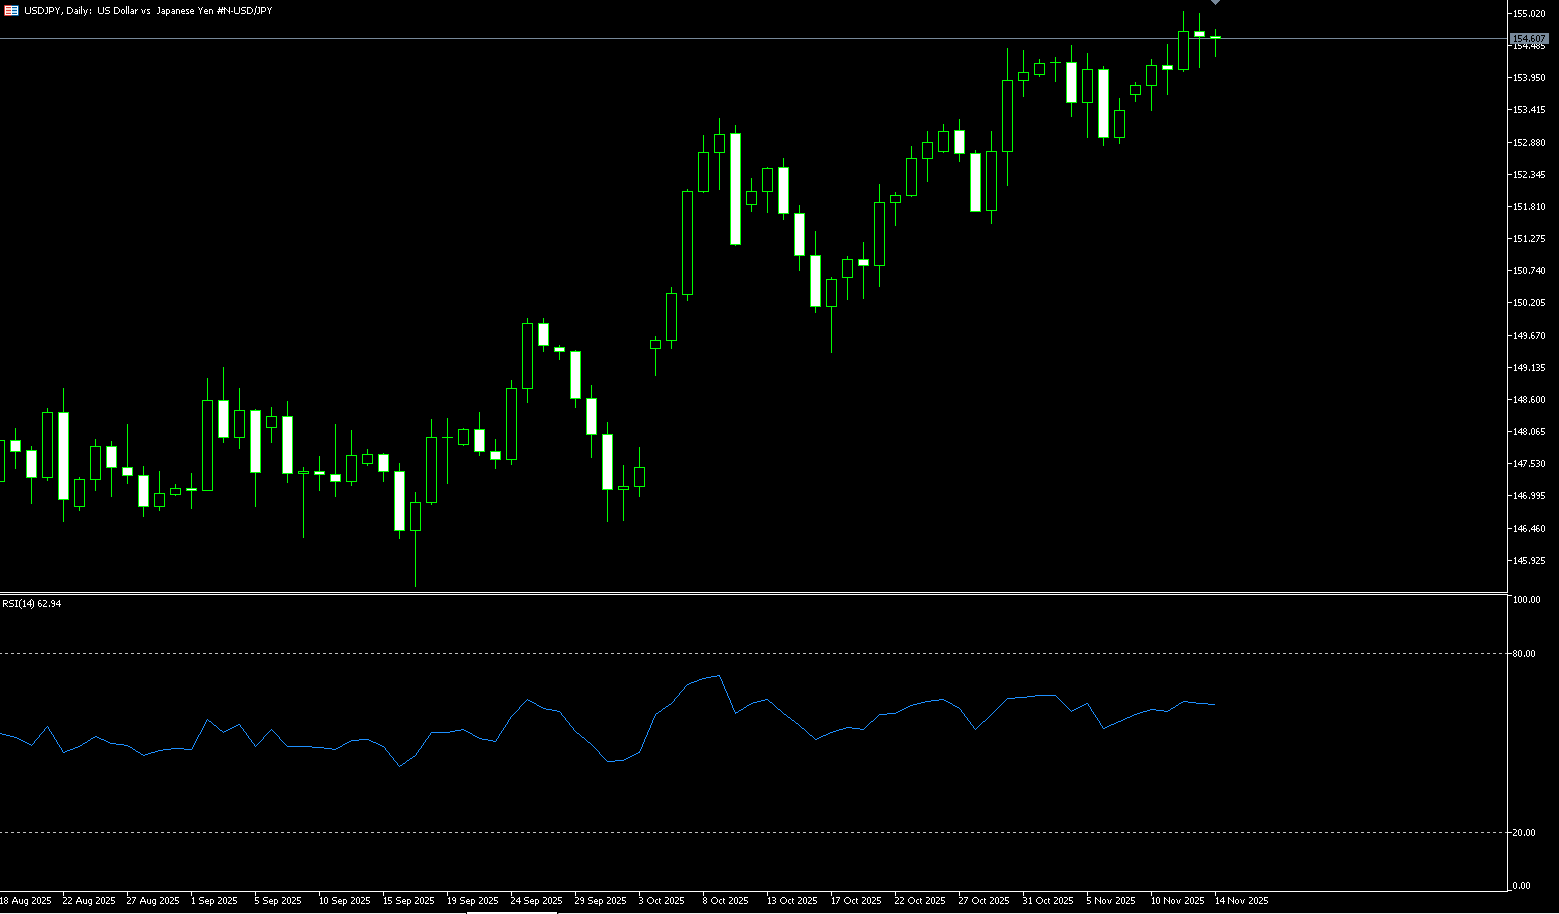
Last week, the yen traded around 154.50 against the dollar, briefly approaching an eleven-month low of 155.05, failing to attract significant yen buying. Japanese Prime Minister Sanae Takaichi stated mid-week that her government wanted interest rates to remain low and called for close policy coordination with the Bank of Japan. This further cooled market expectations for an imminent rate hike, becoming a key factor in the yen's relative underperformance. However, traders still see a 24% probability of a December rate hike by the Bank of Japan and approximately a 46% probability of a January hike. Furthermore, the recent depreciation of the yen prompted warnings from Finance Minister Katayama and Economy Minister Kiuchi regarding currency volatility, fueling concerns about intervention. Katayama reiterated his warning in May against excessive yen depreciation near the 155 level, stating that unilateral and rapid currency fluctuations are undesirable. This, coupled with risk aversion, may support the yen. On the other hand, the dollar hovering near a two-week low amid economic concerns due to heightened uncertainty in the US economy may limit the USD/JPY's gains.
Last week, USD/JPY broke through the 154.45-154.50 resistance level to a 11-month high of 155.05, considered a key trigger for the USD/JPY bulls. Furthermore, the 14-day Relative Strength Index (RSI) on the daily chart remains comfortably in positive territory {63.15}, still far from overbought territory. However, the repeated failure to find support above the psychological level of 155.00 warrants caution when betting on further appreciation. The pair could climb to the 155.88 resistance level (February 3rd high), a key turning point, with an ultimate target of returning to the 156.00 level, or even 156.75 (January 23rd high). On the other hand, any further weakness could be seen as a buying opportunity, with good support likely near the 154.00 level. However, a decisive break below this level could trigger some technical selling, dragging the pair down to 153.32 (the 20-day simple moving average) and then towards the psychological level of 153.00. The latter should be considered a key turning point; a break above it could shift the bearish bias and provide good support towards the 152.00 (psychological level) - 152.16 (October 30 low) area.
Consider shorting the US dollar today around 154.75; Stop loss: 155.00; Target: 153.80; 153.60
EUR/USD
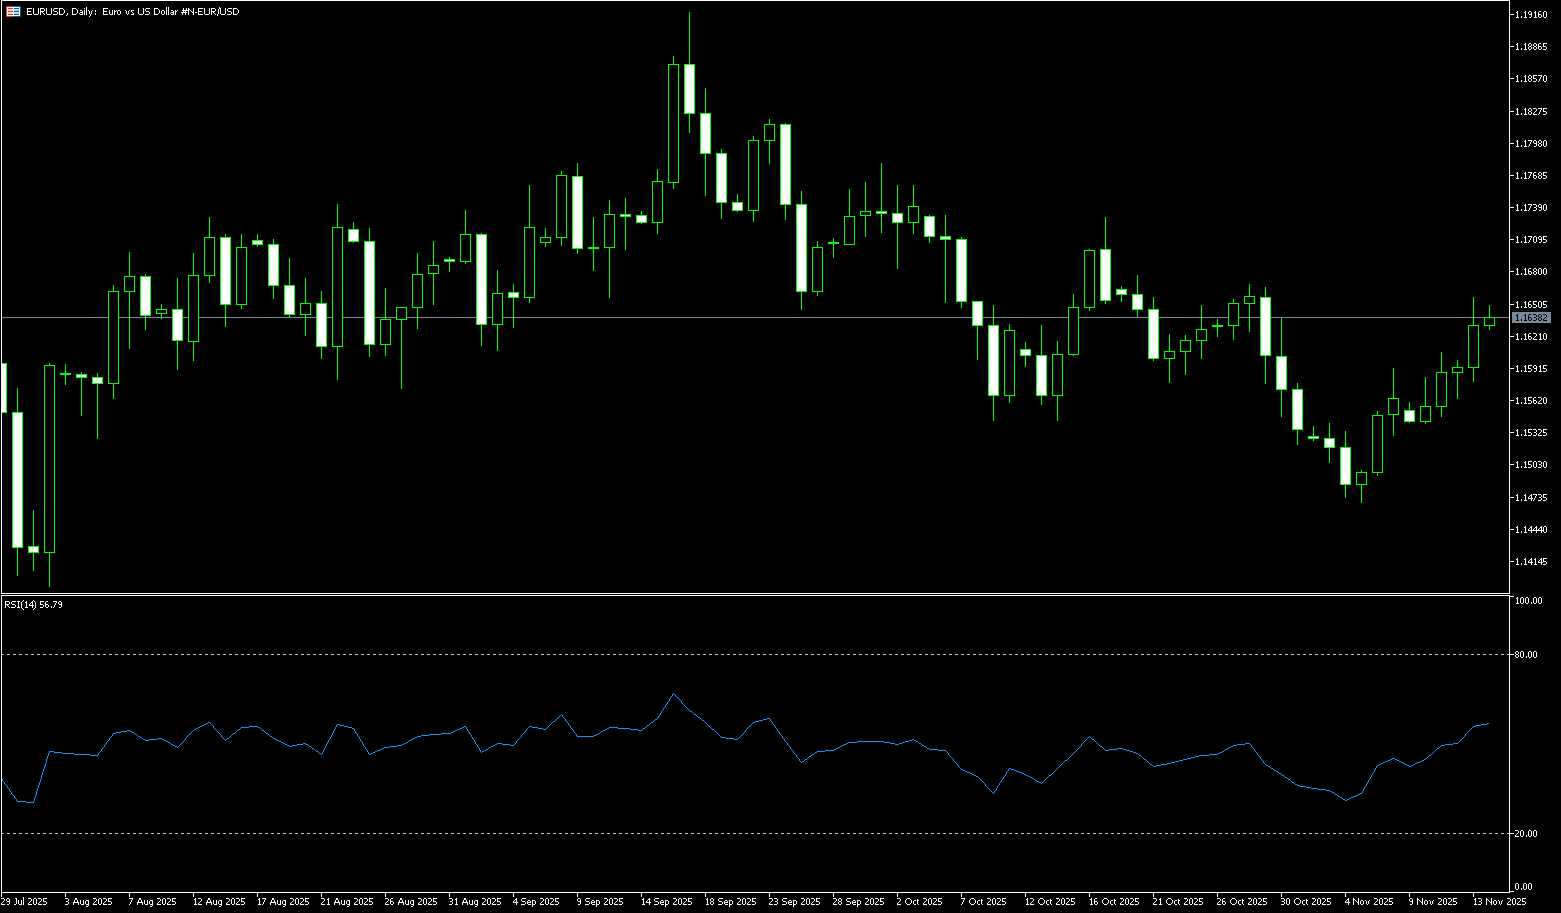
The EUR/USD extended its gains for the eighth consecutive day on Friday, climbing from a low of 1.1468 at the beginning of the month to a high of 1.1655 last week, a rise of over 1.0%. The currency pair was supported by a weaker dollar, with investors anticipating a series of weak economic data releases next week as US authorities release macroeconomic data delayed by the government shutdown. However, Federal Reserve policymakers showed reluctance to further ease monetary policy last Thursday. On the other hand, with improved risk appetite and the reopening of the US federal government, investors are awaiting further guidance on European Central Bank and Federal Reserve policies. US President Trump signed a bill Wednesday evening ending the 43-day government shutdown, allowing the release of the backlog of US economic data, although Washington warned that October employment and inflation data might not be released. Regarding monetary policy, the European Central Bank is widely expected to keep interest rates stable, with the market pricing in only a 40% probability of a rate cut in September 2026. In the US, expectations for a December Fed rate cut have fallen to around 50% due to government reopening, signs of a weak labor market, and differing opinions among Fed officials. Further comments from Fed officials will provide fundamental guidance for the dollar.
The euro/dollar pair broke through the 20-day simple moving average at 1.1584 and the psychological level of 1.1600 after hitting a three-month low of 1.1468 earlier this month, reaching a high of 1.1655 before consolidating its gains over the weekend. Technical indicators on the daily chart are positive, with the 14-day Relative Strength Index (RSI) rising for eight consecutive days from a low of 32.20 back into positive territory near 52.63. The MACD (Moving Average Convergence/Divergence) on the same timeframe appears poised to cross below its signal line. Overall, the signals suggest some consolidation is likely. Bulls should hold above 1.1600 to confirm a trend reversal and watch the highs of October 28th and 29th, near 1.1670. Further upside targets are 1.1700 (a psychological level) and the October 17th high of 1.1730. A break below this level would target 1.1778 (October 1st high). On the other hand, if EUR/USD breaks below the 1.1585-1.1600 area, it may seek support near the November 12th lows at 1.1564, followed by the 1.1530-1.1540 area (close to the lows of November 7th and 10th) and the 1.1500 (psychological level).
Today, consider going long on EUR/USD near 1.1610; Stop loss: 1.1600; Target: 1.1660; 1.1670
Disclaimer: The information contained herein (1) is proprietary to BCR and/or its content providers; (2) may not be copied or distributed; (3) is not warranted to be accurate, complete or timely; and, (4) does not constitute advice or a recommendation by BCR or its content providers in respect of the investment in financial instruments. Neither BCR or its content providers are responsible for any damages or losses arising from any use of this information. Past performance is no guarantee of future results.
更多報導


風險披露:衍生品在場外交易,採用保證金交易,意味著具有高風險水平,有可能會損失所有投資。這些產品並不適合所有投資者。在進行交易之前,請確保您充分了解風險,並仔細考慮您的財務狀況和交易經驗。如有必要,請在與BCR開設帳戶之前諮詢獨立的財務顧問。
BCR Co Pty Ltd(公司編號1975046)是一家依據英屬維京群島法律註冊成立的公司,註冊地址為英屬維京群島托爾托拉島羅德鎮Wickham’s Cay 1的Trident Chambers,並受英屬維京群島金融服務委員會監管,牌照號碼為SIBA/L/19/1122。
Open Bridge Limited(公司編號16701394)是一家依據2006年《公司法》註冊成立並在英格蘭及威爾斯註冊的公司,註冊地址為 Kemp House, 160 City Road, London, City Road, London, England, EC1V 2NX. 本公司僅作為付款處理方,並不提供任何交易或投資服務。

 English
 简体中文
简体中文
 繁體中文
繁體中文
 Bahasa
Melayu
Bahasa
Melayu
 Tiếng
Việt
Tiếng
Việt
 ไทย
ไทย
 日本語
日本語
 한국어
한국어
 ភាសាខ្មែរ
 español