


0
The US Dollar Index
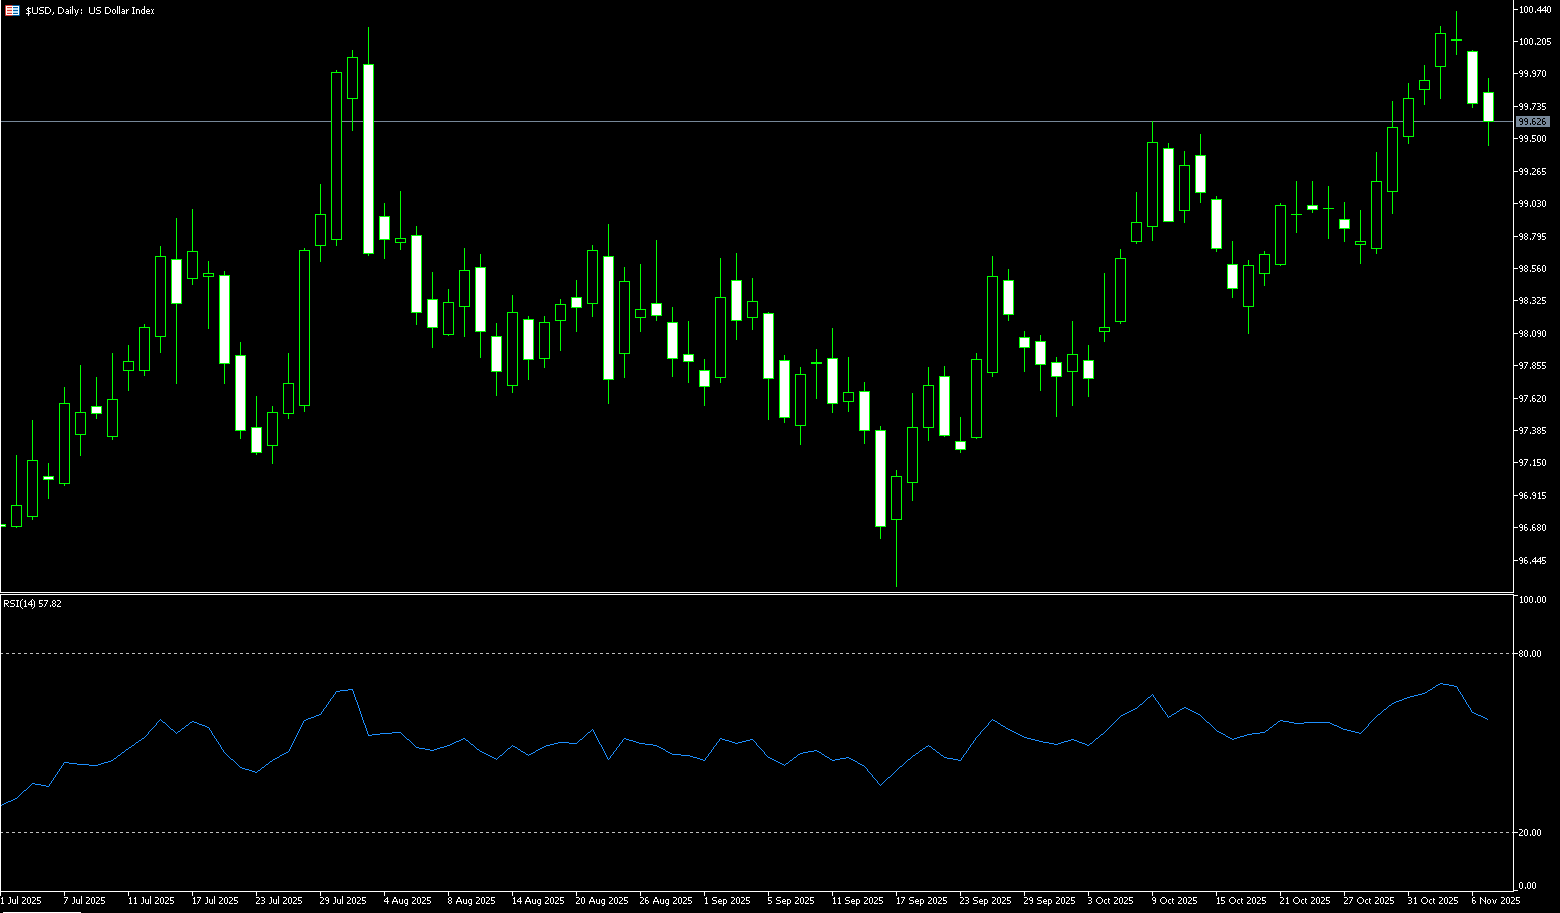
The US dollar index fell sharply below 100 in the latter half of last week as signs of a cooling US labor market fueled expectations of a December rate cut by the Federal Reserve. The weak labor market weighed on the dollar and yields, with the dollar index extending its pullback to below the 200-day moving average of 100.26 and the psychological level of 100.00 after failing to break through 100.360 earlier this week. Meanwhile, due to the prolonged government shutdown delaying the release of official employment data, traders relied on private indicators to assess the labor market. Challenger data showed that 153,000 jobs were announced in October, the highest for that month in 22 years, primarily related to AI integration and cost optimization. The market increased its bets on a December rate cut, pricing in a 70% probability of a 25 basis point cut, up from 62% the previous day. At the same time, Chicago Fed President Austan Goolsby stated that the lack of official inflation data necessitates caution regarding further easing. The dollar also faced additional pressure from currency cross-currency volatility. The euro rose, while the pound climbed to $1.3088 after the Bank of England kept interest rates unchanged. Although the Bank of England's decision was widely anticipated, it helped maintain the interest rate differential with the dollar, exacerbating selling pressure on the dollar index basket. The dollar's depreciation against the yen was most pronounced as investors sought the safe-haven currency.
The daily chart of the dollar index shows that the confirmed reversal below the 200-day moving average at 100.26 has decisively changed market sentiment towards the dollar in the short term. If the current selling pressure persists, the dollar index may test the support level of 99.37 (the 14-day simple moving average), the last line of defense before the psychological level of 99.00. Downside risks remain high due to weak labor data, declining yields, and stronger currency crosses; a break below 99.00 would test the support area of 98.40 (the 50-day simple moving average) and 98.42 (the 38.2% Fibonacci retracement level of the 101.98-96.22 range). This will be unless new data or comments from the Federal Reserve change expectations. The 14-day Relative Strength Index (RSI) is around 57.70, which is in the neutral to strong zone and does not show signs of overheating. Therefore, if the US dollar index shows a new wave of upward movement, the first target can be the psychological level of 100.00. The next resistance levels are the 200-day simple moving average at 100.26 and 100.36 (the high of November 5th). The short-term target is 100.62 (the 76.4% Fibonacci retracement level).
Consider shorting the US Dollar Index today at 99.68, with a stop-loss at 99.80 and targets at 99.25 and 99.10.
WTI Crude Oil
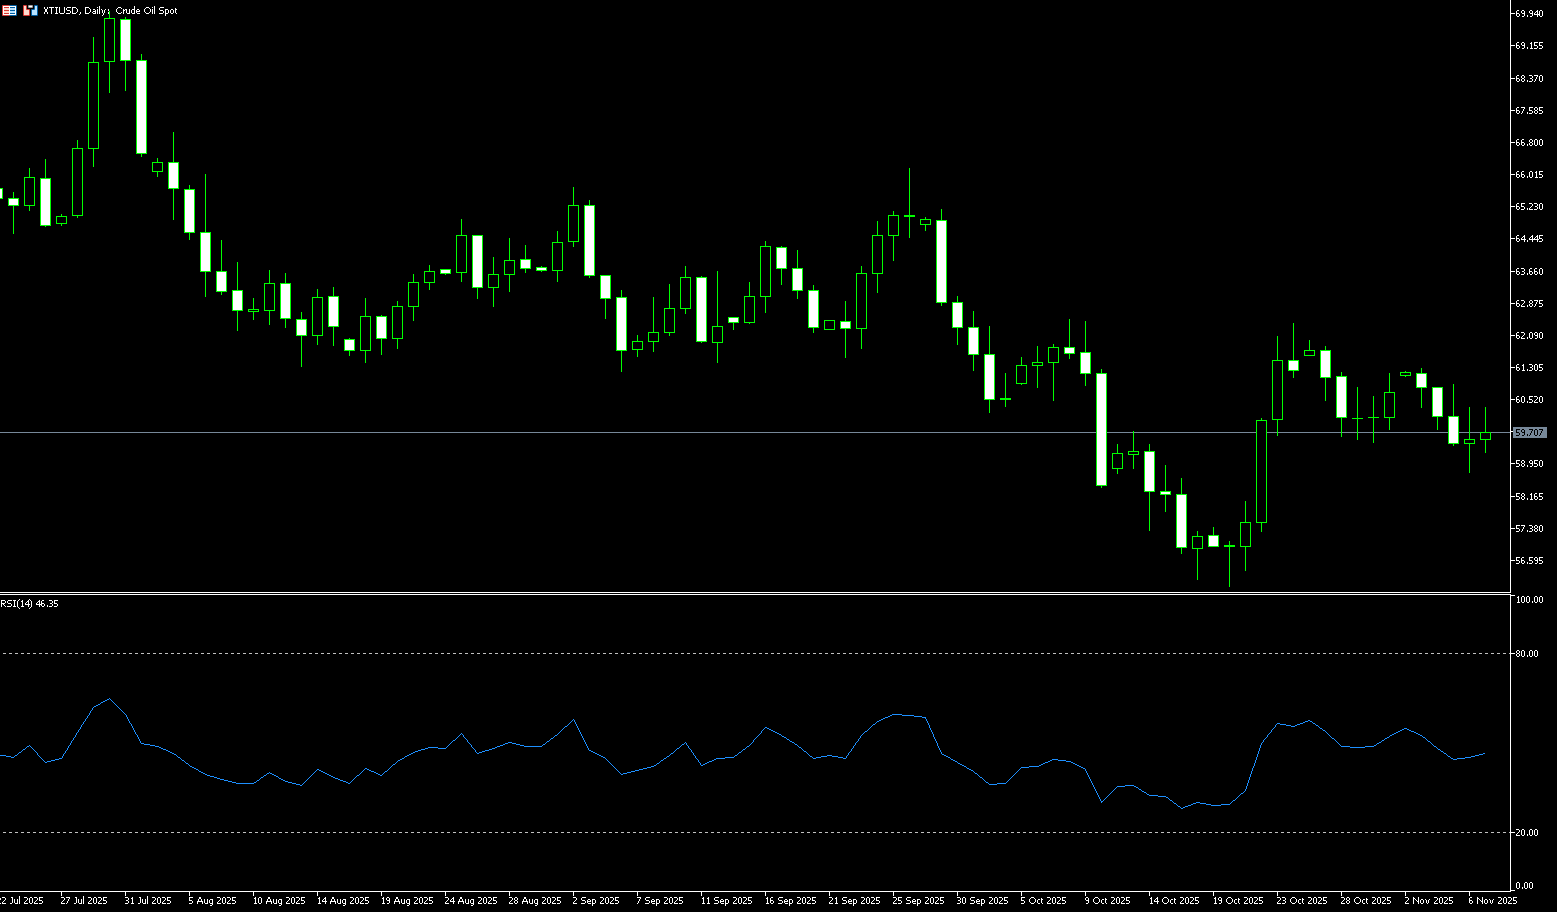
WTI crude oil, the benchmark for US crude, traded at the lower end of the $61.30 to $58.75 range last week. Potential upside potential may be limited due to a stronger dollar and heightened concerns about oversupply. Increased concerns among traders about a market glut are putting pressure on WTI prices. WTI crude oil fell 1.64% for the week to $59.70. Data released by the U.S. Energy Information Administration (EIA) on Wednesday showed that U.S. crude oil inventories increased by 5.202 million barrels in the week ending October 31, compared with a decrease of 6.858 million barrels the previous week. Despite this, WTI prices were supported by recent reports that the U.S. military may be about to launch a military strike against Venezuela, the world's 12th largest oil producer. Furthermore, reduced Russian crude oil exports may also boost WTI. According to two industry sources and LSEG Shipping... According to tracking data, the Russian Black Sea port of Tuapse has suspended fuel exports, while its refineries halted crude oil processing after a Ukrainian drone attack on its infrastructure on Sunday.
From a daily chart perspective, WTI crude oil has fallen for several days from its high of $61.30 at the beginning of last week, reaching a near two-week low of $58.75 before rebounding slightly to near the psychologically important resistance level of $60.00. Structurally, oil prices have broken below the short-term moving average combination of the 9-day (60.08) and 14-day (60.13) simple moving averages. Furthermore, a bearish "death cross" pattern has formed. The MACD indicator shows the death cross continuing to expand its momentum, indicating that the bears are in control. The 14-day RSI is currently operating in the weak zone (around 46.00) and has not yet shown a clear divergence signal, indicating that the bulls have not yet formed an effective counterattack. From a technical perspective, if oil prices continue to fall below $58.75 (last week's low), the downside could open up to the $58 psychological level and even the $56.35 low of October 21st. Only when the price returns to the psychological level of $60.00 and above $61.30 (last week's high) will the bulls have a chance to reverse the downtrend to $62.93 (89-day simple moving average).
Today, consider going long on crude oil at $59.55, with a stop loss at $59.40 and a target of $60.80. 61.20
Spot Gold
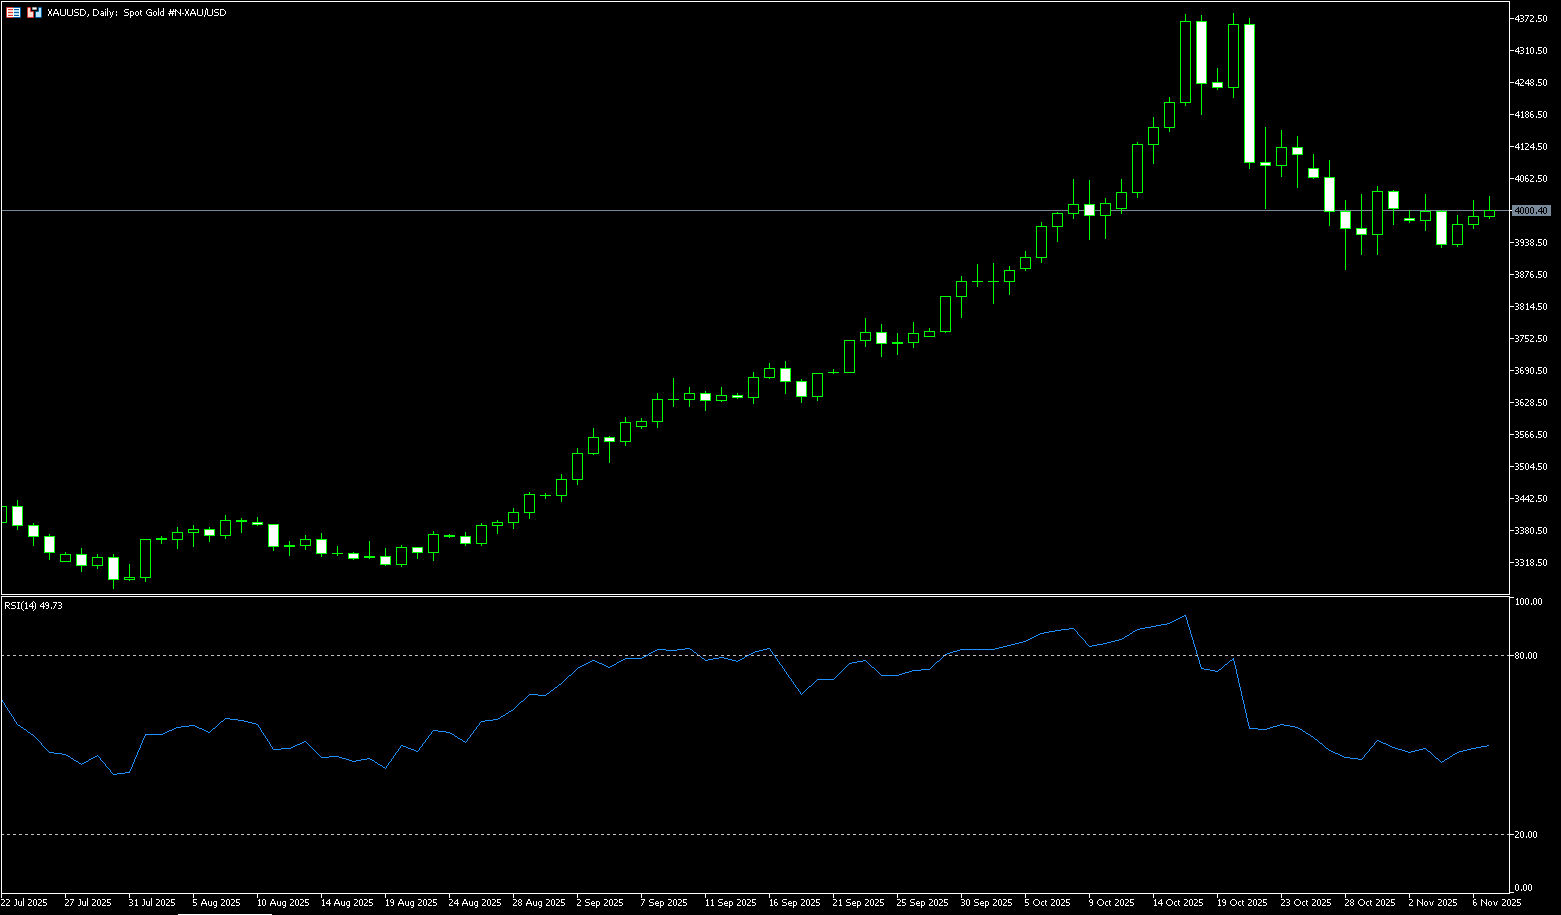
Gold prices fluctuated around $4,000 per ounce last week amid a tug-of-war between bulls and bears. Essentially, gold prices consolidated within a range of $2.930 to $4.030. Gold prices rose slightly due to a weaker dollar before the weekend and a resurgence in safe-haven demand. On the other hand, concerns about the prolonged US government shutdown and doubts about the legality of tariffs may drive safe-haven inflows, supporting gold prices. Furthermore, the Challenger report showed that companies cut more than 150,000 jobs in October, the largest monthly reduction in more than 20 years. This announcement prompted the Federal Reserve to lower interest rates at its December meeting, pushing gold prices higher. Lower interest rates may reduce the opportunity cost of holding gold, thus supporting this non-yielding precious metal. Despite the initial dominance of safe-haven demand, gold prices repeatedly fell back, revealing the "cascading effect" of the sharp decline in US stocks. The three major US stock markets... The market correction in US stocks led to a surge in demand for cash holdings, and while gold enjoys its safe-haven appeal, it couldn't escape the downturn and was ultimately forced to "collapse" along with it. This phenomenon reminds investors that gold is not an isolated entity; its price movements are often driven by equity market sentiment, and short-term corrections are inevitable during periods of peak uncertainty. Therefore, the "buy the dip" mentality for gold still exists. However, with the government shutdown continuing and economic data scarce, this "buy the dip" mentality is showing signs of fatigue.
After reaching a new historical high of $4,381 last month, gold prices have been undergoing a technical correction to a low of $3,886. However, its decline has consistently been capped above the 40-day simple moving average since August 25th (latest price: $3.951.50). This suggests a bullish outlook for gold. However, the neutral oscillator on the daily/4-hour charts and gold's failure to find stable support above $4000 warrant caution before further gains. Therefore, any subsequent upward movement may face some resistance in the $4046.20 (nearly two-week high) – $4050.00 area. A successful break above this level would pave the way for a break above the $4154.70 (October 23rd high) resistance and allow gold to reclaim $4200. The psychological level of $3,951.50 and $3,950.00, representing the 40-day simple moving average, appear to be protecting the short-term downside before the weekly low, which is around $3,929-$3,928. If some follow-through selling occurs, gold could fall further below $3,900 and retest the October monthly low around $3,886. A break above the latter would target the psychological level of $3,800, which would be seen as a new trigger for bearish traders and lay the foundation for a recovery from the recent corrective decline from all-time highs.
Consider going long on gold today at $4,000, with a stop loss at $3,995 and targets at $4,030 and $4,040.
AUD/USD
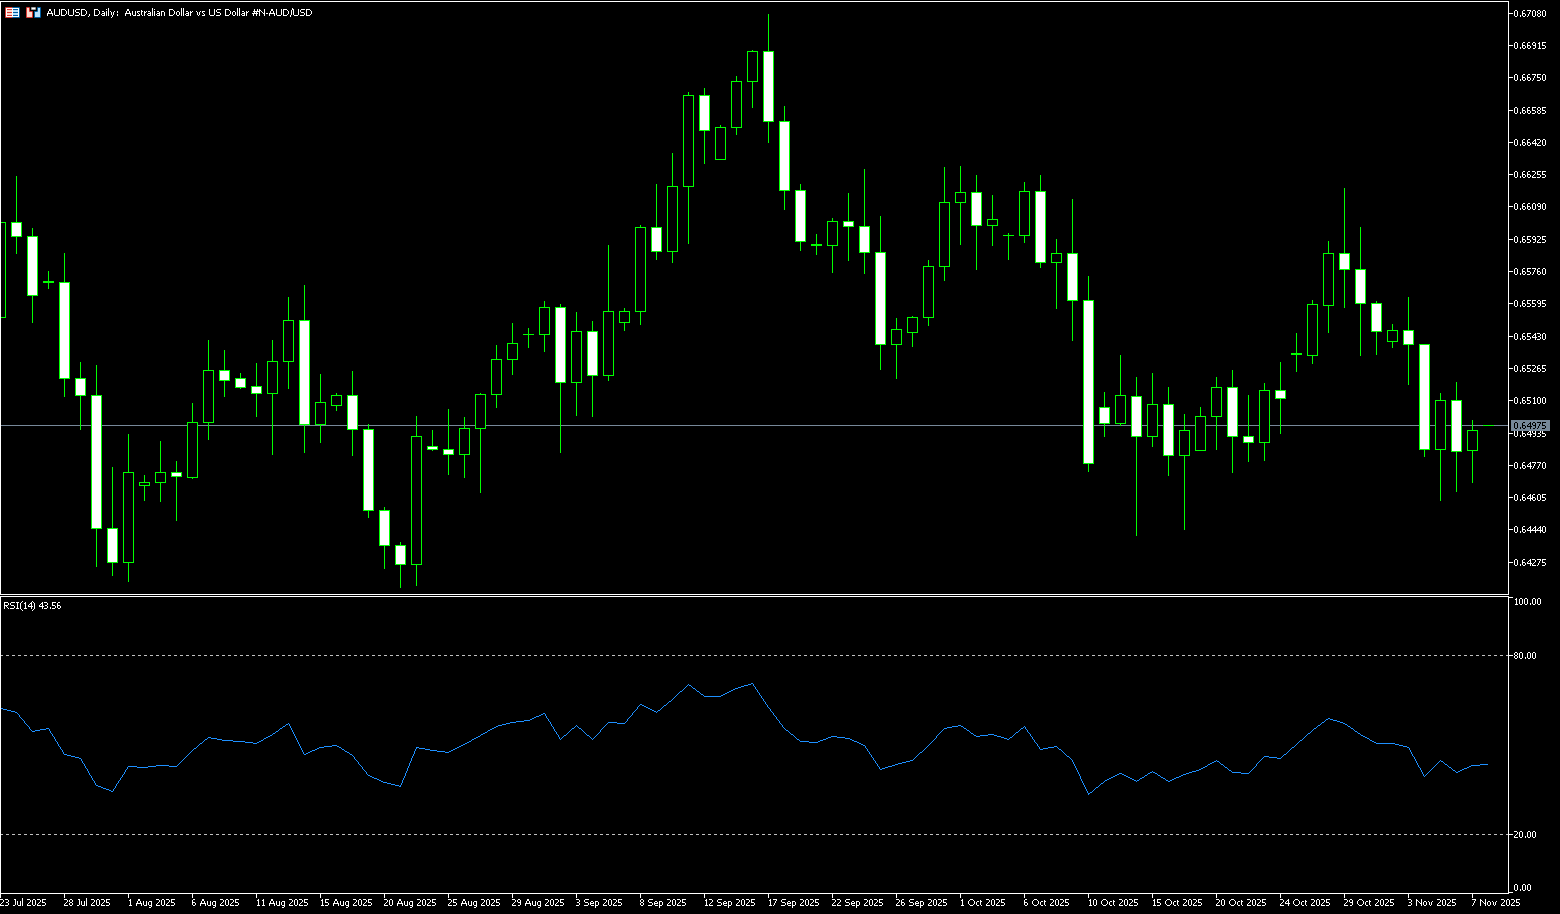
The Australian dollar repeatedly declined against the US dollar last week, falling from a high of 0.6562 to a near four-week low of 0.6458. The Australian dollar fell more than 1.0% in October as China's trade surplus narrowed to 640.4 billion yuan, down from 645.47 billion yuan in September. China's exports fell 0.8% year-on-year in October, compared with 8.4% in September. Meanwhile, imports rose 1.4% year-on-year during the reporting period, compared with 7.5% previously. In dollar terms, China's October trade surplus expansion was less than expected. The trade balance was +90.07 billion US dollars, compared with expectations of +95.6 billion US dollars and +90.45 billion US dollars in September. Washington's decision to suspend penalties against China's shipbuilding industry eased tensions between the world's two largest shipbuilding industries. The Australian dollar may receive support amid trade tensions between economies. The Office of the U.S. Trade Representative announced it is seeking public comment on a one-year suspension of tariffs on Chinese imports. China's Ministry of Finance announced on Wednesday that it will remove some tariffs on U.S. agricultural products starting November 10. The ministry also stated that the 24% tariff on certain U.S. goods will be suspended for one year, while the 10% tariff will remain in place. Any changes in the Chinese economy could impact the Australian dollar, as China is a significant trading partner.
The Australian dollar repeatedly declined against the U.S. dollar last week, falling from a high of 0.6562 to a near four-week low of 0.6458. The AUD/USD pair extended its losses by over 1.0%. Currently, it is trading slightly below 0.6500. Technical analysis on the daily chart shows the 14-day Relative Strength Index (RSI) has fallen to near the negative 44 level, indicating further downside potential. Currently, the pair is consolidating within a sideways channel pattern, with highs of 0.6615 and lows of 0.6440, and a midline at 0.6530. It remains below the 9-day simple moving average at 0.6527 and the midline of the sideways channel at 0.6530, suggesting weak short-term momentum. AUD/USD may test the lower boundary of the sideways channel, around 0.6440, and the 200-day simple moving average at 0.6449. This was followed by a five-month low of 0.6414 recorded on August 21st. Further support lies at the six-month low of 0.6372. On the upside, initial resistance is at the 9-day simple moving average of 0.6527 and 0.6530 (the midline of the horizontal channel), followed by the 50-day simple moving average at 0.6560. A break above these levels would improve short- and medium-term price momentum and support AUD/USD exploring the psychological level of 0.6600 near the upper boundary of the rectangle.
Consider going long AUD today at 0.6488, stop loss: 0.6475, target: 0.6540, 0.6550
GBP/USD
Last week, The Bank of England narrowly voted to keep interest rates unchanged, maintaining a cautious stance ahead of the government's autumn budget in November. The vote was closer than expected, with markets anticipating a 6-3 majority to hold rates steady. Bank of England Governor Bailey stated that economists generally predicted a rate cut before Christmas. Market consensus suggests policymakers may cut rates as early as December and further over the next year to address cooling inflation expectations. The all-age unemployment rate remained stable at 3.8% for the third consecutive month in September, while labor market data showed weakness. Meanwhile, the pound/dollar exchange rate faced challenges as the dollar rebounded after losses in the previous session. The US government shutdown limited the release of official data such as non-farm payrolls and the unemployment rate. The Challenger job cuts report prompted the Federal Reserve to lower interest rates at its December meeting. The US dollar faces challenges. According to the CME FedWatch Tool, federal funds futures traders now expect a 67% probability of a December rate cut, down from 62% the previous day.
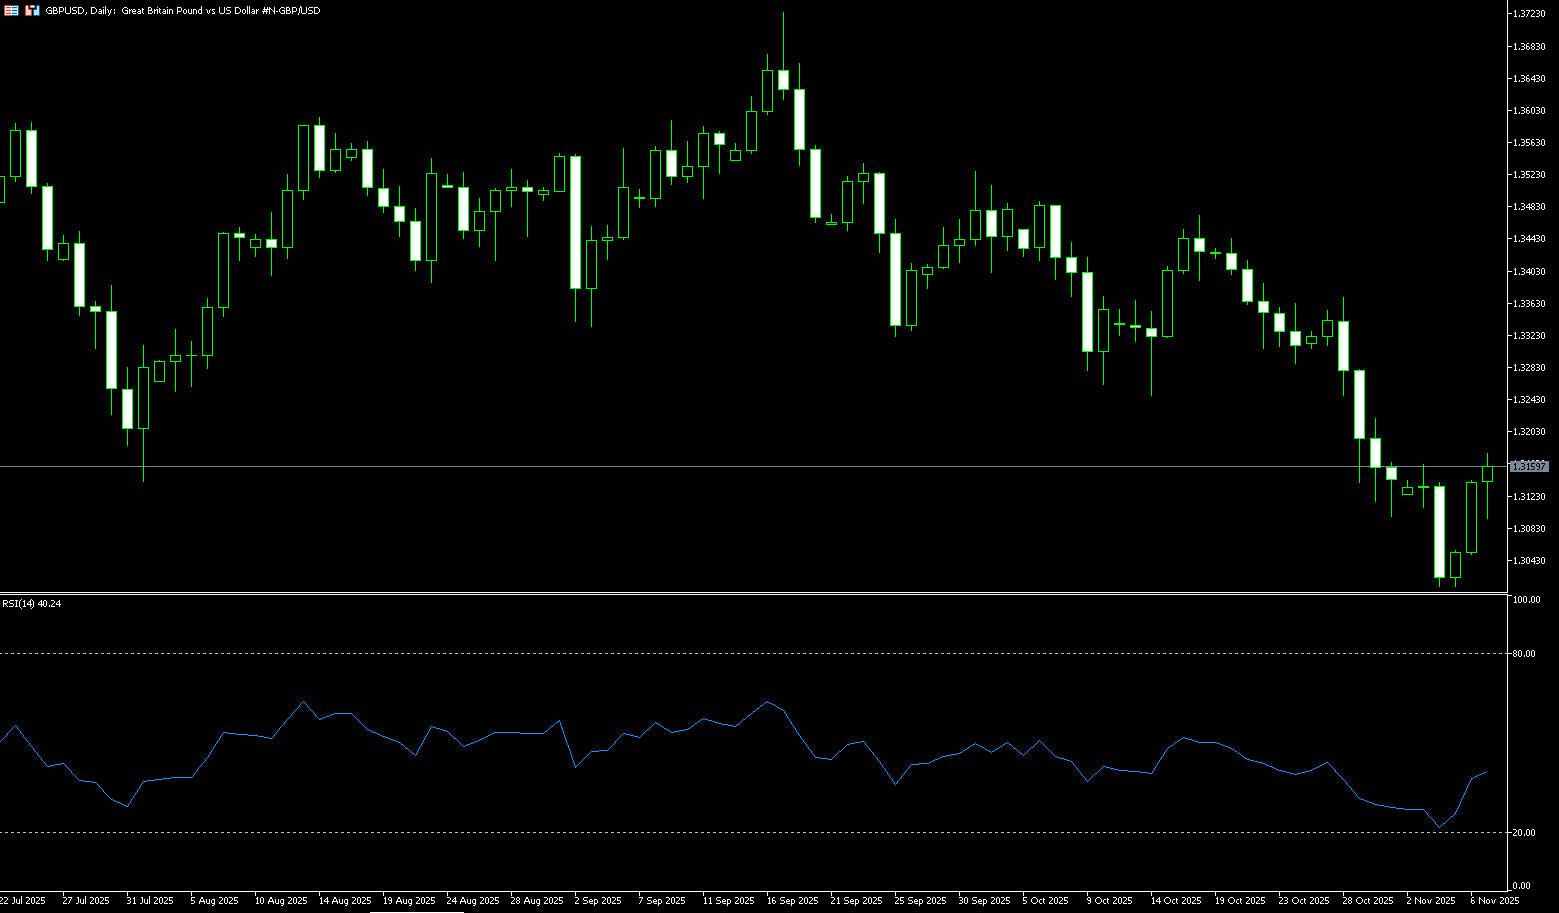
The daily chart shows that the GBP/USD exchange rate has fallen sharply over the past few months, from a high of 1.3726 in September to a low of 1.3010 last week. The exchange rate briefly broke below the important support level of 1.3140, which is both the low of August 1st and the neckline of a double top pattern at 1.3724. The double top pattern is one of the most typical bearish patterns in technical analysis. GBP/USD briefly broke below 1.3120 (the 61.8% Fibonacci retracement level of the 1.2708 to 1.3788 move), while the 14-day moving average (1.3212) crossed below the 200-day simple moving average (1.3264), forming a bearish "death cross" pattern. Therefore, the most likely scenario for GBP/USD is a bearish move, with the next key target being 1.3010 (last week's low). And 1.3000 {a psychological level}. Then there's 1.2962 {76.4% Fibonacci retracement level}, a break above which would target 1.2900 {the low of April 2nd}. Another possibility is a rebound in the exchange rate and a retest of the psychological level of 1.3200, as well as the key resistance area of 1.3209 (the 14-day simple moving average). The next level targets 1.3264 (the 200-day simple moving average).
Consider going long on GBP today at 1.3150, with a stop loss at 1.3140 and targets at 1.3200 and 1.3210.
USD/JPY
After two weeks of gains, USD/JPY saw a slight pullback last week, rebounding to a near 10-month high of 154.49. Signs of cooling private consumption in Japan, coupled with the stimulus stance of new Prime Minister Sanae Takaichi, may have made the Bank of Japan resist tightening policy. This is seen as a key factor weakening the yen, although a combination of factors could help limit deeper losses. The minutes of the Bank of Japan's September policy meeting, released on Wednesday, continued to fuel hopes for an imminent rate hike. Furthermore, market speculation that Japanese authorities might intervene to curb further depreciation of the currency could deter yen shorts from making aggressive bets. Meanwhile, the dollar may struggle to attract buyers due to concerns about a prolonged US government shutdown and bets on further Federal Reserve rate cuts. This, in turn, could help limit the pair's gains. On the other hand, rising concerns about overvalued artificial intelligence have triggered a wave of risk aversion, boosting demand for the safe-haven currency. The yen was also supported by a weaker dollar, as signs of a cooling US labor market reinforced expectations of a near-term Fed rate cut.
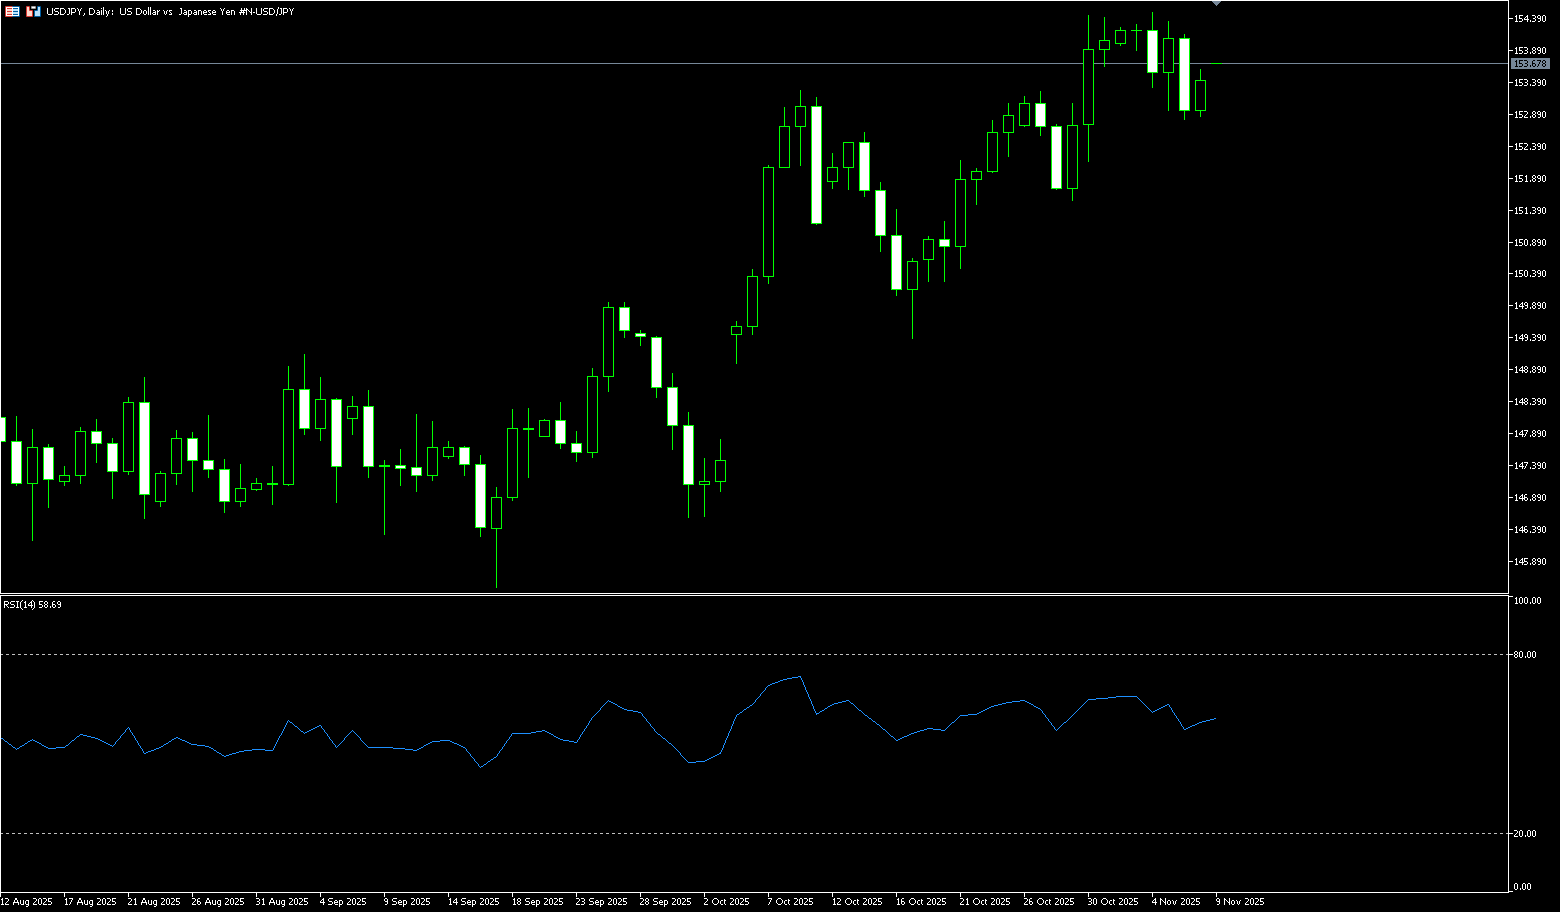
The daily chart shows that USD/JPY retreated to around 152.80 after testing a ten-month high of 154.49 last week. The pair's repeated failed rallies and the overnight break below the 153.30-153.25 resistance level, which had turned into support, support the view that USD/JPY will depreciate further. However, the 14-day Relative Strength Index (RSI) on the daily chart is near 59, suggesting that any further declines are more likely to find good support in the 152.46 (21-day simple moving average) - 152.16 (October 30 low) area. A break below the psychological level of 152.00 would be seen as a new trigger for bearish traders and paves the way for a continuation of the pullback from the highest level since February reached earlier this week, down to the 151.30 (34-day simple moving average) level. On the other hand, a rise to the psychological level of 154.00 could encounter resistance at 154.49 (last week's high). If USD/JPY continues its strong breakout above the latter level, it will reclaim the 155.00 level and climb further to retest the 155.88 resistance zone (February 3rd high). The latter should now be considered a key turning point.
Consider shorting USD at 153.66 today. Stop loss: 153.88. Target: 152.60, 152.40
EUR/USD
During the latter part of last week's trading session, EUR/USD rebounded from a near three-month low of 1.1468 at the beginning of the week to around 1.1591. Major currency pairs showed strength due to renewed concerns about the US labor market, while the dollar faced selling pressure. The Challenger report showed that employers laid off 153,074 people in October. This figure is 183% higher than September's and 175% higher than the same month last year. The report also indicated that the workforce reduction was mainly due to the increasing prevalence of artificial intelligence (AI) and employer cost-cutting. Signs of cooling job demand slightly weighed on market expectations, supporting the Federal Reserve's decision to keep interest rates unchanged at its final meeting in December. Meanwhile, the euro traded relatively quietly against its peers, as comments from several European Central Bank officials suggested no urgency for monetary policy adjustments. ECB Vice President Louis de Guindos stated at a webinar last Thursday that he was satisfied with the "current interest rate level" and optimistic about service sector inflation and growth.
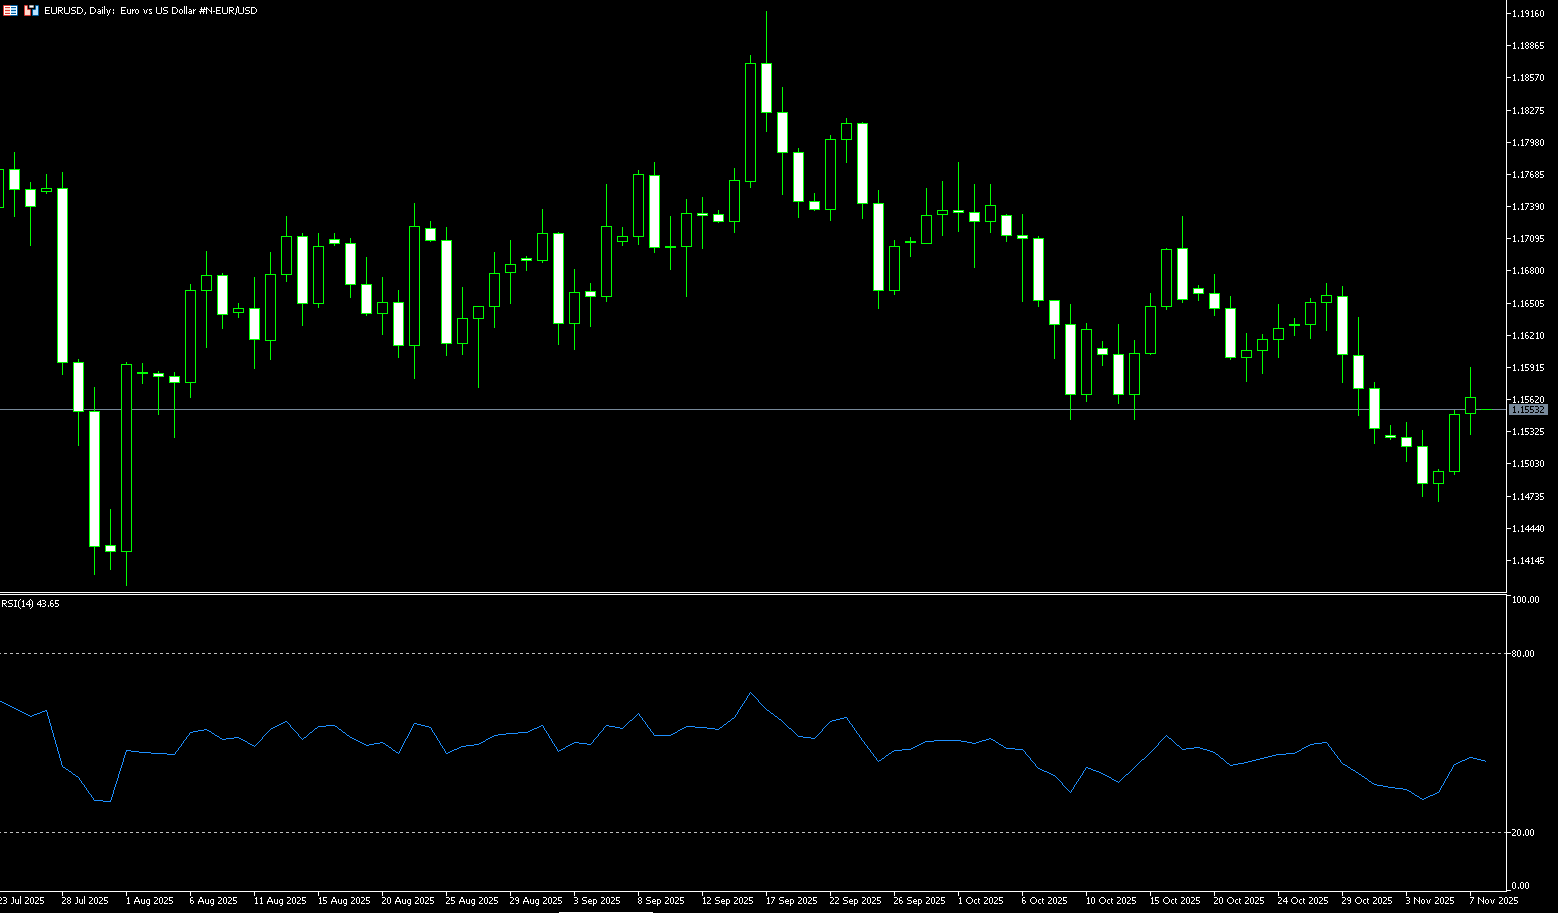
Looking at last week's movements, EUR/USD currently appears to be in a consolidation phase, awaiting a sufficiently strong catalyst to shake it out of its range: a sudden shift in the Fed's stance, a change in global risk appetite, or new demand for eurozone assets could all help, but until then, price action by the dollar should continue to dominate the narrative. So far, the pair appears to have found some fairly good support around 1.1468 (a near three-month low), the lowest level since August. If bears regain control, the November support level of 1.1468 (November 5th) should provide initial support, followed by 1.1417 (185-day simple moving average) and 1.1400 (psychological level). A break below this level would target the August low of 1.1391 (August 1st). On the opposite side, last week's high of 1.1591 and the 20-day simple moving average in the 1.1593 area act as temporary resistance before the weekly high of 1.1666 (October 28th) and 1.1700 (psychological level). Further up is the 1.1728 level (October 17th).
Consider going long on the Euro today at 1.1550, with a stop-loss at 1.1540 and targets at 1.1600 and 1.1610.
Disclaimer: The information contained herein (1) is proprietary to BCR and/or its content providers; (2) may not be copied or distributed; (3) is not warranted to be accurate, complete or timely; and, (4) does not constitute advice or a recommendation by BCR or its content providers in respect of the investment in financial instruments. Neither BCR or its content providers are responsible for any damages or losses arising from any use of this information. Past performance is no guarantee of future results.
Lebih Liputan


Pendedahan Risiko:Instrumen derivatif diniagakan di luar bursa dengan margin, yang bermakna ia membawa tahap risiko yang tinggi dan terdapat kemungkinan anda boleh kehilangan seluruh pelaburan anda. Produk-produk ini tidak sesuai untuk semua pelabur. Pastikan anda memahami sepenuhnya risiko dan pertimbangkan dengan teliti keadaan kewangan dan pengalaman dagangan anda sebelum berdagang. Cari nasihat kewangan bebas jika perlu sebelum membuka akaun dengan BCR.
BCR Co Pty Ltd (No. Syarikat 1975046) ialah syarikat yang diperbadankan di bawah undang-undang British Virgin Islands, dengan pejabat berdaftar di Trident Chambers, Wickham’s Cay 1, Road Town, Tortola, British Virgin Islands, dan dilesenkan serta dikawal selia oleh Suruhanjaya Perkhidmatan Kewangan British Virgin Islands di bawah Lesen No. SIBA/L/19/1122.
Open Bridge Limited (No. Syarikat 16701394) ialah syarikat yang diperbadankan di bawah Akta Syarikat 2006 dan berdaftar di England dan Wales, dengan alamat berdaftar di Kemp House, 160 City Road, London, City Road, London, England, EC1V 2NX. Entiti ini bertindak semata-mata sebagai pemproses pembayaran dan tidak menyediakan sebarang perkhidmatan perdagangan atau pelaburan.

 English
 简体中文
简体中文
 繁體中文
繁體中文
 Bahasa
Melayu
Bahasa
Melayu
 Tiếng
Việt
Tiếng
Việt
 ไทย
ไทย
 日本語
日本語
 한국어
한국어
 ភាសាខ្មែរ
 español