


0
The US Dollar Index
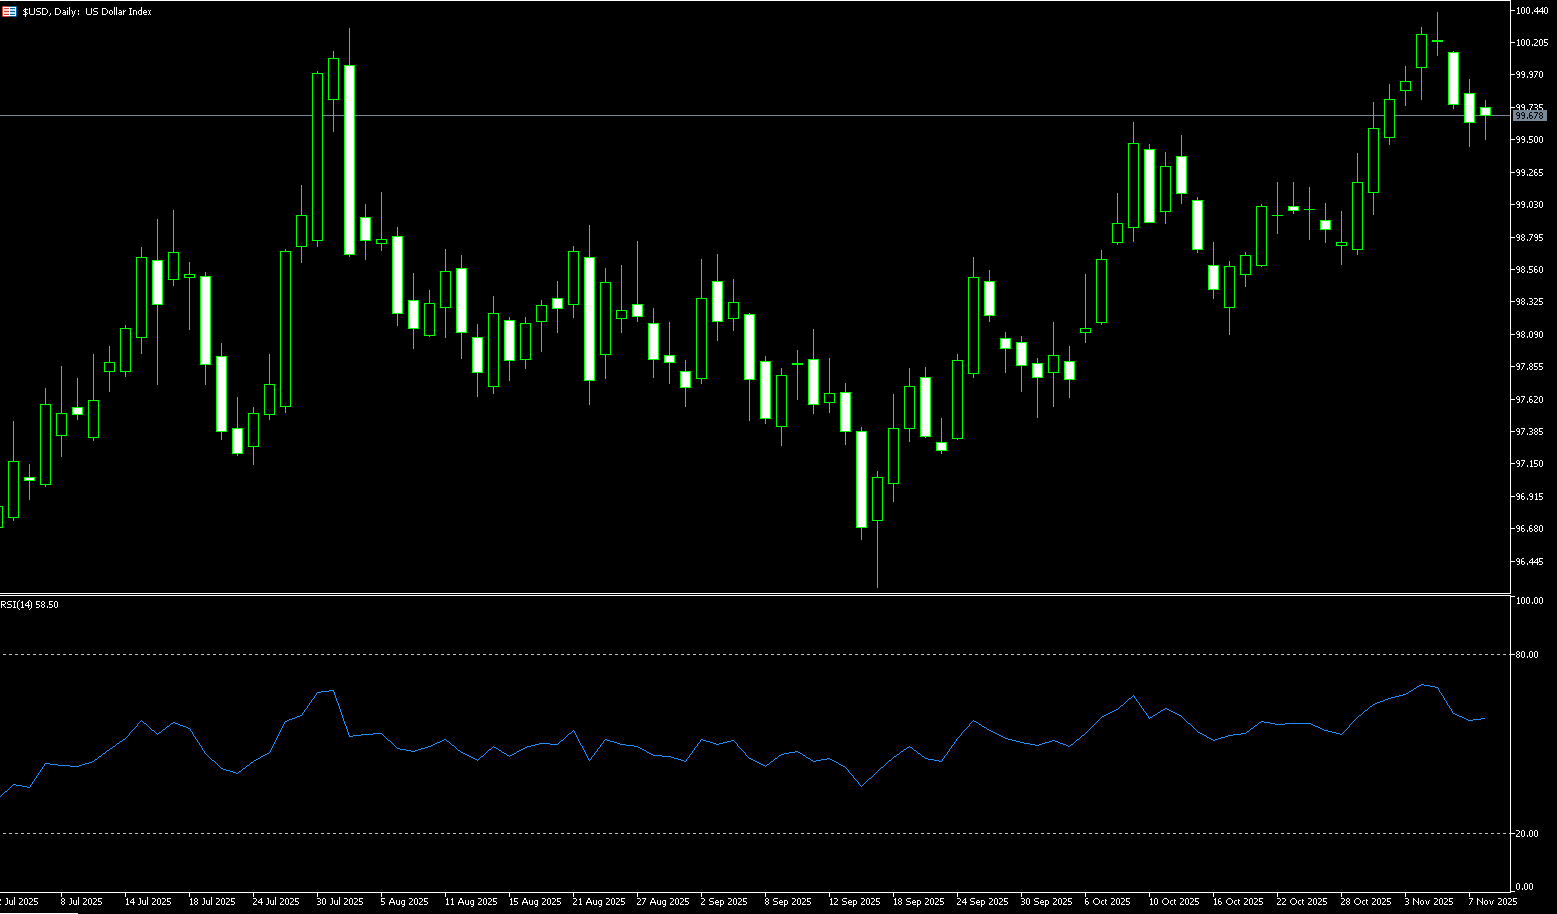
Despite a strong start to last week, the dollar's upward momentum gradually faded in the latter half of the week, resulting in a mild downward trend on the weekly chart. In fact, the dollar index failed to maintain its May levels above the psychological threshold of 100, an area that also coincides with its key 200-day simple moving average. This week's core themes in the currency market were the US data vacuum and the uncertainty surrounding the Federal Reserve. The government shutdown delayed the non-farm payroll report, and the double blow of private sector layoffs and a collapse in Chinese exports completely diminished the dollar's safe-haven appeal. There is a 60% chance the shutdown will end between November 11-21, with a 15% possibility of it dragging on into December. Furthermore, the repricing of the Federal Reserve's expectations for further rate cuts in the coming months remains a key focus, as market participants are still assessing Fed Chairman Powell's hawkish remarks at the latest FOMC meeting. In the US bond market, US Treasury yields generally trended downward across all maturities. A short-term technical rebound in the dollar is possible, but the consensus of net short positions and expectations of rate cuts will dominate, making a weak trend unlikely to change in the coming months.
Since hitting a yearly low of 96.22 in mid-September, the US dollar index has risen by more than 3%. Momentum indicators continue to lean bullish: the 14-day Relative Strength Index (RSI) has fallen to around 56, suggesting further gains are still expected, while the Average Directional Index (ADX) above 23 indicates a strengthening trend. However, a more sustainable rally would require the dollar index to break through the psychological level of 100.00 and the key 200-day simple moving average at 100.21 in a compelling manner. If the dollar index also breaks through the November 5 high of 100.36, it could head towards the weekly high of 100.54 on May 29, followed by the psychological level of 101.00. Conversely, temporary support lies at the 50-day simple moving average at 99.21, with the next support level at the psychological level of 99.00. A deeper pullback could test the 34-day simple moving average at 98.85, followed by the October 28 low of 98.57.
Consider shorting the US Dollar Index today at 99.67, with a stop-loss at 99.78 and targets at 99.20 and 99.10.
WTI Crude Oil
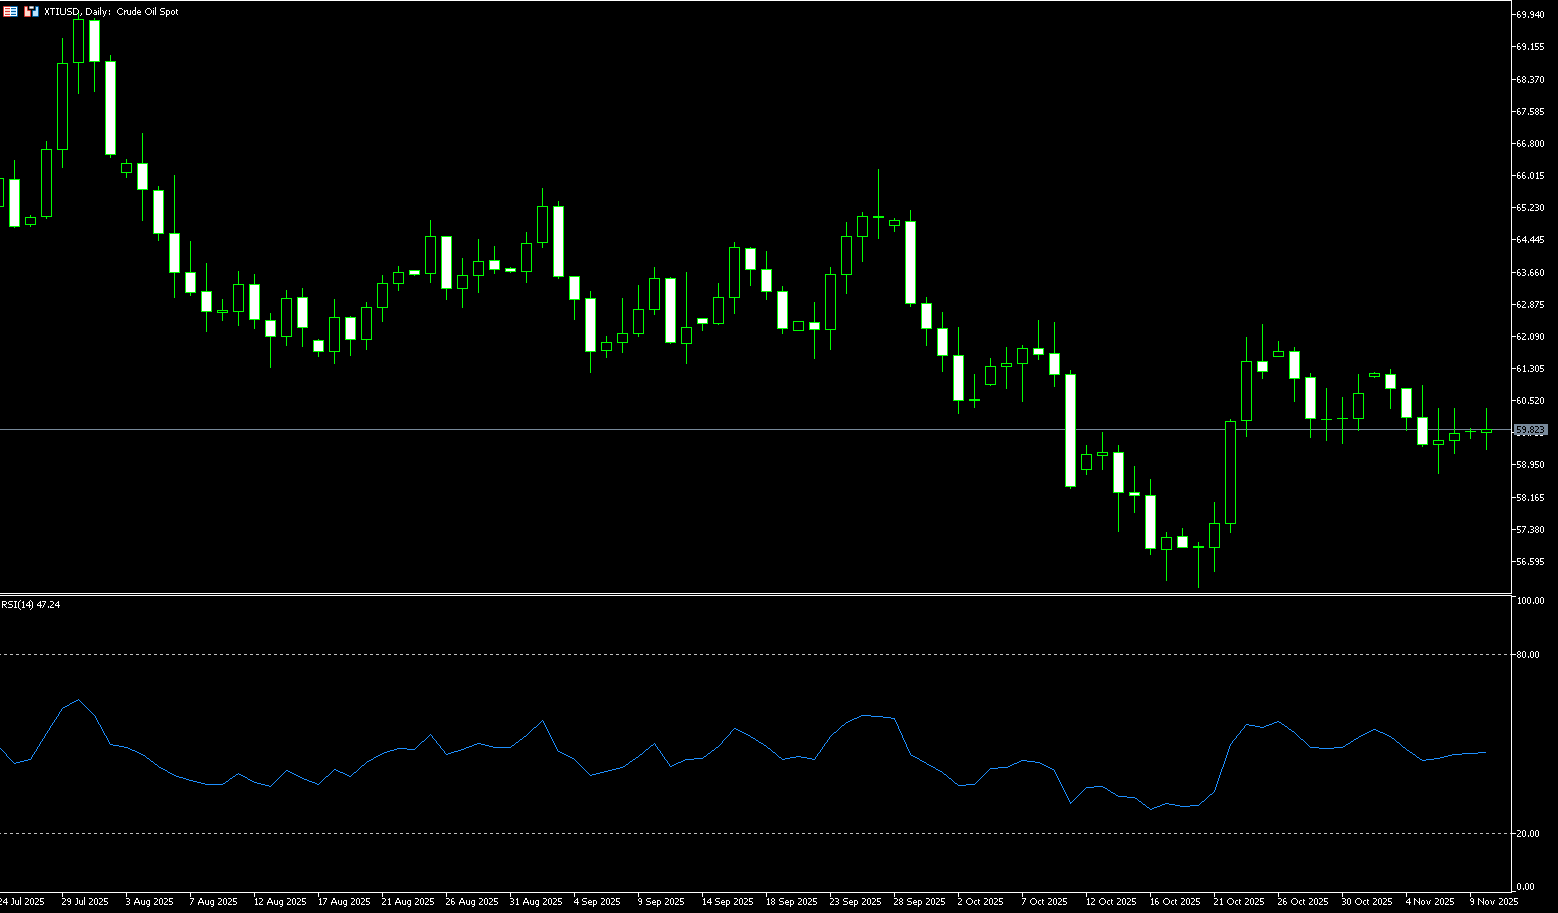
US crude oil started the week trading slightly below $60.00 per barrel. Prices rose slightly on Friday as the market focused on the meeting between US President Trump and Hungarian Prime Minister Orbán, while tensions in Gaza could escalate again. Meanwhile, the US government is in its longest shutdown in history, significantly impacting economic activity. Due to a shortage of air traffic controllers, the government has asked several major airports to reduce flights, and multiple private employment reports also showed signs of a slowdown in the US labor market in October. Demand concerns further pressured oil prices. OPEC+ slightly increased production, while Saudi Arabia proactively lowered its prices. The Organization of the Petroleum Exporting Countries (OPEC+) confirmed this week that it will slightly increase production in December, but due to concerns about further increases in market supply, the organization has suspended planned production increases for the first quarter of next year. Simultaneously, Saudi Arabia, the world's largest crude oil exporter, lowered its official selling prices for crude oil to Asian customers in December, indicating ample supply and increased uncertainty on the demand side.
From a supply and demand perspective, the current oil market has entered a typical phase of ample supply, weakening demand, and rising macroeconomic uncertainty. The combined effects of surging inventories, production increase plans, and a stronger dollar make a short-term trend reversal in oil prices unlikely. Only when inventories decline or demand shows a clear improvement can oil prices break free from the downward trend. Technically, the daily chart for US crude oil remains within a downtrend line, and the moving averages maintain a bearish trend. However, the MACD indicator shows a potential rebound after continuous adjustments, making a significant short-term decline unlikely. The daily moving average resistance at 61.30 (last week's high) serves as a short-term dividing line between bullish and bearish sentiment. If the rebound breaks through this level, it could strengthen further to $62.38 (the high of October 24th). Conversely, it will likely remain range-bound, with support levels at $59.00-$0.48 (the 20-day simple moving average) and the psychological level of $59.00. A break below these levels would open up downside potential to the $58 psychological level. In the short term, continued attention should be paid to inventory data changes, awaiting a directional move.
Today, consider going long on crude oil at 59.70. Stop loss: 59.50, Target: 61.00, 61.20
Spot Gold
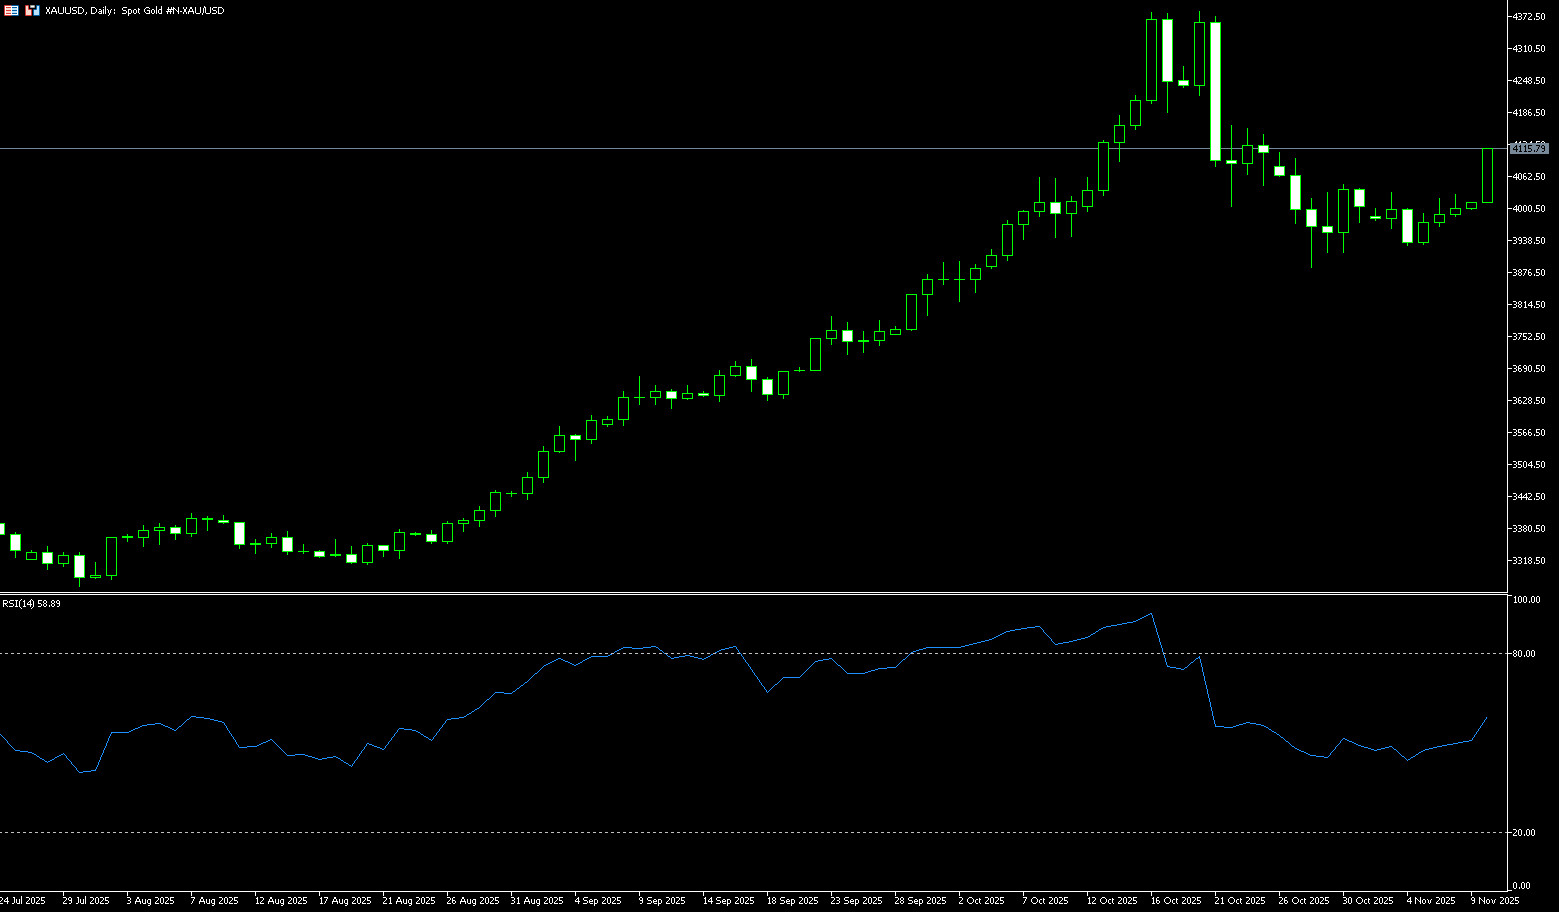
On November 10th, spot gold traded around $4,100 per ounce, up over 2.45%. Gold prices rose last Friday, primarily supported by a weaker dollar and safe-haven demand stemming from uncertainty surrounding the US government shutdown. Market expectations for the Federal Reserve's monetary policy also shifted. The unexpected weakness of the US dollar index was the primary driver of this rebound in spot gold. Last Friday, the dollar fell to a near one-week low, making dollar-denominated gold cheaper for investors and attracting a large influx of overseas buying. Simultaneously, the uncertainty surrounding the US government shutdown cast a shadow over the market, significantly enhancing gold's safe-haven appeal, further amplified by the impending sharp weekly decline in Wall Street stock indices. The tech-heavy Nasdaq Composite Index recorded its biggest weekly drop in seven months last Friday, fueling investor concerns about the sustainability of the AI stock rally and driving funds back from risk assets to gold, a traditional safe haven. Renewed geopolitical tensions—with tensions between Russia and Ukraine, Israel and Palestine, and the Houthis—have reignited safe-haven demand, making this renewed geopolitical risk another major driver of gold price increases.
Gold prices closed above the key psychological level of $4,000 at the end of last week, suggesting a potentially bullish short-term technical outlook. However, bulls need to maintain a daily close above $4,000 for three consecutive trading days to sustain hopes for higher prices. The 14-day Relative Strength Index (RSI) on the daily chart has now climbed back above 50, indicating strengthening bullish momentum. If gold prices can effectively hold above the $4.046.20 level (October 31 high) and $4.053 level (Monday high), and then break through $4.154.70 (October 23 high), bulls may target the $4.200 level. A break above this level would pave the way for resistance at $4.250. Conversely, a break below $4.000 would target $3.960 (40-day simple moving average), followed by the October 28 low of $3.886.
Consider going long on gold today at $4.106, with a stop loss at $4.100 and targets at $4.140 and $4.150.
AUD/USD
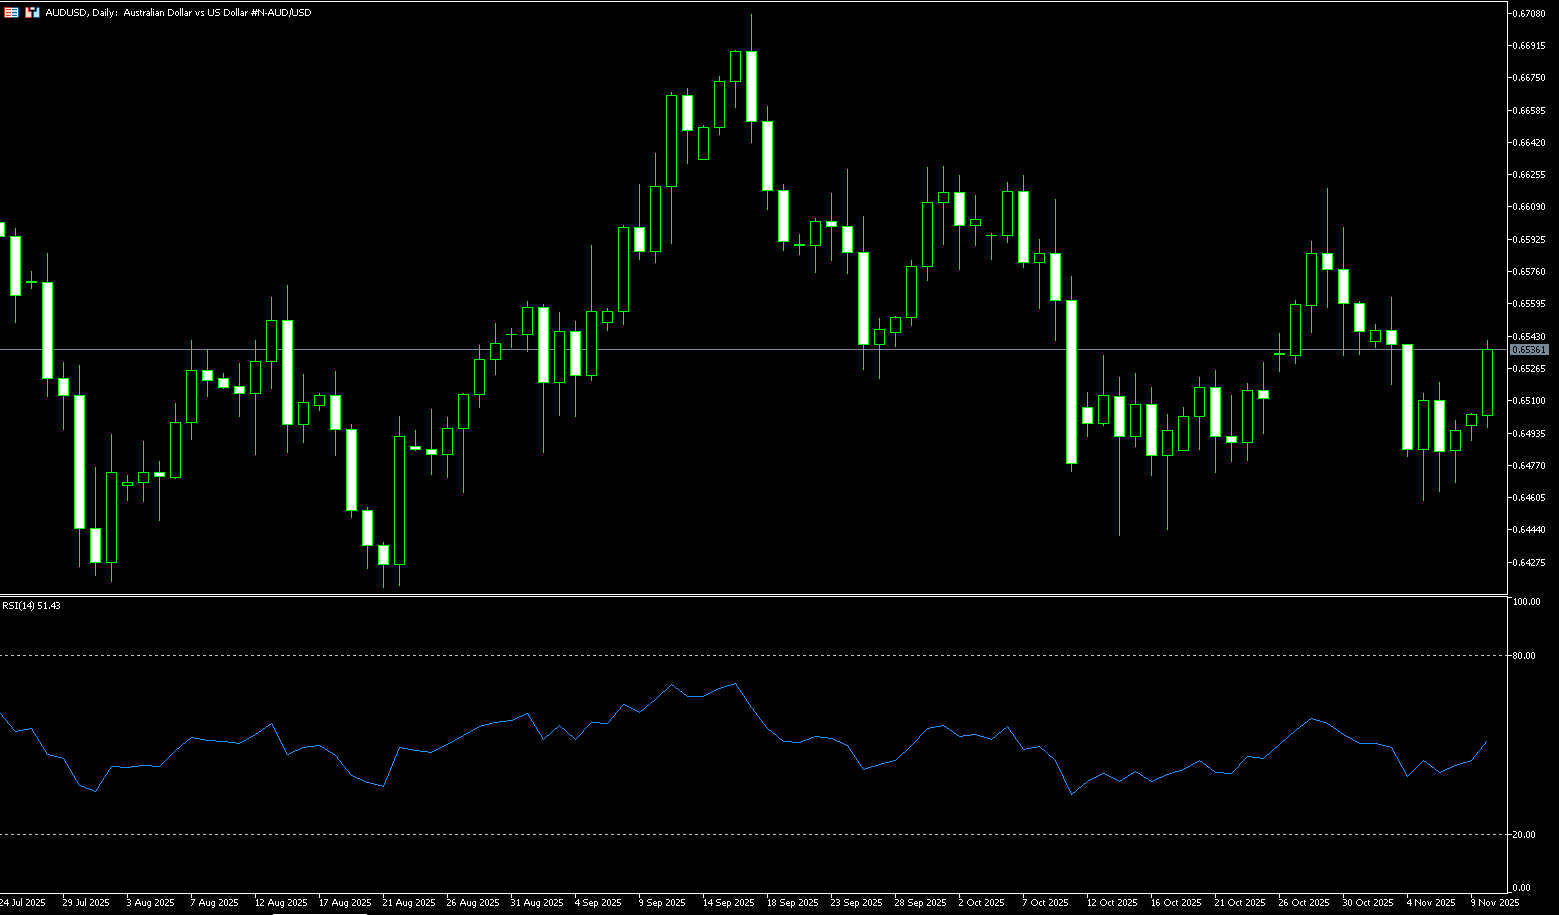
The Australian dollar rose above 0.6530 against the US dollar on Monday, extending its gains for the second consecutive trading day. The Australian dollar strengthened against the US dollar, supported by cautious comments from Reserve Bank of Australia Deputy Governor Andrew Hauser, who highlighted the unusual challenges facing monetary policy and stressed the need to maintain tight conditions to curb inflation. The Australian dollar was also supported by easing trade tensions between the US and China. China's Ministry of Commerce announced it would temporarily lift the ban on the approval of exports of "dual-use items" related to gallium, germanium, antimony, and superhard materials to the United States. The suspension took effect on Sunday and will last until November 27, 2026. Any changes in the Chinese economy could affect the Australian dollar, as China is Australia's main trading partner. China's Consumer Price Index (CPI) rose 0.2% year-on-year in October, recovering after a 0.3% decline in September. The market consensus was 0% for the reporting period. CPI inflation rose 0.2% month-on-month in October, compared with 0.1% in the previous month. The Producer Price Index (PPI) fell 2.1% year-on-year in October, following a 2.3% decline in September. This figure was higher than the market consensus of -2.2%.
The Australian dollar traded above 0.6530 against the US dollar on Monday. The 14-day Relative Strength Index (RSI) has rebounded to around 51, suggesting further upside potential. Technical analysis on the daily chart shows the pair consolidating within a sideways channel pattern, with highs and lows at 0.6615 and 0.6440 respectively, and a midline at 0.6530. It is slightly above the 5-day simple moving average at 0.6495, indicating strong short-term momentum. Initial resistance is at the 55-day simple moving average at 0.6556. A break above this level would improve medium-term price momentum and support the pair exploring the area around 0.6597 (October 30 high) and 0.6600 (a psychological level). On the downside, AUD/USD may find immediate support at the psychological level of 0.6500, followed by the 200-day simple moving average at 0.6450 and the five-month low of 0.6414 reached on August 21. Further support lies at the six-month low of 0.6372.
Consider going long on the Australian dollar today at 0.6528, with a stop-loss at 0.6515 and targets at 0.6580 and 0.6590.
GBP/USD
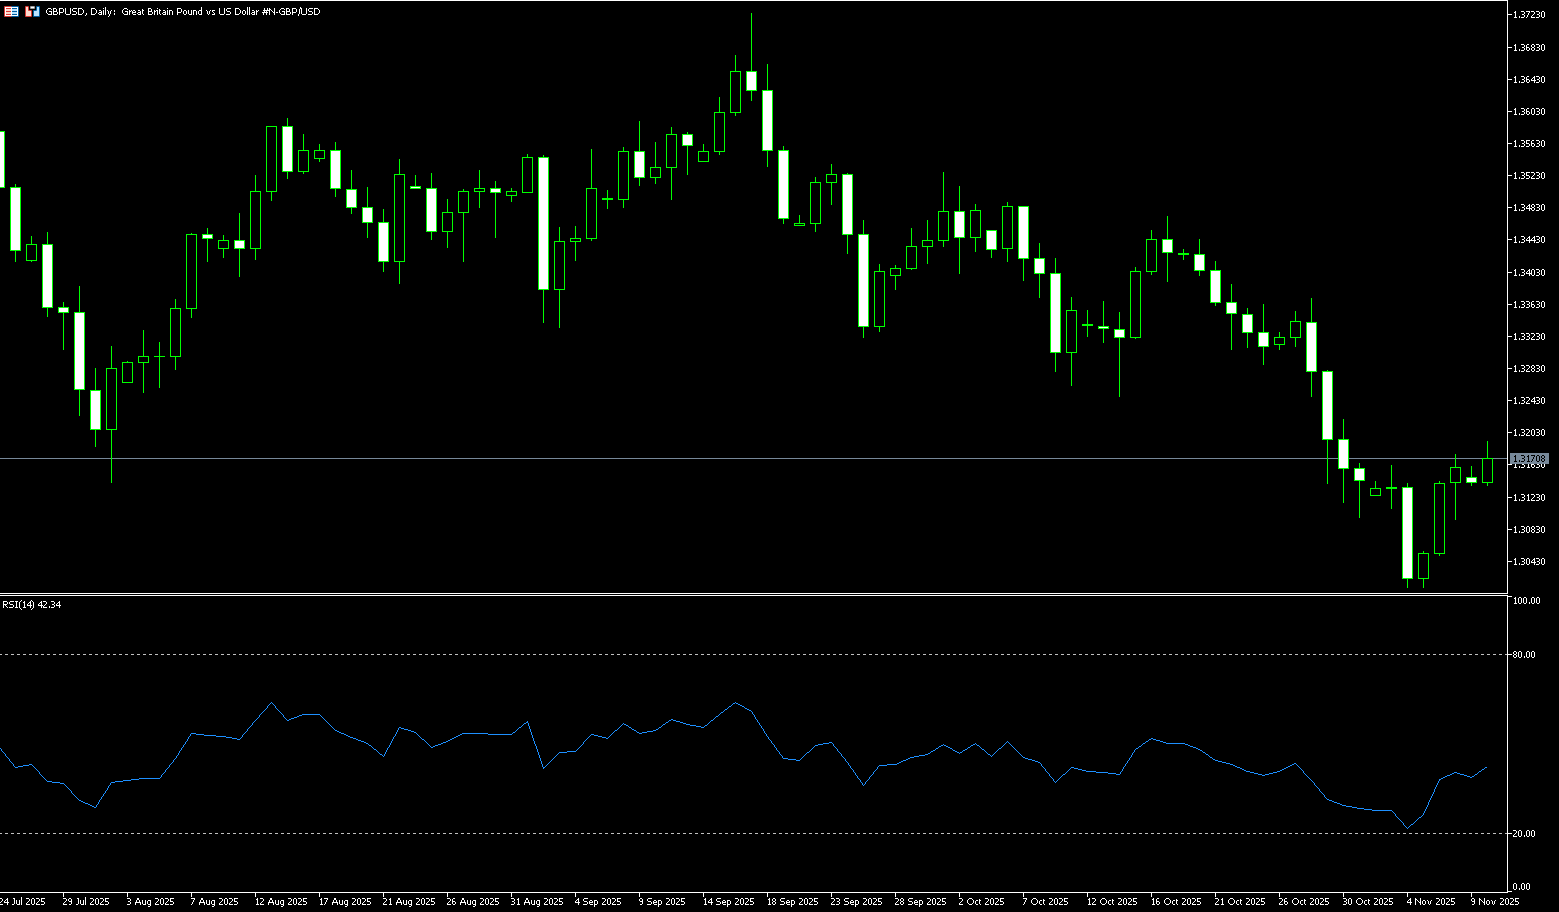
GBP/USD traded around 1.3180 on Monday, ending a three-day losing streak. The dollar strengthened against the pound on signs that the record US government shutdown might be ending. Bloomberg reported earlier on Monday that the US government shutdown was nearing its end as a group of centrist Senate Democrats agreed to support an agreement to reopen the government and provide funding for some departments and agencies. Hopes for an end to the US government shutdown could provide some support for the dollar and create resistance for the currency pair. The Bank of England decided last week to keep interest rates unchanged at 4.0%, citing caution ahead of the UK government's autumn budget in November. Bank of England Governor Andrew Bailey hinted at an imminent rate cut, and economists now expect one before Christmas. The Bank of England warned that future interest rate cuts "will therefore depend on the development of the inflation outlook."
Looking at recent price action, the GBP/USD technical chart shows a slight recovery, but after breaking below the 200-day simple moving average at 1.3268 before the end of October, the pair repeatedly declined along the downtrend, briefly reaching a low of 1.3010. Fortunately, strong buying support at the psychological level of 1.3000 allowed it to rebound above 1.1380. The 14-day RSI indicator shows bullish momentum, but buyers must break through the 1.3200 level (the psychological barrier) and reclaim the 200-day simple moving average at 1.3268 to regain control of the 1.3300 level. Conversely, further weakness would lead to a test of the 1.3105 level (the 5-day simple moving average). And the 1.3100 (psychological level) area. The next level will pave the way for a test of last week's low of 1.3010, followed by the psychological level of 1.3000.
Consider going long on GBP at 1.3170 today, with a stop loss at 1.3160 and a target of 1.3230. 1.3250
USD/JPY
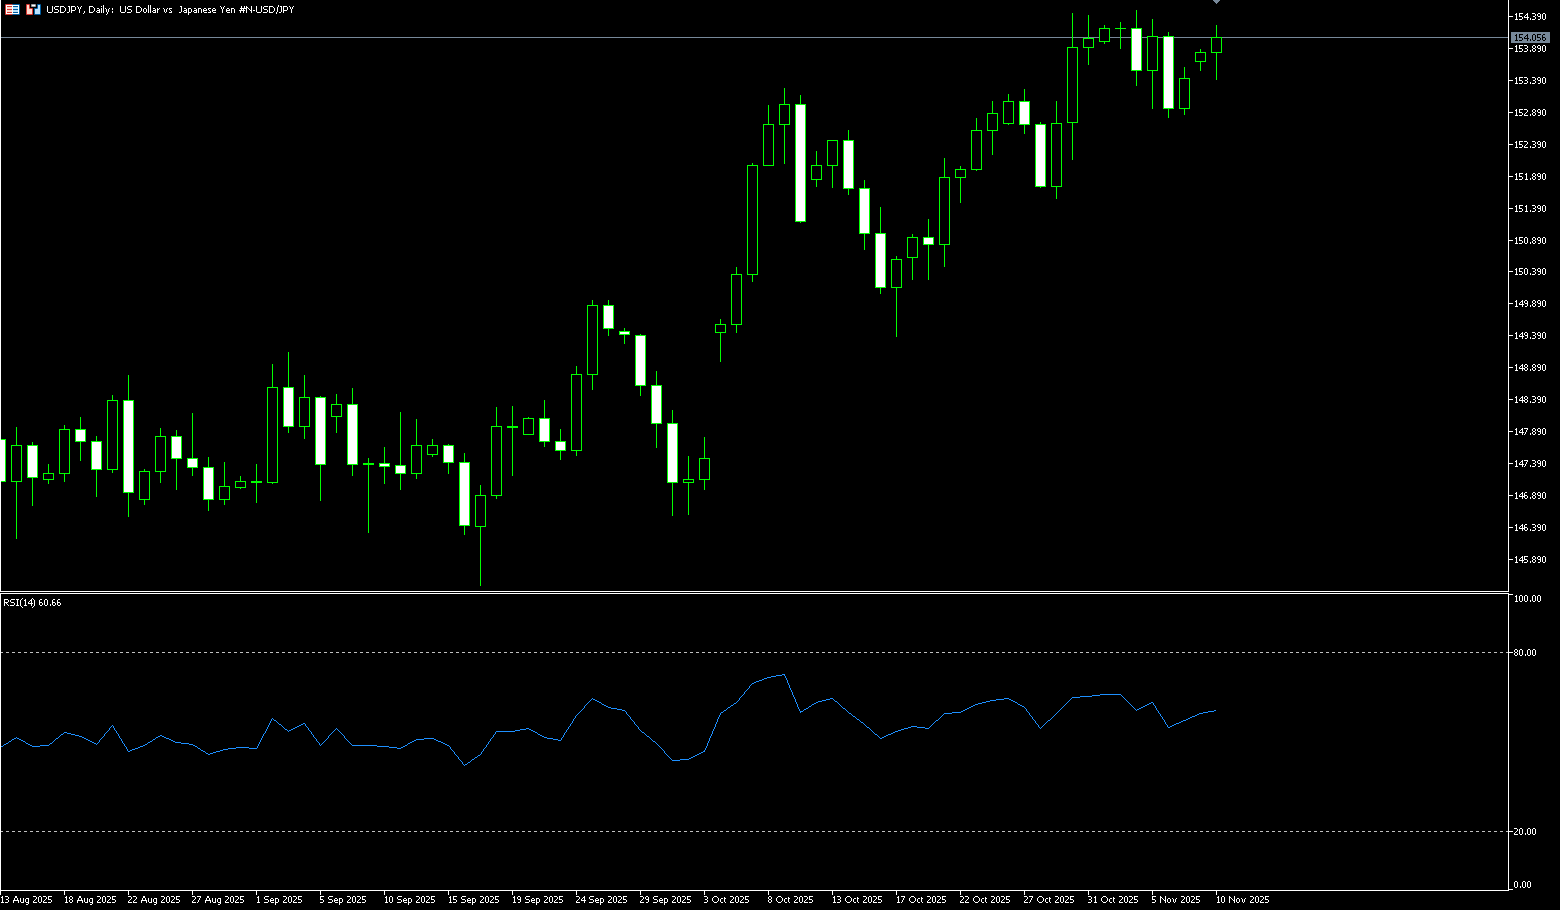
USD/JPY traded near 154.00 in early Asian trading on Monday, in positive territory. The yen retreated from a more than one-week high due to uncertainty surrounding the timing of the Bank of Japan's next interest rate hike. Japan's new Prime Minister Sanae Takaichi is seeking to finalize a roughly $65 billion economic stimulus package by the end of November to combat inflation and growth, and to fund it through a supplementary budget. Furthermore, the Bank of Japan remains reluctant to commit to further rate hikes. Nevertheless, the minutes of the Bank of Japan's September meeting showed that a growing number of policymakers believed the conditions for a rate hike were gradually maturing, with two members calling for an immediate increase. Board members noted that the Bank of Japan might be able to resume its stance on rate hikes once the 2% price stability target is more or less achieved. US consumer confidence is near a three-and-a-half-year low due to anxieties stemming from the government shutdown, which could put some selling pressure on USD/JPY.
The short-term USD/JPY technical chart shows buyers at 152.82 {last week's low}, The pair regained momentum near 152.62 (the 20-day simple moving average), with the next support level at 152.00 (the psychological level) and the 30-day simple moving average area around 151.78. While buyers prevented a drop to 152.00-151.78, a break above the latter would open the way to the 34-day simple moving average at 151.47. However, the 14-day Relative Strength Index (RSI) on the daily chart is near 60, suggesting that any further declines are more likely to be driven by buyers. That said, if USD/JPY rises above 154.00, the next resistance level will be the November 4 high of 154.49. Subsequently, USD/JPY will reclaim the 155.00 level and climb further to retest the 155.88 (February 3 high) resistance zone. The latter should now act as a key turning point level.
Consider shorting USD at 154.20 today. Stop loss: 154.40, Target: 153.30 153.10
EUR/USD
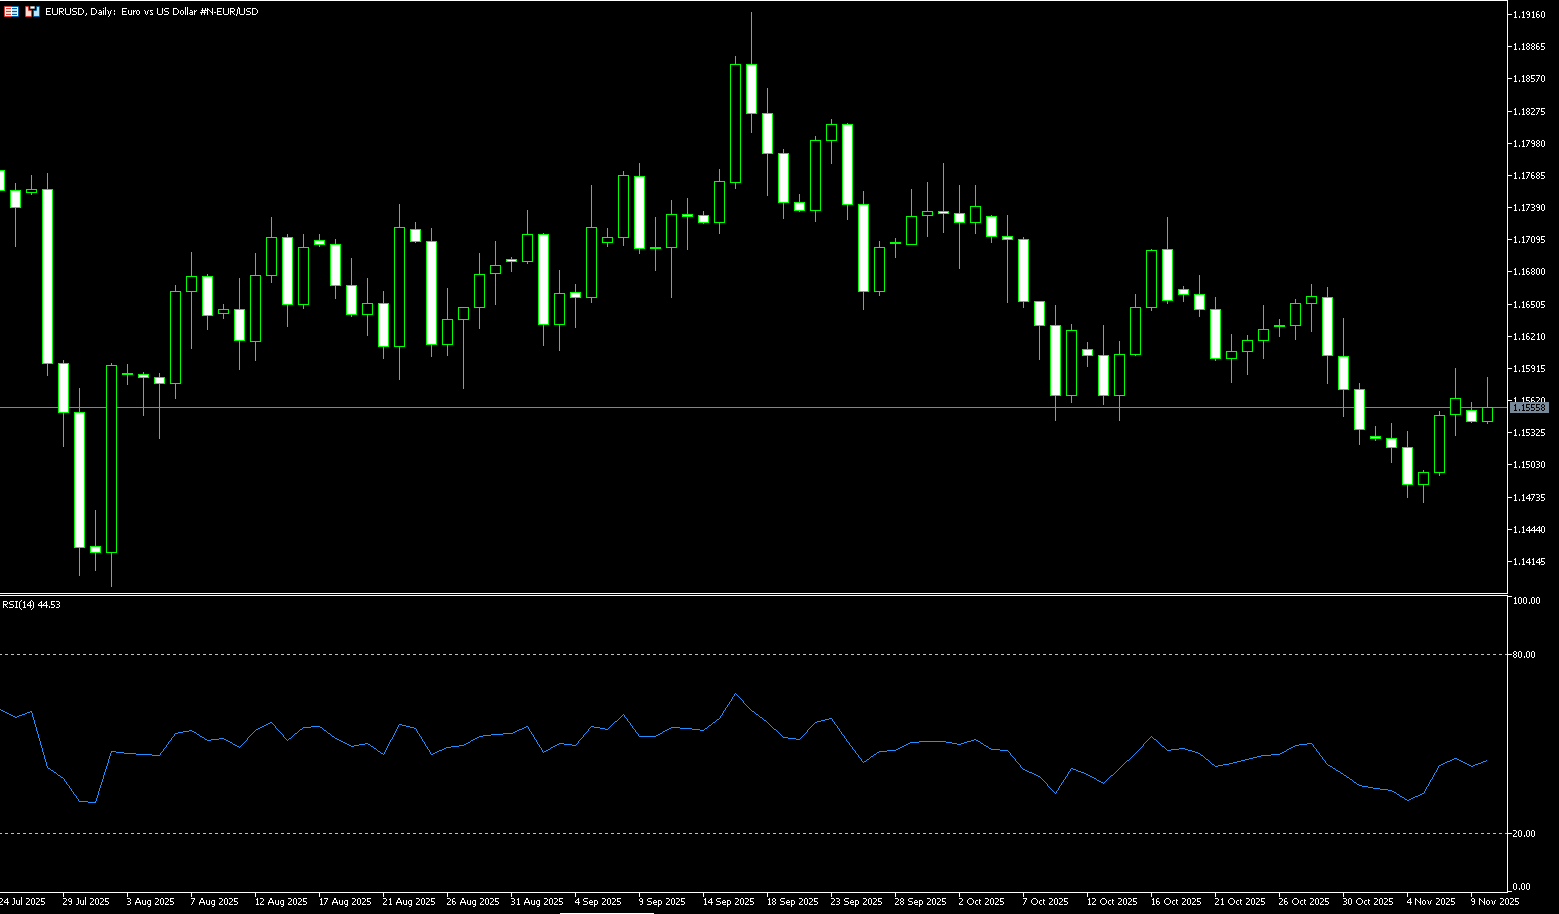
The euro/dollar pair weakened after three days of declines, trading around 1.1550 in Asian trading on Monday. The pair lost its footing as the dollar gained support following a Bloomberg report that the record U.S. government shutdown was nearing its end. A group of centrist Senate Democrats agreed to support an agreement to reopen the government and fund some sectors and agencies next year. U.S. Treasury Secretary Scott Bessant said on Monday that the economic impact of the U.S. federal shutdown was intensifying. He added that substantial progress was being made on inflation and that prices were expected to decline in the coming months. The euro/dollar pair may regain its strength as the euro could be supported by the divergence in policy outlook between the European Central Bank and the U.S. Federal Reserve. The ECB is expected to keep interest rates unchanged for some time.
Last week, the euro/dollar pair fell to a near three-month low of 1.1468, although sellers lacked the strength to push the exchange rate towards the round number 1.1400. Despite the strength of the 200-day simple moving average at 1.1347, EUR/USD appears destined to maintain a downward bias. Meanwhile, although buyers are gathering momentum for any further decline, as indicated by the 14-day Relative Strength Index (RSI) near 50, sellers remain in control as long as the indicator remains bearish. Therefore, if EUR/USD breaks below 1.1500 (the psychological level), it is expected to test initial support at 1.1468 (November 5th), followed by 1.1423 (the 185-day simple moving average) and 1.1400 (the psychological level). A break below this level would target the August low of 1.1391 (August 1st). However, in the short term, a rebound towards 1.1700 is possible if buyers reclaim 1.1591 (last Friday's high) and 1.1600 (the psychological level).
Consider going long on the Euro today at 1.1550, with a stop-loss at 1.1538 and targets at 1.1600 and 1.1610.
Disclaimer: The information contained herein (1) is proprietary to BCR and/or its content providers; (2) may not be copied or distributed; (3) is not warranted to be accurate, complete or timely; and, (4) does not constitute advice or a recommendation by BCR or its content providers in respect of the investment in financial instruments. Neither BCR or its content providers are responsible for any damages or losses arising from any use of this information. Past performance is no guarantee of future results.
Lebih Liputan


Pendedahan Risiko:Instrumen derivatif diniagakan di luar bursa dengan margin, yang bermakna ia membawa tahap risiko yang tinggi dan terdapat kemungkinan anda boleh kehilangan seluruh pelaburan anda. Produk-produk ini tidak sesuai untuk semua pelabur. Pastikan anda memahami sepenuhnya risiko dan pertimbangkan dengan teliti keadaan kewangan dan pengalaman dagangan anda sebelum berdagang. Cari nasihat kewangan bebas jika perlu sebelum membuka akaun dengan BCR.
BCR Co Pty Ltd (No. Syarikat 1975046) ialah syarikat yang diperbadankan di bawah undang-undang British Virgin Islands, dengan pejabat berdaftar di Trident Chambers, Wickham’s Cay 1, Road Town, Tortola, British Virgin Islands, dan dilesenkan serta dikawal selia oleh Suruhanjaya Perkhidmatan Kewangan British Virgin Islands di bawah Lesen No. SIBA/L/19/1122.
Open Bridge Limited (No. Syarikat 16701394) ialah syarikat yang diperbadankan di bawah Akta Syarikat 2006 dan berdaftar di England dan Wales, dengan alamat berdaftar di Kemp House, 160 City Road, London, City Road, London, England, EC1V 2NX. Entiti ini bertindak semata-mata sebagai pemproses pembayaran dan tidak menyediakan sebarang perkhidmatan perdagangan atau pelaburan.

 English
 简体中文
简体中文
 繁體中文
繁體中文
 Bahasa
Melayu
Bahasa
Melayu
 Tiếng
Việt
Tiếng
Việt
 ไทย
ไทย
 日本語
日本語
 한국어
한국어
 ភាសាខ្មែរ
 español