


0
The US Dollar Index
At the start of the week, the currency market showed a clear recovery in risk appetite, with the US dollar index remaining in a narrow range below 100. Risk-sensitive currencies such as the Australian dollar rose significantly, while safe-haven currencies such as the Japanese yen weakened against the dollar. This change was mainly due to the US Senate's advancement on Sunday of a bill to reopen the federal government, bringing hope for a breakthrough in the 40-day shutdown impasse. The market is anticipating potential political shifts from next year's midterm elections, which is beneficial for risk assets. The currency market is also digesting policy signals from central banks around the world. The market currently expects a 61% probability of a Fed rate cut in December, but this expectation could fluctuate significantly following the release of employment data. Statements by several Fed officials on Monday revealed internal disagreements on further rate cuts, highlighting the policy challenges facing Chairman Powell. As the government shutdown may end, market focus will shift to the upcoming economic data, particularly the non-farm payroll report, which will provide clearer guidance for the path of monetary policy.
The week started steadily, but the upward momentum of the US dollar index was contained within a narrow range of 99.50-99.70 in the early part of the week, resulting in a mild decline on the daily chart. The MACD is below the zero line, and the DIFF and DEA have not formed a golden cross, indicating weakening downward momentum and a technical correction. The 14-day RSI hovered around 55, reflecting a weak rebound. In fact, the US dollar index failed to maintain its May level above the psychological level of 100.00, an area that also coincides with its key 200-day simple moving average at 100.17. Therefore, the index has fallen back below the 100.00-100.17 range, although a further breakout above the key 200-day moving average is expected. It is currently trading at 99.65. The US dollar index remains in a downtrend, with 100 acting as a significant psychological resistance level, and the key 200-day simple moving average at 100.17 and the November 5th high of 100.36 forming stronger resistance zones. The Tuesday low of 99.28 is the first support area, with the next support level at 99.00 (the psychological level).
Today, consider shorting the US Dollar Index at 99.55, with a stop-loss at 99.66 and targets at 99.15 and 99.10.

WTI Crude Oil
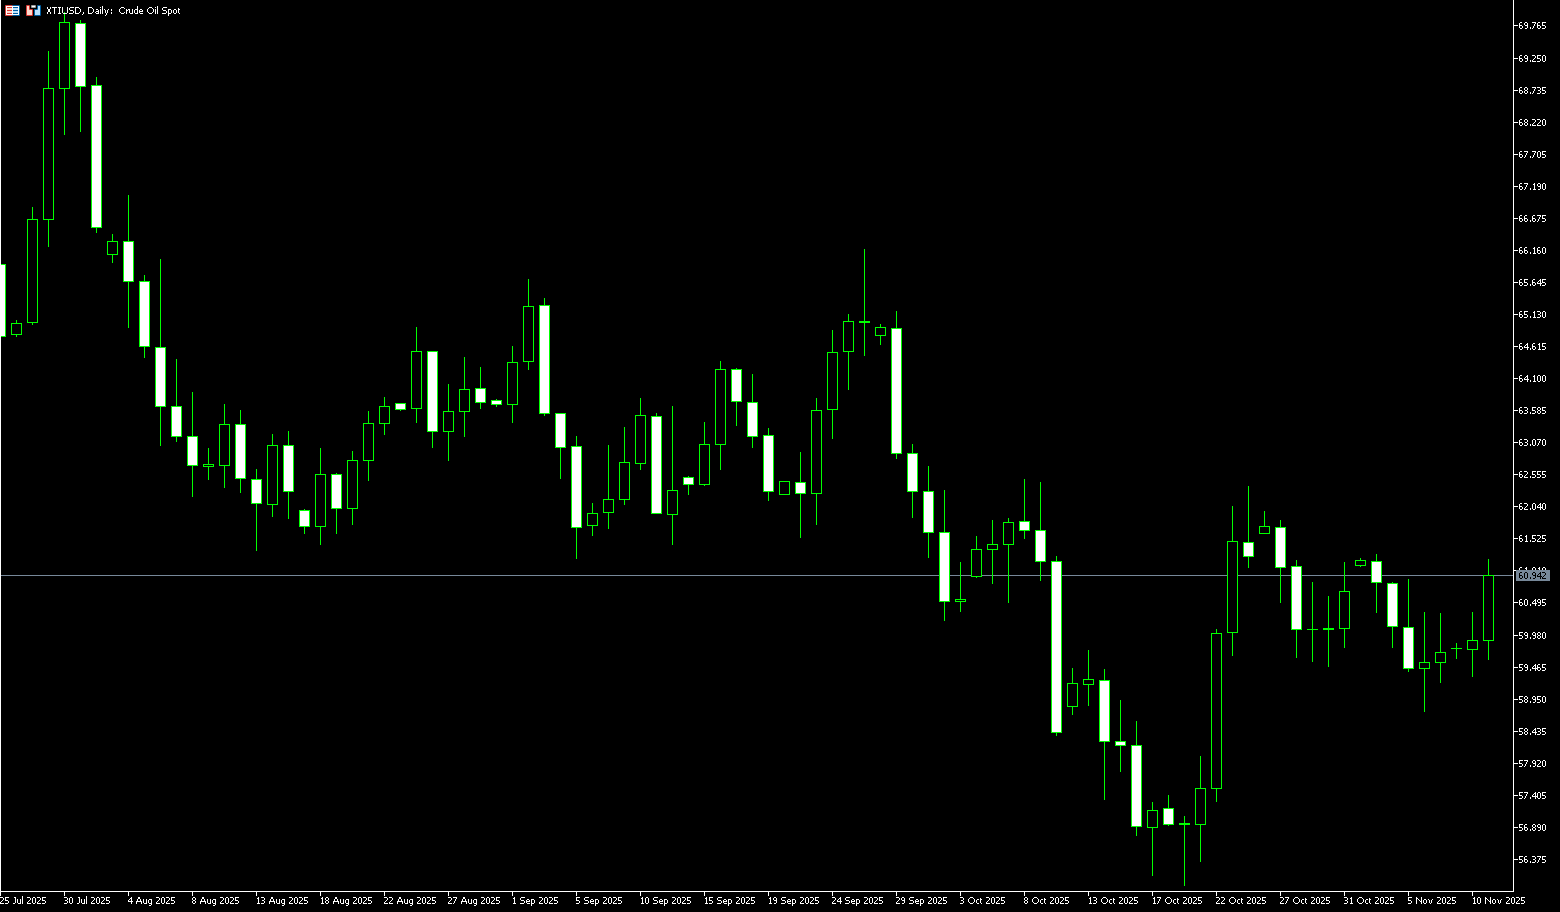
US crude oil is trading above $60 per barrel. Oil prices rose moderately at the beginning of the week, with the market exhibiting a supply-demand dynamic. Tight supply of refined products pushed prices up, while concerns about a crude oil oversupply limited gains. Geopolitical uncertainty and expectations of the US government reopening also supported bullish oil prices. The US Senate passed the first phase of the agreement to end the 40-day government shutdown, injecting some risk appetite into markets including oil. Traders are betting that the agreement could restore government spending, boosting demand in the world's largest oil consumer. However, market optimism regarding demand remains cautious. More than 2,800 flights were canceled in the US on Sunday, marking the worst disruption to air travel since the government shutdown began, raising concerns about short-term jet fuel consumption. That said, if the shutdown agreement is ultimately implemented, some of the lost demand could recover quickly in the coming weeks.
From a technical perspective, crude oil is stuck in a stalemate. Unless a key price level is broken, it will likely remain range-bound; oil prices are trading between $61.45 (the 55-day simple moving average) and $58.75 (the November 6th low). The 55-day moving average near $61.45 is providing strong resistance; bulls need a decisive break above this level to open up upward potential to $62.38 (the October 24th high). Conversely, a break below the $59.00 (psychological level) and the $58.75 (November 6th low) support level could trigger a new round of selling down to the $58 level. Until a clear breakout of these key price levels occurs, the market is expected to continue its consolidation and directionless movement. In short, traders are closely watching the developments of the shutdown agreement, but weak demand signals and rising inventories continue to weigh on oil prices. The market has not yet formed a clear trend, requiring a flexible approach.
Today, consider going long on crude oil at 60.70, with a stop-loss at 60.50 and targets at 62.00 and 62.30.
Spot Gold
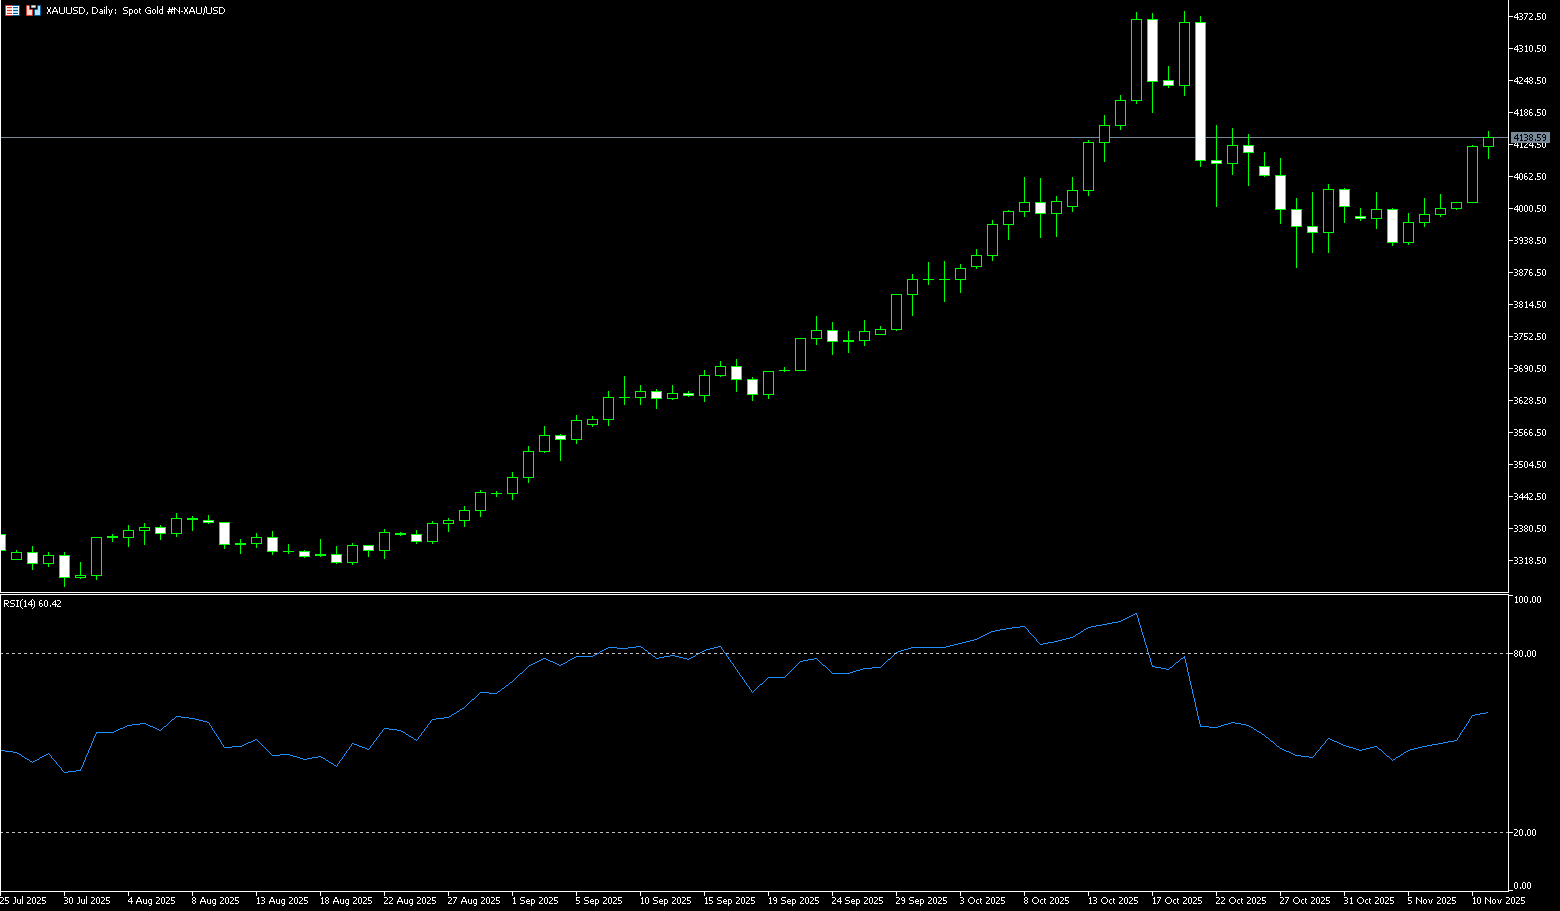
On Tuesday, spot gold traded around $4,130 per ounce. Gold prices climbed more than 3.3% in the first half of the week, reaching their highest closing level in over two weeks. Rising market expectations of a Federal Reserve rate cut boosted demand for gold; gold's safe-haven appeal as a non-interest-bearing asset was fully demonstrated. The root of all this lies in a series of weak US economic data released last week. These data acted like a hammer blow, shattering market illusions of a strong economy. Despite improved risk sentiment, gold did not fall back but instead rose. This is because while the shutdown is expected to end, its lingering economic damage (such as the employment data gap and mixed private sector data) has reinforced expectations of a rate cut. Investors are optimistic that the government shutdown will end soon, and this trend will eventually weaken. At that time, labor market and inflation data will become the focus, and gold's safe-haven role in uncertainty will become even more prominent. Gold prices could rise to the $4,200-$4,300 per ounce range by the end of this year, with a reasonable target of $5,000 in the first quarter of next year.
Spot gold rose more than 3.3% to $4,149 per ounce in the first half of this week. While rising US Treasury yields are typically bearish for gold, lingering political uncertainty and geopolitical risks in Gaza have strengthened demand for gold. Gold prices broke through the Bollinger Band's middle line at $4,082.60 and the $4,100 psychological level, indicating strong bullish momentum. The MACD indicator's DIFF rose to 21.09 and DEA to 9.15, both above the zero line, with the histogram bars lengthening, confirming the upward trend. The combination of technical and fundamental factors strengthens the short-term upward momentum for gold. Support and resistance are seen at $4,082.60 (the Bollinger Band's middle line) and $4,020 (the 14-day simple moving average), with resistance at $4,149 (Tuesday's high) and the $4,200 level.
Consider going long on gold today at $4,125, with a stop loss at $4,120 and targets at $4,160 and $4,150.
AUD/USD
The Australian dollar fell against the US dollar on Tuesday after rising for two consecutive days. The dollar weakened as the US dollar was supported by increased hopes for an imminent solution to the US government shutdown. Westpac's consumer confidence jumped 12.8% in November to 103.8, exceeding 100 for the first time since February 2022. National Australia Bank's business conditions improved slightly in October, rising to 9 from 8 in September, driven by stronger sales and profitability, while employment remained unchanged. Meanwhile, business confidence fell to 6 in the same month from 7. The Australian dollar was supported by cautious comments from Reserve Bank of Australia (RBA) Deputy Governor Andrew Hauser, who highlighted the extraordinary challenges facing monetary policy and stressed the need to maintain tight conditions to curb inflation. Hauser noted that Australian monetary policy is in a tricky phase as demand has already outpaced potential output at the start of the economic recovery, leaving limited room for short-term easing.
The daily chart shows the AUD/USD pair consolidating and trading sideways above 0.6500. However, the pair remains above the 9-day simple moving average at 0.6517, indicating strong short-term momentum. Immediate resistance is at 0.6580 (the upper Bollinger Band). A break above this level would improve medium-term price momentum and support the pair exploring the psychological level of 0.6600. Further gains would support the AUD/USD pair near the October 29 high of 0.6617. On the downside, the pair is likely to find immediate support at the psychological level of 0.6500, followed by another psychological level. Further support levels are at the 200-day simple moving average at 0.6452 and the five-month low of 0.6414 reached on August 21.
Consider going long on the Australian dollar today at 0.6516, with a stop loss at 0.6505 and targets at 0.6570 and 0.6580.

GBP/USD
The pound fell sharply against major currencies on Tuesday. The pound weakened as UK labor market data for the three months to September indicated a further deterioration in the job market. The Office for National Statistics reported that employers laid off 22,000 workers, while 91,000 jobs were added in the three months to August. This is the highest level since March 2024. Furthermore, the ILO unemployment rate accelerated to 5%, higher than the expected 4.9% and the previous 4.8%. This is the highest level since March 2021. The signs of a weaker job market are expected to fuel market expectations of a rate cut by the Bank of England at its December policy meeting. This week, market expectations for a dovish stance at the December meeting have accelerated following the central bank's removal of the word "cautious" from its monetary policy statement last Thursday. Meanwhile, average hourly earnings excluding bonuses, a key indicator of wage growth, rose modestly to an annualized rate of 4.6%, compared to 4.7% in the three months to August.
The 14-day Relative Strength Index (RSI) on the daily chart is seen as a key factor prompting some short covering in the GBP/USD pair for the second consecutive day. However, the recent break below the technically important 200-day simple moving average support levels of 1.3271 and 1.3200 is favorable for bearish traders. This area is more likely to limit any further gains above the 1.3100 level. Nevertheless, some follow-through buying could push the spot price above 1.3200 and towards the 200-day simple moving average. On the other hand, the psychological level of 1.3000 established this week, or the multi-month low of 1.3010, is likely to continue to protect the immediate downside. A clear break below this level would be seen as a new trigger for bearish traders and pave the way for further short-term depreciation. GBP/USD could subsequently fall to the intermediate support at 1.2940 before heading towards the 1.2900 level, eventually settling near the next relevant support zone of 1.2875-1.2870.
Consider going long GBP at 1.3150 today, with a stop-loss at 1.3140 and targets at 1.3210 and 1.3220.

USD/JPY
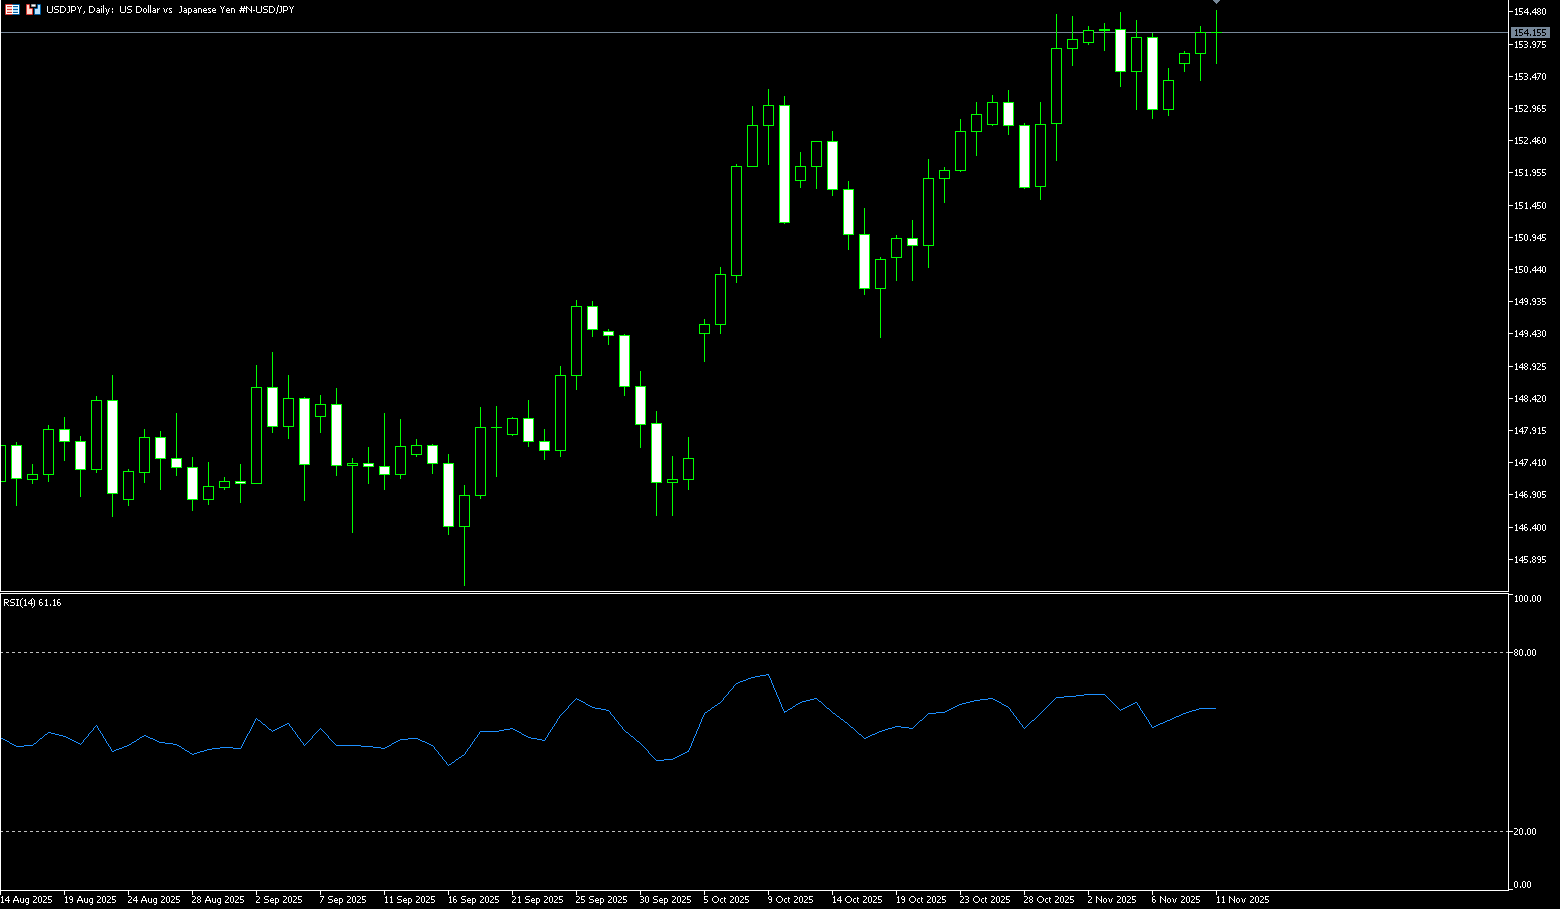
The Bank of Japan moved further away from its new multi-month low against the US dollar during Tuesday's Asian session, although any meaningful appreciation seemed unlikely. Yen bears became cautious as markets anticipated potential intervention by Japanese authorities to curb further depreciation of the currency. This, combined with a weak dollar, limited the pair's movement near the 154.45-154.50 resistance zone. However, uncertainty surrounding the timing of the Bank of Japan's next rate hike could pose resistance for the yen. In fact, the Bank of Japan's opinion summary released on Monday showed disagreement on interest rate hikes. Coupled with BOJ Chancellor Junko Nakagawa's statement that the central bank would take a cautious approach to policy decisions, this further reinforced market expectations that the BOJ might postpone rate hikes, as the market bets on a massive stimulus package under the new Prime Minister Sanae Takaichi's government, which could continue to weaken the yen. Furthermore, the possibility of the US government shutdown ending could further suppress any meaningful appreciation of the safe-haven yen.
From the daily chart, a sustained break above 154.50 (the high since February) for USD/JPY would be seen as a new trigger point for the bulls. Given that the oscillators on the daily chart are comfortably in positive territory (+62) and still far from overbought territory, the spot price may target the psychological level of 155.00, and further climb to the resistance zone of 155.88 (the high on February 3). The pair could then eventually climb to the psychological level of 156.00. On the other hand, any corrective pullback near the Asian session low of 154.00 could be seen as a buying opportunity in the 153.60-153.50 area. This should help limit the downside for USD/JPY near the 153.00 level. However, a decisive break below the latter could pave the way for a deeper decline to the 152.15-152.10 area, which should now act as strong support for the pair.
Consider shorting USD at 154.30 today. Stop loss: 154.46, Target: 153.30, 153.40
EUR/USD
EUR/USD retreated slightly after four days of gains, trading around 1.1580 in the Asian session on Tuesday. The pair was flat as hopes for a resolution to the US government shutdown grew, with the dollar receiving support. US President Trump on Monday endorsed a bipartisan agreement to end the US government shutdown, hinting at a possible reopening within days. Senate Majority Leader John Thune said he expects Trump to sign the bill after it passes Congress. However, the dollar faces challenges as heightened uncertainty about the US economy fuels expectations of a near-term Federal Reserve rate cut. EUR/USD may regain its strength as the euro could be supported by cautious rhetoric surrounding the European Central Bank's policy outlook. Traders are awaiting German ZEW survey data later in the day. Traders expect the ECB to hold rates steady for now, buoyed by stable economic performance and inflation near its target.
Looking at recent movements, further gains in EUR/USD remain insufficient, at least in the short term. Indeed, the 1.1700 area has proven to be a rather difficult level to break. The bulls' initial targets are 1.1700 (the psychological level) and the weekly high of 1.1728 (October 17th). A break above this level would target the October high of 1.1778 (October 1st). A higher target is the 1.1800 (psychological level). On the other hand, momentum indicators seem to favor further declines in the short term: the 14-day Relative Strength Index (RSI) is stable below 45, while the Average Directional Index (ADX) is close to 18, showing a moderately strong trend. The November low of 1.1500 has become immediate support, followed by the 1.1400 (psychological level) and the 1.1391 (August 1st) area, representing the August low.
Consider going long on the Euro today at 1.1570, with a stop-loss at 1.1560 and targets at 1.1620 and 1.1630.

Disclaimer: The information contained herein (1) is proprietary to BCR and/or its content providers; (2) may not be copied or distributed; (3) is not warranted to be accurate, complete or timely; and, (4) does not constitute advice or a recommendation by BCR or its content providers in respect of the investment in financial instruments. Neither BCR or its content providers are responsible for any damages or losses arising from any use of this information. Past performance is no guarantee of future results.
Lebih Liputan


Pendedahan Risiko:Instrumen derivatif diniagakan di luar bursa dengan margin, yang bermakna ia membawa tahap risiko yang tinggi dan terdapat kemungkinan anda boleh kehilangan seluruh pelaburan anda. Produk-produk ini tidak sesuai untuk semua pelabur. Pastikan anda memahami sepenuhnya risiko dan pertimbangkan dengan teliti keadaan kewangan dan pengalaman dagangan anda sebelum berdagang. Cari nasihat kewangan bebas jika perlu sebelum membuka akaun dengan BCR.
BCR Co Pty Ltd (No. Syarikat 1975046) ialah syarikat yang diperbadankan di bawah undang-undang British Virgin Islands, dengan pejabat berdaftar di Trident Chambers, Wickham’s Cay 1, Road Town, Tortola, British Virgin Islands, dan dilesenkan serta dikawal selia oleh Suruhanjaya Perkhidmatan Kewangan British Virgin Islands di bawah Lesen No. SIBA/L/19/1122.
Open Bridge Limited (No. Syarikat 16701394) ialah syarikat yang diperbadankan di bawah Akta Syarikat 2006 dan berdaftar di England dan Wales, dengan alamat berdaftar di Kemp House, 160 City Road, London, City Road, London, England, EC1V 2NX. Entiti ini bertindak semata-mata sebagai pemproses pembayaran dan tidak menyediakan sebarang perkhidmatan perdagangan atau pelaburan.

 English
 简体中文
简体中文
 繁體中文
繁體中文
 Bahasa
Melayu
Bahasa
Melayu
 Tiếng
Việt
Tiếng
Việt
 ไทย
ไทย
 日本語
日本語
 한국어
한국어
 ភាសាខ្មែរ
 español