0
Currency & Commodity Analysis:
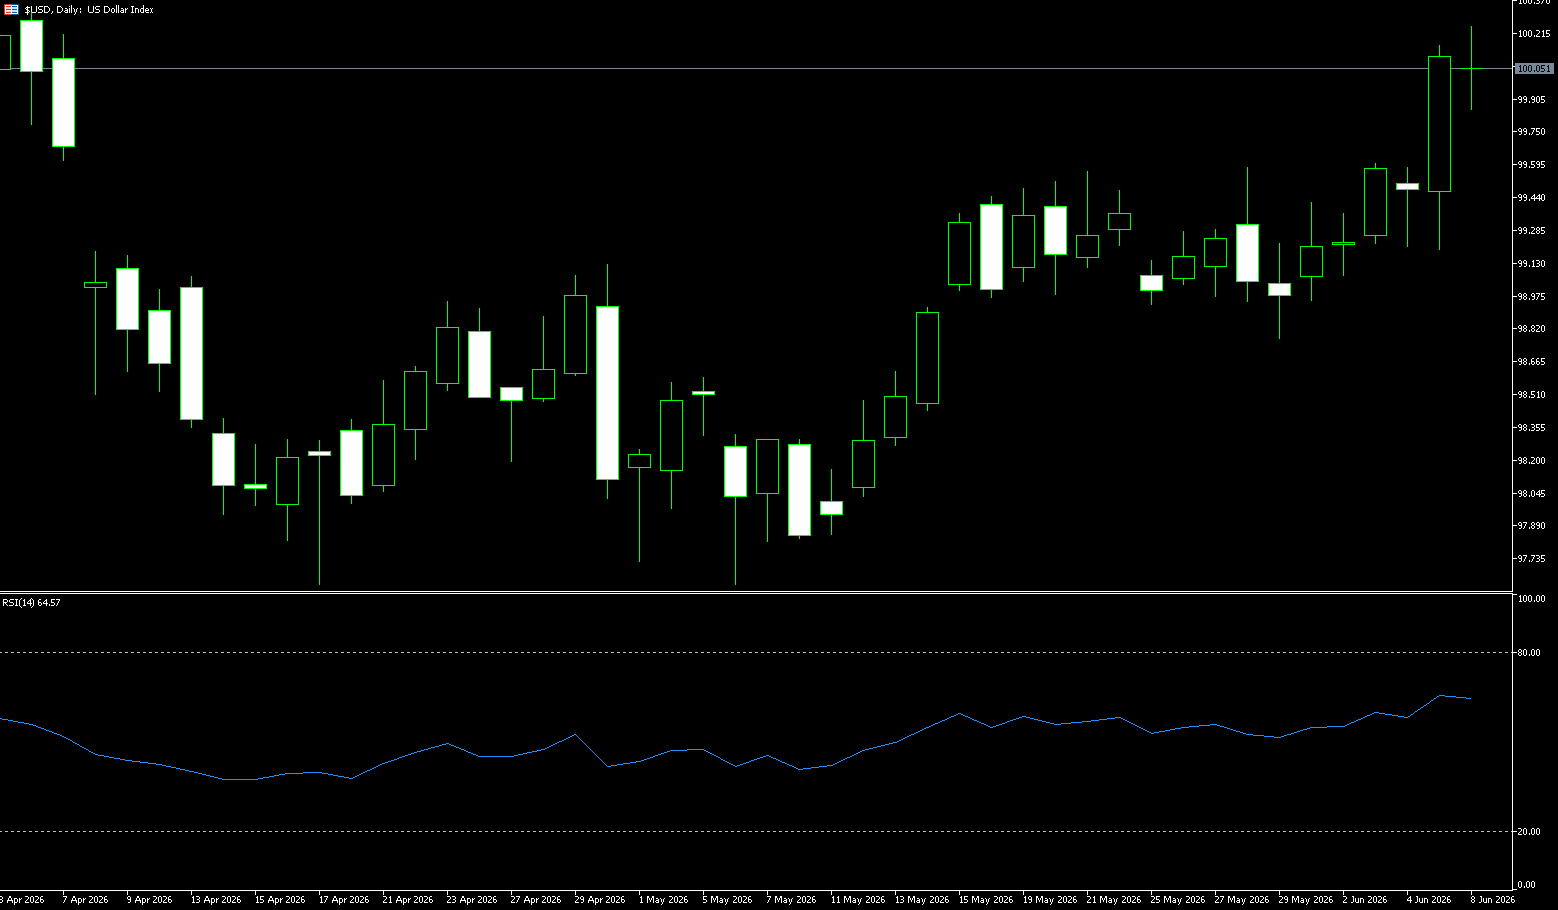
US Dollar Index
Last week, the US dollar index showed significant strength, driven by strong May non-farm payroll data, breaking through the Bollinger Band's upper limit (99.99). This morning, it remained above 100, putting downward pressure on major non-US currencies. USD/JPY approached the 160 level, while the euro and pound fell after the data release. Adjustments in market expectations regarding Fed policy were the core driving factor. The market believes that the resilience of the labor market exceeded the revised data, suggesting that the employment diffusion index has rebounded above 50. The Fed's decision-making focus remains on inflation control, and improved employment reduces the urgency for its actions on the employment front. Some opinions point out that although the current threshold for interest rate hikes is high, the possibility of policy adjustments this year still exists, providing fundamental support for the dollar. Strong US economic data combined with external uncertainties have consolidated the dollar's temporary strength. Technically, many currency pairs are approaching the extreme Bollinger Band area, indicating short-term directional pressure, but the overall trend is still dominated by fundamentals. Investors should pay attention to the guiding role of subsequent inflation data and policy signals on exchange rates.
Overall, the short-term foreign exchange market is influenced by both strong US employment data and geopolitical factors, with the US dollar index showing a clear advantage, while major non-US currency pairs are undergoing divergent adjustments. The US dollar index is rising strongly, currently at 100.09, having broken through the Bollinger Bands at 99.99 and above the psychological level of 100.00. After a significant rebound from the year's low of 95.56, it has maintained a high level of fluctuation and is now showing bullish dominance again. The MACD indicator is expanding positively, with the DIFF higher than the DEA, indicating continued bullish momentum. In the short term, the US dollar index may maintain a slightly stronger fluctuation, with attention focused on its performance within the 99.00-100.00 range. The US Treasury yield curve may continue its steepening trend, requiring attention to changes in the spread between the 10-year and 2-year yields. On the upside, the 100.60 level (the high on March 30th) is worth watching, which would open up further upside potential to the psychological level of 101.00. As for the downside support, the 9-day moving average is at 99.40. Then there's the 99.00 (psychological level) and 98.92 (last week's low) area.
Consider shorting the US Dollar Index at 100.10 today, with a stop loss at 100.20 and targets at 99.70 and 99.60.
WTI Crude Oil
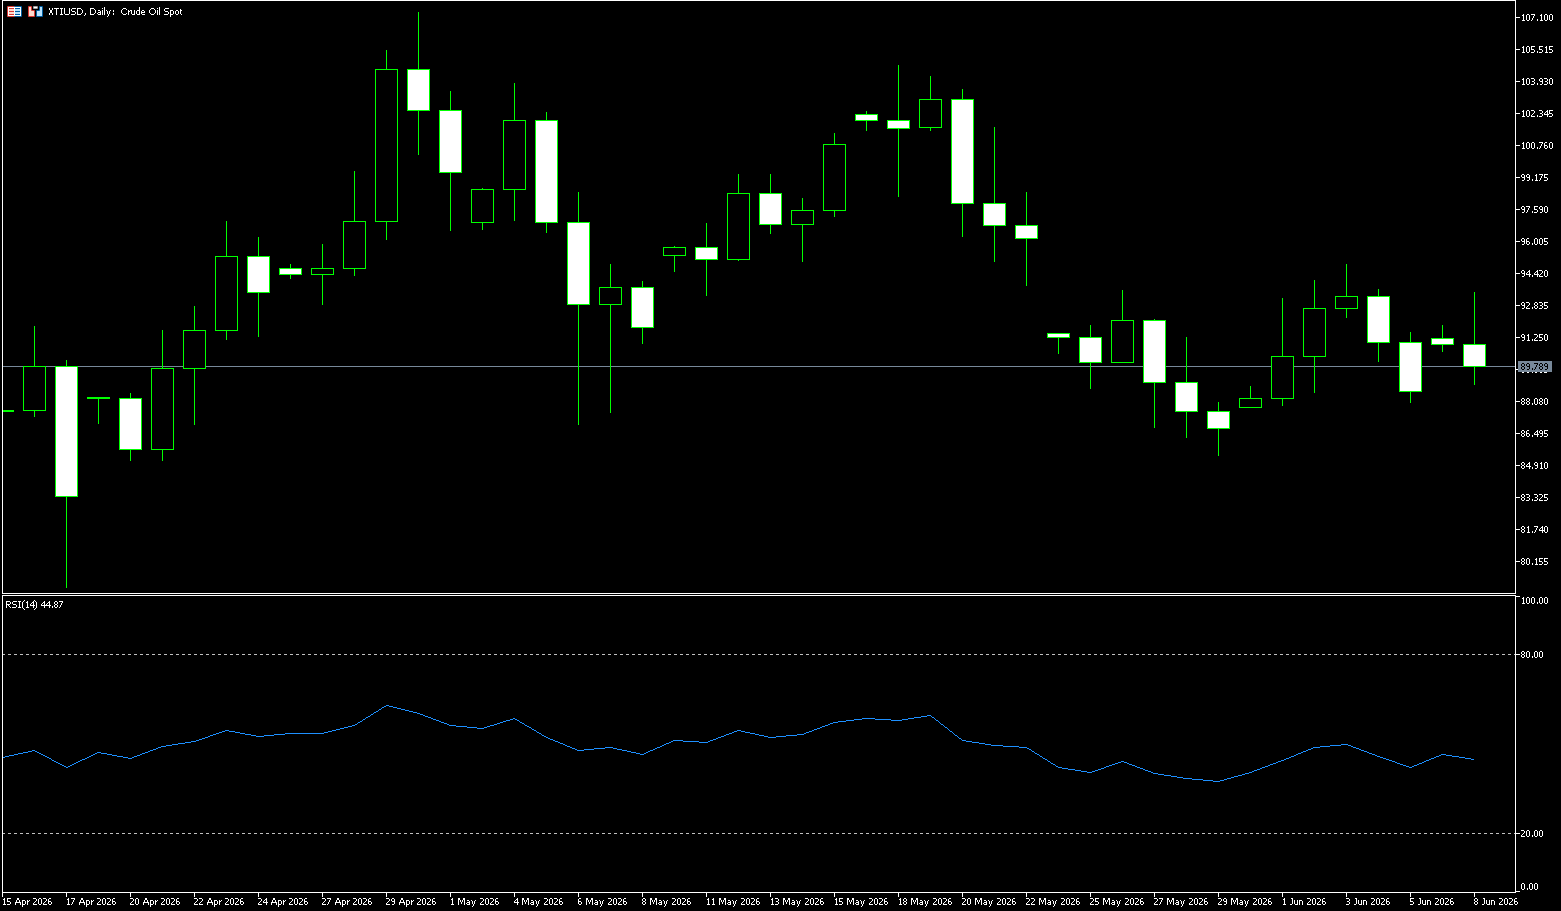
WTI crude oil prices saw a short-term rebound at the beginning of the week, briefly touching around $91.86 per barrel before stabilizing slightly to around $90. Market focus is on optimistic expectations regarding peace talks with Iran. Although sporadic tensions persist in the Middle East, overall risk appetite is putting downward pressure on oil prices. The crude oil market is at a critical juncture where supply and demand dynamics intertwine with geopolitical variables. On one hand, progress in peace talks offers room for speculation about supply recovery; on the other hand, the reality of disrupted shipping through key straits continues to support the bottom range. Technically, prices have clearly retreated from previous highs, and after attempting a rebound at lower levels, have weakened again, indicating a fierce tug-of-war between bulls and bears. The impact of high oil prices on different countries is not uniform. While Asia and Europe, as net importers of crude oil and refined products, bear the greatest pressure, not all crude oil exporters are winners. The real winners are those countries with integrated capabilities from upstream extraction to refining to export (such as Saudi Arabia and Russia).
Despite sporadic tensions in the Middle East, overall risk appetite is putting downward pressure on oil prices. Oil prices are currently trading above $90, between the middle and lower Bollinger Bands. The MACD indicator is in negative territory, and the histogram shows that bearish momentum still dominates, indicating a weak short-term trend. US WTI crude oil is currently trading within a range of $86.28 (May 28 low) - $86.67 (90-day moving average) to $99.71 (May 6 high) - $100.00 (psychological level), forming its current main trading range. Geopolitical events remain the main catalyst. If expectations of conflict ease further, oil prices may test the lower edge of the trading range; conversely, if new disturbances emerge, prices may return to the upper edge. On the upside, watch the 20-day moving average at $94.24 and $94.86 (June 3 high). On the downside, consider the $88.93 (Monday low) and the $86.28 (May 28 low) area.
Today, consider going long on crude oil at $89.60, with a stop loss at $89.40 and targets at $91.00 and $92.00.
Spot Gold
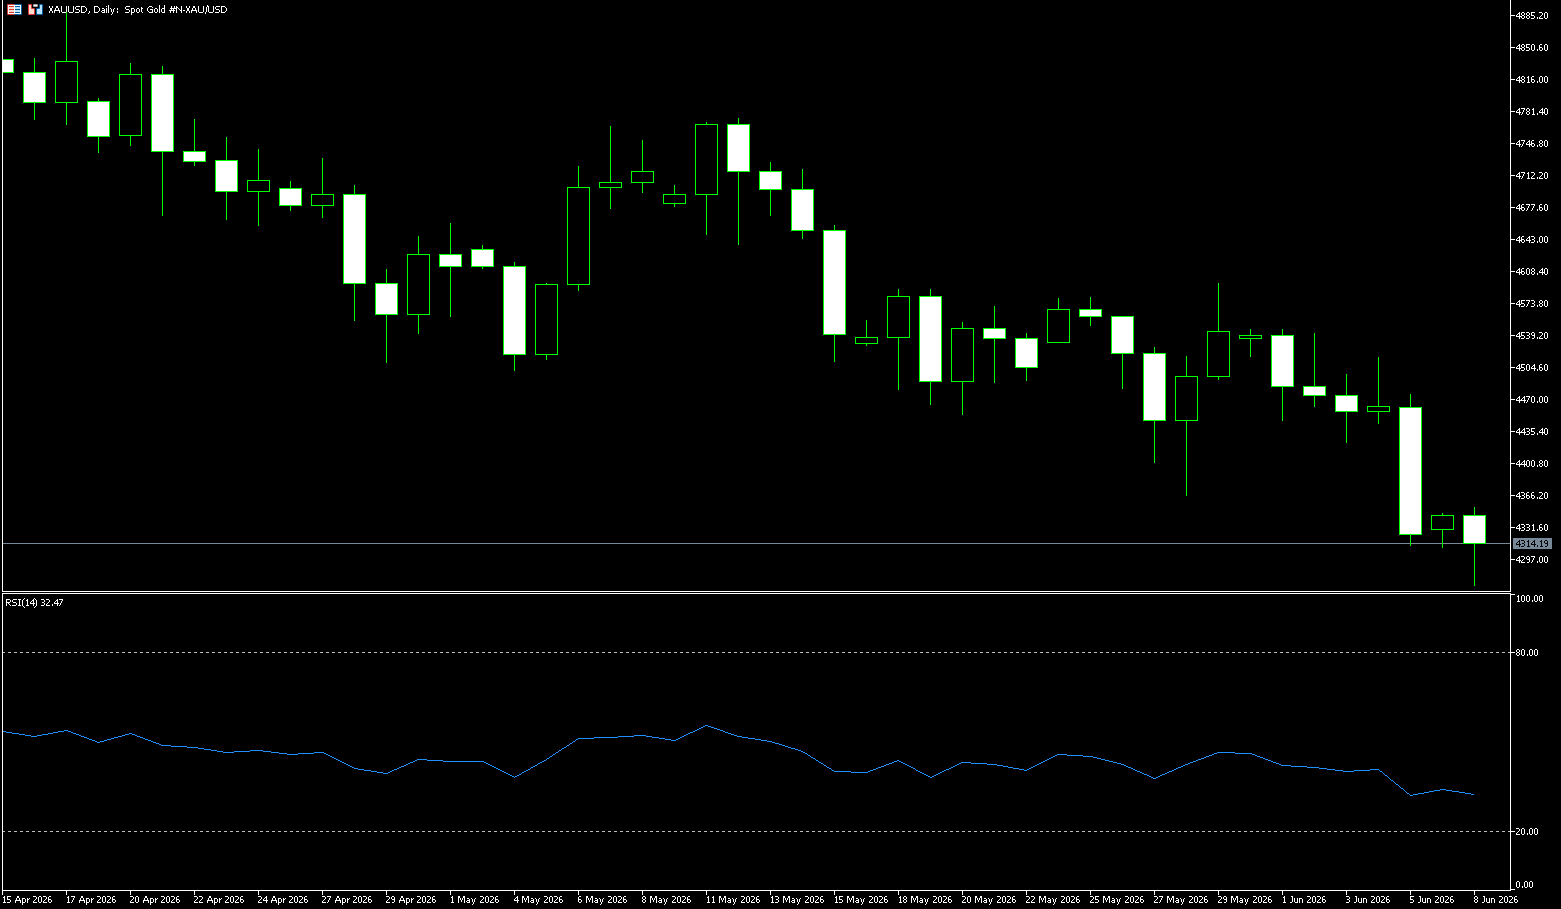
Amidst the rapidly deteriorating situation in the Middle East, the international gold market is experiencing significant volatility. From the evening of June 7th to the early morning of June 8th, 2026, the Iranian Revolutionary Guard launched multiple rounds of ballistic missiles at an Israeli airbase in northern Israel. This "warning" strike directly impacted the already fragile US-Iran ceasefire agreement and further pressured the global energy supply chain. Although oil prices jumped over 3% to $93.90 per barrel in early trading on Monday (June 8th), spot gold gradually recovered its losses after a slight dip on Monday, currently trading around $4320 per ounce. The safe-haven logic of geopolitical conflict and the strong pressure from expectations of a Fed rate hike are vying for dominance, making the future direction of gold highly uncertain. Gold's weakness is not solely due to geopolitical events. Last Friday (June 5th), the US released its May non-farm payroll report, far exceeding expectations, with 172,000 new jobs added, double the market expectation, and the unemployment rate remaining stable at 4.3%. This strong data significantly solidified market expectations that the Federal Reserve will maintain high interest rates or even raise them.
From a technical perspective, the daily chart for gold has shown signs of weakening. After breaking below the lower support of the previous consolidation pattern, the short-term trend has entered a critical verification phase. If it fails to regain a foothold above $4,400, it means the previous consolidation platform has been broken downwards, and the market may gradually shift into a downward trend. The moving average system is beginning to flatten, indicating a significant weakening of short-term bullish momentum. The MACD indicator, after a bearish crossover at a high level, continues to diverge downwards, showing that bearish forces are strengthening. The RSI indicator has fallen back to near the neutral zone, reflecting a cooling of market buying interest. The key support level to watch is $4,300. A decisive break below this level would open up further downside potential, with targets potentially reaching $4,250 or even lower. On the upside, the key resistance level to watch is around $4,400. Only a recapture of this level can alleviate the current technical pressure towards the $4,500 psychological level.
Today, consider going long on gold at 4,320, with a stop-loss at 4,315 and targets at 4,380 and 4,370.
AUD/USD
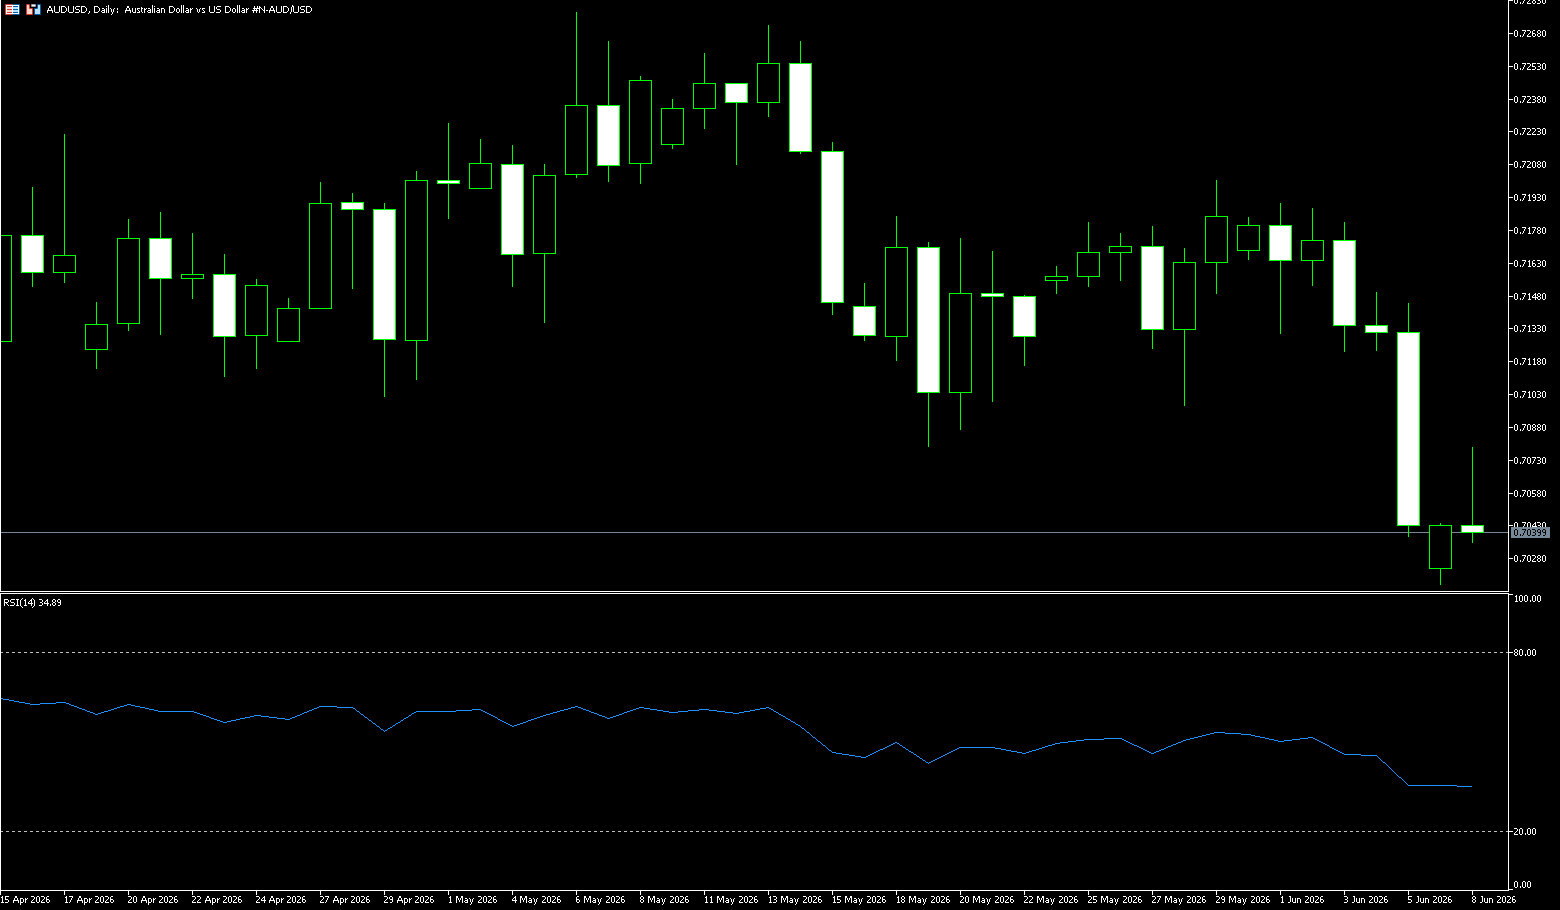
The AUD/USD pair was under pressure around 0.7040 during Monday's Asian morning session. The Australian dollar continued to fall against the US dollar due to escalating tensions in the Middle East and stronger-than-expected US economic data. Meanwhile, US President Trump stated he would call Israeli Prime Minister Netanyahu, urging him not to retaliate, as he feared an attack would "undermine" the trilateral agreement. Escalating tensions in the Middle East and the fragile peace agreement between the US and Iran could boost safe-haven currencies like the US dollar and put pressure on the pair. On the other hand, the Reserve Bank of Australia's hawkish tone may help limit the Australian dollar's decline. RBA Governor Michelle Bullock emphasized that after three rate hikes earlier this year that pushed the cash rate to 4.35%, the central bank remains strictly focused on curbing inflation. Block added that with inflation too high, the board will take what it deems necessary to achieve its mandate of price stability and full employment.
In the current volatile environment, further loss of momentum cannot be ruled out. If sentiment deteriorates, the US dollar strengthens rapidly, or Chinese data continues to disappoint, spot prices could fall further and challenge the key 0.7000 area in the relatively short term. The rally is indeed present, but the market is not yet fully convinced. The daily chart shows the AUD/USD pair approaching the psychological level of 0.7000, suggesting that upward attempts may face supply pressure, while the 14-day Relative Strength Index (RSI) near 39 suggests that bullish momentum is waning rather than being fully oversold. The AUD/USD pair could fall to the psychological level of 0.7000. Further declines will put downward pressure on the pair, potentially testing the 0.6948 (140-day simple moving average) and the 0.6900 (psychological level) area, which provides deeper support. On the upside, immediate resistance lies at the 0.7100 (psychological level) and the 0.7155 (20-day simple moving average) area, followed by the 0.7200 (psychological level).
Consider going long on the Australian dollar today at 0.7032, with a stop loss at 0.7020 and targets at 0.7090 and 0.7080.
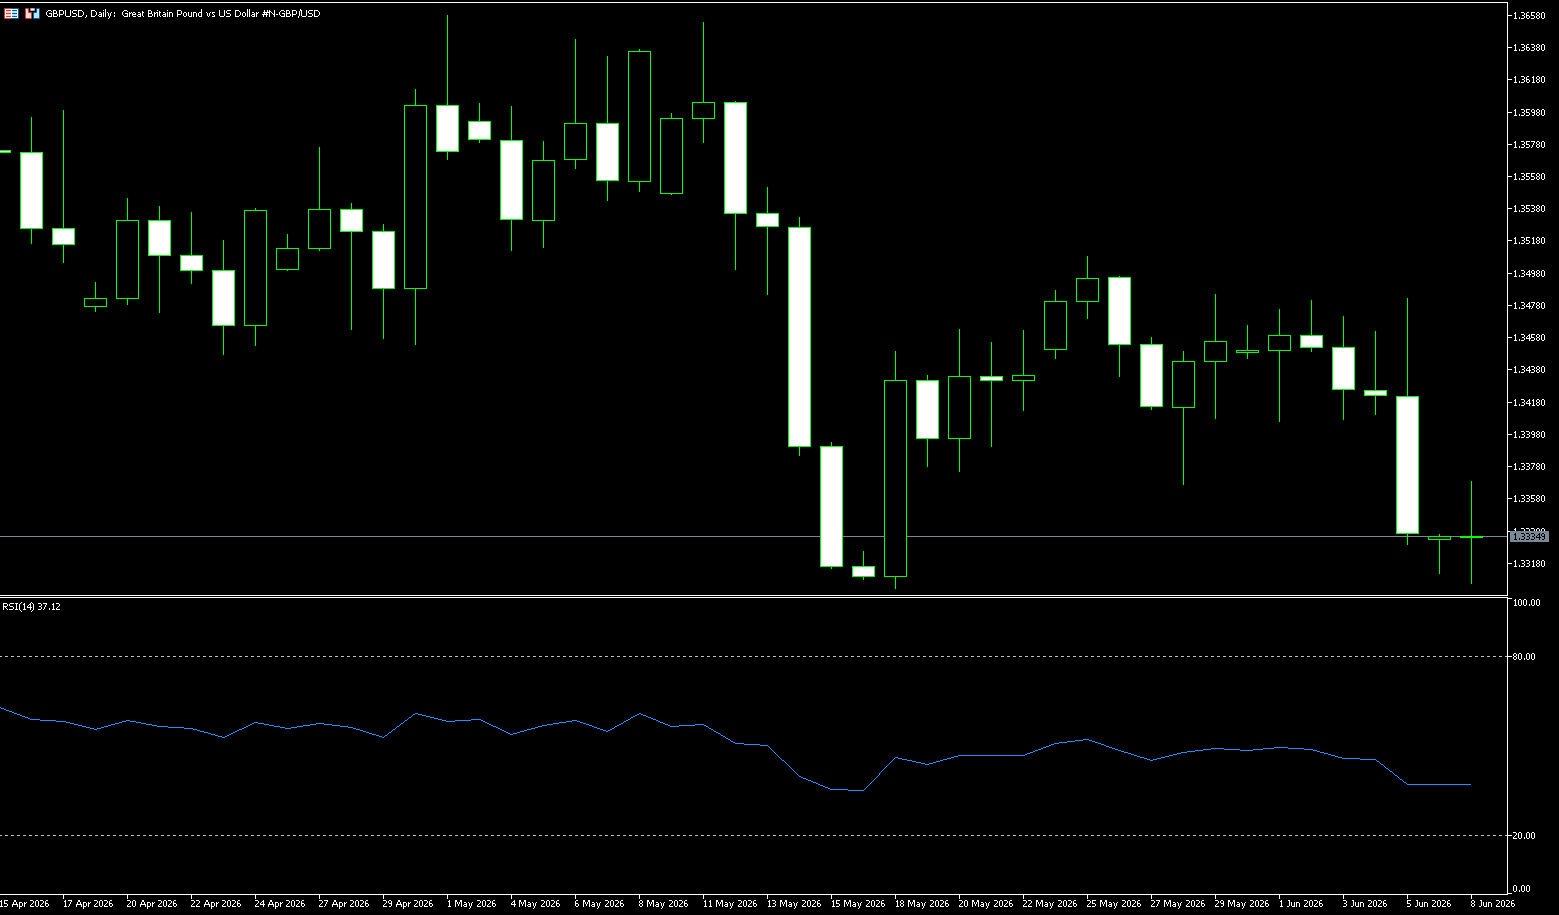
GBP/USD
The GBP/USD pair has recovered slightly from a three-week low hit during Monday's Asian session and climbed to near the mid-1.3300 level in the past hour. However, strong bullish sentiment surrounding the US dollar suggests caution before positioning for further appreciation. The US dollar index surged to a two-week high on Friday due to a strong US non-farm payroll report, reaffirming hawkish expectations from the Federal Reserve. Furthermore, market concerns that war-driven energy price increases will fuel inflation and increase bets on an eventual Fed rate hike are also weighing on the market. Traders currently expect a greater than 70% probability of the US Federal Reserve raising interest rates by at least 25 basis points in 2026. This, along with geopolitical uncertainty, will continue to support the safe-haven dollar. Furthermore, political turmoil in the UK, particularly the challenge to Prime Minister Keir Starmer's leadership, could weaken the pound and limit the upside potential of GBP/USD. On the other hand, the US and Iran remain at odds on several key issues, including Tehran's nuclear program and the crucial Strait of Hormuz. This perpetuates geopolitical risks, which is favorable for dollar bulls.
From a daily chart perspective, GBP/USD is in a state of uncertainty: risks remain, but market reactions are muted; the overall trend for GBP/USD remains one of medium- to long-term upward oscillation. The current exchange rate is trading near major moving averages, indicating a relatively balanced balance between bullish and bearish forces. The key support level is near the psychological level of 1.3300, followed by support at 1.3211 (April 7th low) and the 1.3200 psychological level. Key resistance levels are near 1.3400 and 1.3397 (5-day moving average). The MACD indicator is above the zero line, but the red bars are showing signs of shrinking, indicating weakening upward momentum. The RSI indicator remains in the neutral-to-strong zone, reflecting a continued bullish bias, but lacking clear breakout momentum in the short term.
Consider going long on GBP at 1.3328 today, with a stop loss at 1.3318 and targets at 1.3380 and 1.3500.
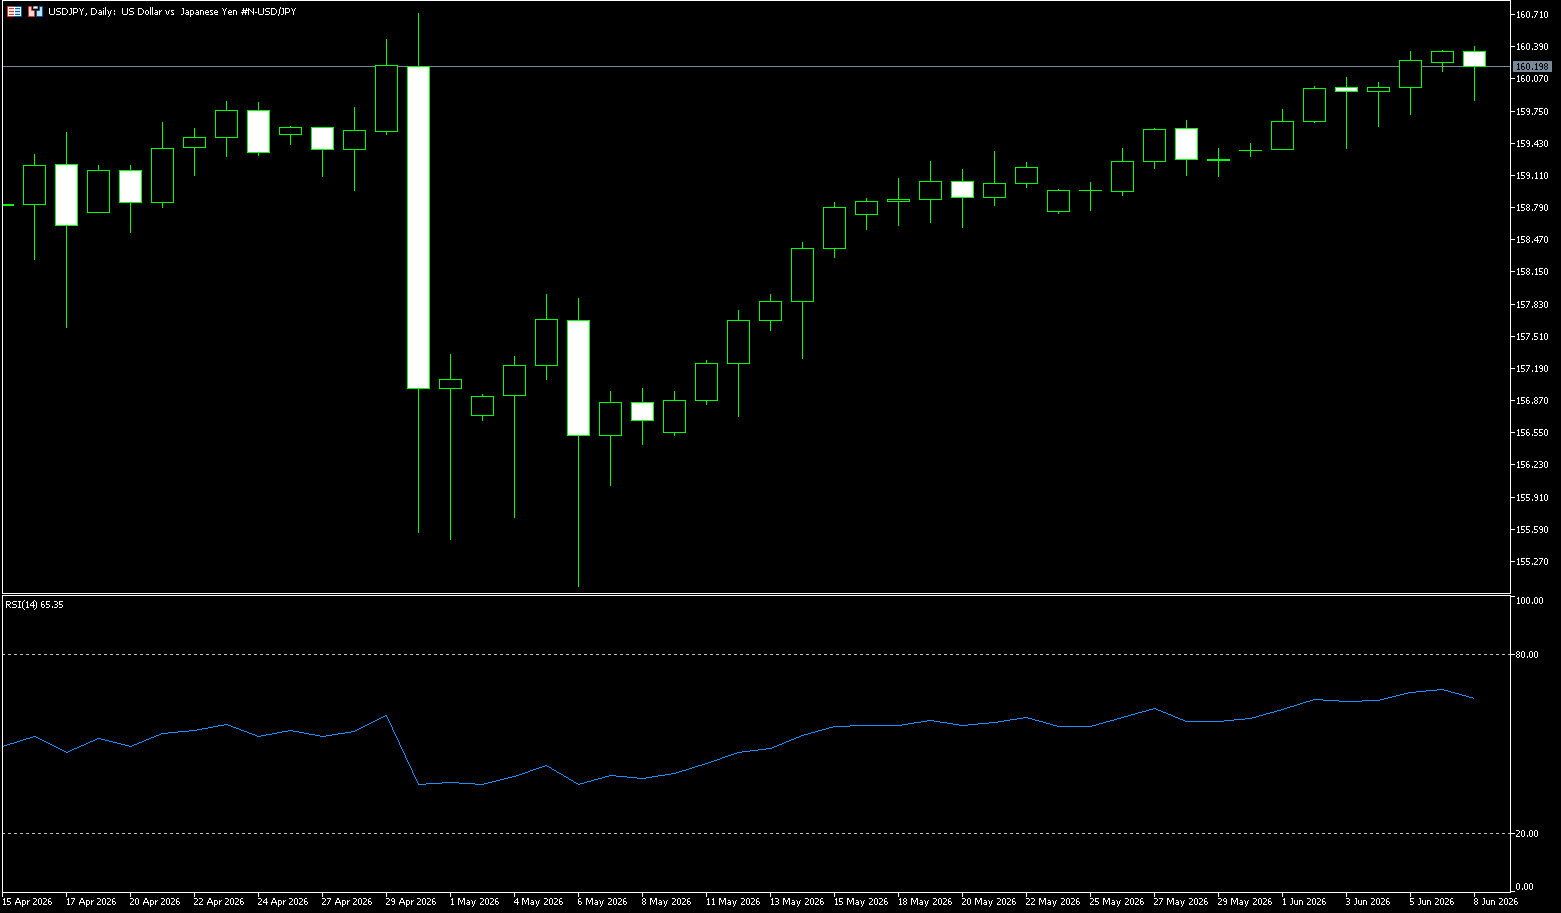
USD/JPY
USD/JPY traded modestly after a modest gain the previous day, hovering around 160.30 in Asian trading on Monday. With the pair holding above the key 160.00 level, market participants remain highly vigilant, watching for potential government intervention. However, trading remained stable after Japan released its Q1 2026 GDP data. The Japanese GDP figures showed strong economic resilience, with the economy growing 0.5% quarter-on-quarter. This figure was in line with preliminary estimates, exceeding market expectations of 0.3% and accelerating from the previous quarter's 0.2% growth, marking the country's strongest quarterly expansion since early 2025. Amid escalating tensions in the Middle East over the weekend, USD/JPY remained stable. To contain the situation, US President Trump announced emergency intervention, calling Israeli Prime Minister Netanyahu and explicitly demanding that Israel suspend retaliatory strikes. The White House is deeply concerned that a major retaliation could completely undermine the fragile ongoing negotiations between the two sides, and President Trump insisted that negotiations were close to reaching a final agreement with Tehran.
This week, USD/JPY maintained a generally high-level upward trend, gradually recovering from the previous pullback area. The current price is around 160.30, close to the previous {30/4} stage high of 160.73, indicating continued bullish momentum. The exchange rate is currently hovering near the Bollinger Band upper band at 160.75, exhibiting strong technical characteristics, but also accompanied by short-term profit-taking pressure. The MACD indicator shows the DIFF line above the DEA line, with the histogram remaining positive, reflecting an unchanged upward trend. As long as buyers hold the support zone above the psychological support level of 160.00, the overall bias remains upward, aiming to push back towards the upper channel line at 160.75 (the Bollinger Band upper band) and 160.73 (the high of April 30th). Furthermore, the psychological level of 161.00 remains a key upside scenario. Any corrective pullback is likely to continue attracting new buying near the psychological support level of 160. However, a significant break below this level could trigger some technical selling towards the 20-day moving average at 159.21, paving the way for a deeper decline.
Today, consider shorting the US dollar at 160.35, with a stop loss at 160.50 and targets at 159.40 and 159.50.
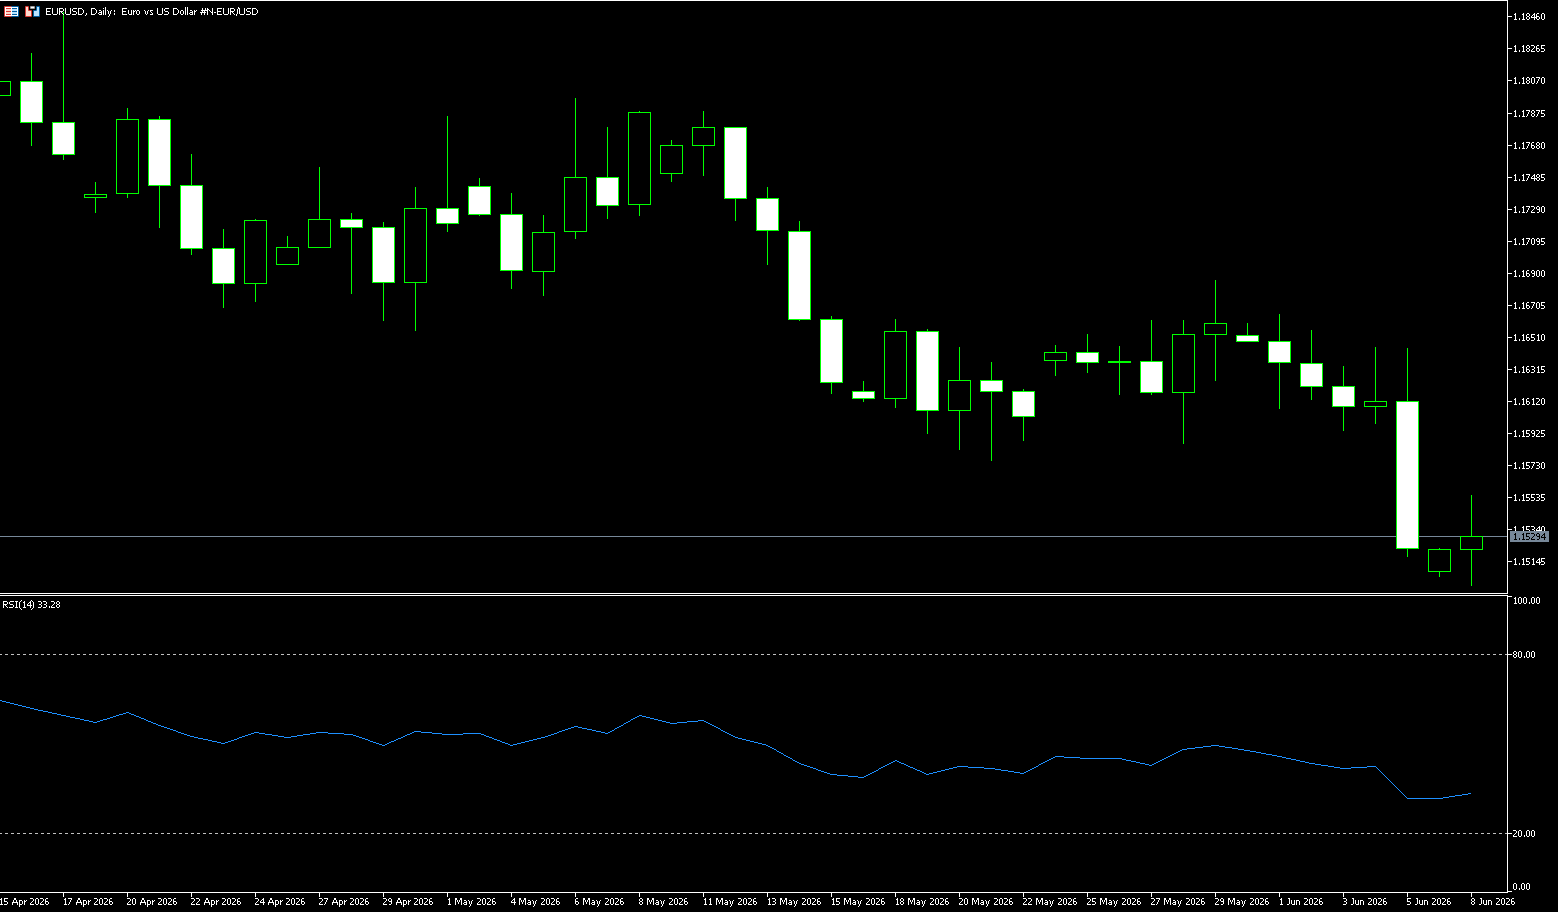
EUR/USD
The euro/dollar pair strengthened to around 1.1535 in early Asian trading on Monday. However, ongoing geopolitical tensions may limit the euro's upside potential against the dollar. US President Trump said on Sunday that Israel should not retaliate against Iran after its missile attack, arguing that further action would "undermine" the trilateral agreement. "We don't need another one," Trump told Axios after the Iranian attack, adding that he planned to call Israeli Prime Minister Benjamin Netanyahu. Iranian officials said they would launch further attacks if Israel continued its offensive in Lebanon. On Sunday, Israel launched a deadly strike on Beirut during clashes with Iranian-backed Hezbollah. Any sign of escalating tensions in the Middle East could boost the dollar's safe-haven status and put pressure on the major currency pair. On the other hand, the European Central Bank's hawkish stance may provide some support for the euro. A Reuters poll of economists suggests the European Central Bank may raise its deposit rate to 2.25% at its upcoming June policy meeting and could potentially raise rates again in September.
From a technical perspective, the euro/dollar exchange rate is holding steady above the 1.1500 level. Furthermore, the Relative Strength Index (RSI) is around 34, and the Moving Average Convergence Divergence (MACD) indicator is slightly positive, suggesting improved momentum. This, in turn, supports further intraday appreciation. Therefore, any subsequent gains are more likely to encounter immediate resistance near the 38.2% Fibonacci retracement level, around the 1.1675-1.1680 area. Next is the confluence point at 1.1710. This area should limit short-term bias, and a break above it could see the euro/dollar exchange rate target the 61.8% retracement level around 1.1740. On the downside, immediate support lies at the psychological level of 1.1500, with deeper support at the Fibonacci anchor around 1.1443 (the low of March 30th). A break below this level would trigger a broader bearish phase.
Today, consider going long on the Euro at 1.1520, with a stop-loss at 1.1510 and targets at 1.1570 and 1.1580.
Stock Analysis:
Australian ASX 200 Stock Index
Basic Market Overview:
The Australian ASX 200 index fell 61 points, or 0.7%, to close at 8,625 on Friday, marking its second consecutive day of declines as waning hopes for a US-Iran peace deal weighed on market sentiment. Meanwhile, US stock index futures weakened as investors cautiously awaited May employment data for clues about the labor market and Federal Reserve policy. The local market slipped 1.2% this week, its first decline in three weeks and its worst performance in nearly a month, as markets remained cautious ahead of the Reserve Bank's policy decision later this month. Non-energy mining led the decline, followed by energy, financials, and consumer goods. Despite firm gold prices, gold stocks fell 1.9%, with Evolution Mining down 3.0%. Lynas Rare Earths fell 2.9% after announcing that veteran Pol Le Roux would serve as interim CEO on June 30th. Shares of the four major banks fell between 1.1% and 1.6%. Energy stocks also fell after recent gains, as oil prices retreated. Conversely, Megaport surged 11.3% after trading resumed, announcing four AI infrastructure contracts and plans to build an inference cloud.
BHP Billiton and Rio Tinto fell 3.2% and 3.7% respectively, their lowest points since mid-May, after hitting record highs the previous day. Technology stocks followed the Nasdaq's weakness, with WiseTech down 5% and Xero down 3%. However, energy stocks bucked the trend, driven by rising oil prices, pushing Woodside Energy up 0.3% and Santos up 0.8%.
Sector Performance:
Leading Gains:
1. Energy (+2.12%, strongest for the week)
Driven by: Tensions in the Middle East, WTI crude oil holding above $95, benefiting oil and gas production and refining sectors, with the sector closing higher for the seventh consecutive week.
Strong Performers
• Woodside Energy (WDS): Weekly +3.45%, leading Australian LNG producer, rising oil prices boosting long-term revenue expectations.
• Santos (STO): Weekly +3.18%, leading Australian oil and gas company.
• Ampol (ALD): Weekly +4.10%, leading refined oil retailer, rising oil prices driving up refining margins.
2. Utilities (+1.35%, defensive and safe-haven)
Safe-haven funds are flocking to high-dividend utilities, with utilities having a pricing advantage amid high inflation.
• APA Group (APA): Weekly +2.7%, leading natural gas pipeline company;
• Origin Energy (ORG): Weekly +2.23%.
3. Healthcare (+0.82%, structural strength)
Biopharmaceutical and medical device stocks are driven by earnings catalysts, highlighting the resilience of blue-chip pharmaceutical stocks.
Star Stocks
• CSL (CSL): Weekly +5.45%, a global plasma giant, with new product launches and institutions raising target prices; the leading stock in the sector this week.
• Telix Pharma (TLX): Weekly +14.24%, a radiopharmaceutical company; clinical data exceeded expectations; one of the top gainers in the market this week.
4. Information Technology (+0.67%, catalyzed by AI and computing power)
Australian local IDC and cloud service providers benefit from the spillover of the global AI industry chain.
• Megaport (MP1): Weekly +15.21%, the top gainer in the ASX200 this week. A cross-border data interconnection service provider, with orders surging due to AI computing power demand.
• NextDC (NXT): Weekly +3.80%, Australia's leading data center provider.
Leading Declines:
1. Energy (+2.12%, strongest performer this week)
Driven by: Tensions in the Middle East, WTI crude oil holding above $95, benefiting oil and gas production and refining sectors. The sector has risen for the 7th consecutive week.
Strong Performers
• Woodside Energy (WDS): Weekly +3.45%, leading Australian LNG producer, rising oil prices boosting long-term revenue expectations.
• Santos (STO): Weekly +3.18%, leading Australian oil and gas company.
• Ampol (ALD): Weekly +4.10%, leading refined oil retailer, rising oil prices driving up refining margins.
2. Utilities (+1.35%, defensive and safe-haven)
Safe-haven funds are flocking to high-dividend utilities, with utilities having a pricing advantage amid high inflation.
• APA Group (APA): Weekly +2.7%, leading natural gas pipeline network provider;
• Origin Energy (ORG): Weekly +2.23%.
3. Healthcare (+0.82%, structurally strong)
Biopharmaceutical and medical device stocks are benefiting from earnings catalysts, highlighting the resilience of blue-chip pharmaceutical stocks.
Star Stocks
• CSL (CSL): Weekly +5.45%, a global plasma giant, with new product launches and institutions raising target prices; the leading stock in the sector this week.
• Telix Pharma (TLX): Weekly +14.24%, a radiotherapy and diagnostic pharmaceutical company; clinical data exceeded expectations; one of the top gainers in the entire market this week.
4. Information Technology (+0.67%, catalyzed by AI and computing power)
Australian local IDC and cloud service providers benefit from the spillover of the global AI industry chain.
• Megaport (MP1): Weekly +15.21%, the top gainer in the ASX200 this week. A cross-border data interconnection service provider, with orders surging due to AI computing power demand.
• NextDC (NXT): Weekly +3.80%, a leading Australian data center provider.
II. Sectors Leading the Decline This Week (Ranked by Weekly Decline)
1. Precious Metals / Raw Materials Mining (-3.27%, weakest for the week)
Gold prices retreated from their highs, and lithium / iron ore prices fluctuated downwards, leading to a collective sell-off in lithium and gold mining stocks.
Leading Declines
• Liontown Resources (LTR): -5.92% (week), Australian lithium mining company, weak lithium prices dragged down valuation.
• Mineral Resources (MIN): -5.16% (week), dual iron ore and lithium mining portfolio, pressured by weaker commodities.
• Genesis Minerals (GMD): -4.46% (week), Western Australian gold mining company, gold price correction dragged down gold prices.
2. Financials (-1.93%, all four major banks weakened)
Market concerns about continued high inflation and the Reserve Bank of Australia's delayed rate cuts led to a continued correction in the interest rate-sensitive banking sector.
• Commonwealth Bank (CBA): -1.72% (week), Westpac (WBC): -2.05% (week), National Australia Bank (NAB): -1.88% (week), weaker expectations for mortgage lending business.
• ASX Limited (ASX): -9.74% (week), a black swan event for the financial sector, with the exchange raising future capital expenditures, leading to a significant increase in costs and triggering a collective downgrade by institutions.
3. Real Estate REITs (-1.61%)
High interest rates continue to suppress real estate valuations, and concerns about office property vacancy rates are intensifying.
• Dexus (DXS): Weekly -4.72%, Australia's leading Grade A office REIT
• Scentre Group (SCG): Weekly -3.21%, shopping mall real estate.
✅ Top 5 Gainers This Week (ASX200 Components)
1. MP1 (Megaport): +15.21% | Computing power data, AI logic
2. TLX (Telix Pharma): +14.24% | Positive news in pharmaceutical clinical trials
3. TUA (Tuas): +9.01% | Orders secured by industrial supporting companies
4. TWE (Treasury Wine Estates): +7.42% | Sales in North American channels exceeded expectations
5. CSL: +5.45% | Plasma leader's earnings revised upwards
❌ Top 5 Losers This Week (ASX200 Components)
1. ASX (ASX): -9.74% | Soaring costs negatively impacted earnings expectations
2. LTR (Liontown Lithium): -5.92% | Declining lithium prices
3. MIN (Mineral Resources): -5.16% | Double whammy from iron ore and lithium
4. DXS (Dexus) Real Estate: -4.72% | Office REITs Under Pressure
5. GMD (Gold Mining): -4.46% | Gold Price Correction Dragging Down Prices
Technical Analysis:
The ASX200 index closed down 1.2% last week at 8,625 points, ending a three-week winning streak and marking its first weekly decline in nearly three weeks. The technical pattern is range-bound (8,600-8,800 points), with a short-term bearish bias, a medium-term neutral stance, and a long-term upward trend. In the short term, since mid-May, it has been in a downward channel, with gradually lower highs and relatively stable lows, forming a converging triangle pattern. The medium-term trend remains neutral to bullish, with the 200-day simple moving average continuing to rise, indicating that the upward trend has not been broken. Furthermore, trading volume increased moderately last week, especially during Friday's decline, indicating increased selling pressure. The RSI (14) technical indicator has fallen from its high to 58.2, remaining in the neutral-to-strong range without showing overbought or oversold signals; the MACD is slightly above the zero line, with the histogram shortening and momentum weakening, posing a risk of a death cross, indicating a weakening short-term trend.
Trading Strategy:
Overall Strategy: Mainly observe and wait for a clear breakout.
The market is currently at a critical juncture, oscillating between the 8,800-point resistance and 8,600-point support, lacking a clear direction. The short-term bias is bearish, but the medium-term trend still has support. It is recommended to adopt a range trading strategy, mainly buying low and selling high, strictly controlling position size (≤30%), and waiting for confirmation of a breakout before increasing position size. Long Strategy:
The index retraces to the 8,550-8,600 range and exhibits one of the following signals:
RSI (14) rebounds after falling below 40; a bullish candlestick pattern appears (e.g., hammer, morning star); trading volume shrinks to below 70% of recent average levels.
Profit Take: First target 8,700 (50-day moving average), second target 8,800 (strong resistance level)
Stop Loss: Below 8,500; stop loss range controlled at 1.5-2%
Short Strategy:
The index rebounds to the 8,750-8,800 range and exhibits one of the following signals:
RSI (14) falls back after rising to 60; a bearish candlestick pattern appears (e.g., evening star, dark cloud cover); trading volume increases but price stagnates.
Profit Take: First target 8,600 (support level); second target 8,550 (strong support level)
Stop Loss: Above 8,850, stop-loss should be controlled at 1.5-2%.
Key Risk Warnings:
Main Risk Factors
1. RBA Policy Expectations: Any hawkish comments before the June 16th meeting could trigger a market correction.
2. Escalation of the Middle East Situation: Could lead to higher oil prices, exacerbating inflationary pressures and affecting global market risk appetite.
3. Chinese Economic Data: Affects Australian resource exports, thus impacting the performance of the ASX200 resource sector.
4. US Non-Farm Payroll Data: Released on June 10th, affecting Fed policy expectations and causing global stock market correlation.
Nikkei 225 Index (JP225)
Basic Market Conditions The Nikkei 225 fell 3.85% to close at 64,024, while the broader Topix index dropped 2.45% to 3,852, marking the third consecutive day of declines for Japanese stocks. This decline reflected a sharp sell-off on Wall Street on Friday, with semiconductors and other technology stocks under significant pressure. Stronger-than-expected U.S. jobs data also reinforced market expectations of a Federal Reserve rate hike this year, pushing up Treasury yields and adding to the pressure on stocks. Meanwhile, escalating geopolitical concerns, with Iran launching several missile salvos at Israel as a warning of further military action in Lebanon, clouded the prospects of the fragile ceasefire agreement, and peace talks remain stalled.
Sector Performance:
Leading Gains: (Gains exceeding 1%)
1. Insurance: Safe-haven inflows
2. Food: Defensive sector performed steadily
3. Retail: Supported by stable domestic demand
Leading Losers: (Gains exceeding 4%)
1. Technology/Semiconductors: SoftBank Group (-9.3%), Kioxia (-8.5%), Tokyo Electron (-6.1%), Advantest (-5.1%) Xinhua News Agency
2. Non-ferrous metals: Affected by commodity price fluctuations
3. Electrical products: Following the decline in technology stocks
Technical Analysis:
The Nikkei 225 fell sharply by 3.85% at the beginning of the week, closing at 64,024.60 points, the second largest single-day drop this year, falling to its lowest level in about two weeks since May 22. The technical picture shows a bearish dominance, but the medium-to-long-term upward trend has not been completely broken. Investors should control their positions, focusing on short selling in the short term, and waiting for stabilization signals before considering long positions in the medium term. Pay close attention to the performance of US stocks, the yen exchange rate, and the policy moves of the Bank of Japan, as these factors will directly affect the subsequent trend of the Nikkei 225. Short-term support levels are at 63,700 and 63,400 points, while resistance levels are at 65,000 and 66,000 points. Technical indicators: RSI (14-bit): Rapidly declining below 40, entering weak market territory, indicating increased oversold risk; MACD: The histogram has turned negative, and the fast and slow lines have formed a death cross, confirming a bearish signal; Trading volume: Increased by approximately 30% compared to the previous trading day, with volume and price moving in tandem, indicating ample downward momentum. Currently, the daily chart shows the index is still within a long-term upward channel, but has touched the lower support level; the candlestick body is nearly 2,000 points long, accompanied by a gap, indicating strong bearish pressure.
Trading Strategies (Primarily Short-Term)
1. Short-Term Strategy (Intraday / 1-3 Days)
• Short Selling: Consider shorting when the index rebounds to the 64,600-65,000 point range, with a stop loss above 65,200 points and a target of 63,700 points. If it breaks below this level, look for 63,400 points.
• Cautious Long Positions: Only attempt a small long position if a clear stabilization signal appears near 63,400 points, with a stop loss below 63,000 points and a target of 64,200 points.
2. Medium-Term Strategy (1-2 Weeks)
• Observation: Wait for market panic to subside and monitor the support level of the 50-day moving average (approximately 62,800 points).
• Phased Long Positions: If the index stabilizes in the 62,800-63,700 point range, consider building a long position in phases, with a target of 66,000 points. Click above
Risk Warning:
Downside Risk: A break below the 50-day EMA support at 62,800 points could trigger a larger correction, targeting the 60,000-point area.
Upside Risk: If US stocks stabilize and rebound, or if the Bank of Japan signals easing, the index could rebound rapidly to 66,000 points.
Disclaimer: The information contained herein (1) is proprietary to BCR and/or its content providers; (2) may not be copied or distributed; (3) is not warranted to be accurate, complete or timely; and, (4) does not constitute advice or a recommendation by BCR or its content providers in respect of the investment in financial instruments. Neither BCR or its content providers are responsible for any damages or losses arising from any use of this information. Past performance is no guarantee of future results.
Lebih Liputan


Pendedahan Risiko:Instrumen derivatif diniagakan di luar bursa dengan margin, yang bermakna ia membawa tahap risiko yang tinggi dan terdapat kemungkinan anda boleh kehilangan seluruh pelaburan anda. Produk-produk ini tidak sesuai untuk semua pelabur. Pastikan anda memahami sepenuhnya risiko dan pertimbangkan dengan teliti keadaan kewangan dan pengalaman dagangan anda sebelum berdagang. Cari nasihat kewangan bebas jika perlu sebelum membuka akaun dengan BCR.
BCR Co Pty Ltd (No. Syarikat 1975046) ialah syarikat yang diperbadankan di bawah undang-undang British Virgin Islands, dengan pejabat berdaftar di Trident Chambers, Wickham’s Cay 1, Road Town, Tortola, British Virgin Islands, dan dilesenkan serta dikawal selia oleh Suruhanjaya Perkhidmatan Kewangan British Virgin Islands di bawah Lesen No. SIBA/L/19/1122.
Open Bridge Limited (No. Syarikat 16701394) ialah syarikat yang diperbadankan di bawah Akta Syarikat 2006 dan berdaftar di England dan Wales, dengan alamat berdaftar di Kemp House, 160 City Road, London, England, EC1V 2NX. Open Bridge Limited bertindak semata-mata sebagai pemproses pembayaran untuk BCR Co Pty Ltd dan tidak menyediakan sebarang perkhidmatan kewangan, perdagangan atau pelaburan bagi pihaknya. Peranan Open Bridge Limited adalah terhad kepada pemprosesan pembayaran.

 English
 简体中文
简体中文
 繁體中文
繁體中文
 Bahasa
Melayu
Bahasa
Melayu
 Tiếng
Việt
Tiếng
Việt
 ไทย
ไทย
 日本語
日本語
 한국어
한국어
 ភាសាខ្មែរ
 español