


0
US Dollar Index
The US dollar index, which measures the value of the greenback against a basket of six currencies, stabilized after falling to a five-month low of 103.20. Traders reacted to a major fiscal expansion in Germany while monitoring geopolitical risks associated with the ongoing negotiations between US President Donald Trump and Russian President Vladimir Putin. The index rebounded slightly from earlier losses as sentiment shifted. US data continued to trouble the dollar, which fell against all G10 currencies except the yen at the start of the week. The Federal Reserve—which will announce interest rates mid-week—does not seem to be in a position to provide much relief to risk sentiment as rising inflation expectations still require caution about rate cuts. Further downside risks for the dollar could stem from Trump's phone call with Vladimir Putin regarding Ukraine. Any progress towards Russia accepting a ceasefire plan proposed by the United States and Ukraine could put additional pressure on the safe-haven dollar and yen. The dollar index could continue to fall below the levels seen before last year's presidential election.
Since the US dollar index fell below 104.00 at the beginning of this month, it has been struggling below 104. However, momentum indicators such as the 14-day relative strength index (RSI) and the moving average convergence/divergence (MACD) on the daily chart show oversold conditions, and a temporary rebound may occur. The key initial resistance is at 103.78 and 104.00 (the main rising resistance level in the past two weeks). If the US dollar successfully breaks through the latter, it is expected to challenge the 14-day moving average of 104.62 and even the recent high of 105.00. The immediate support level is around 103.20 (March 18 low). Despite some signs of stabilization, the overall sentiment remains fragile amid ongoing geopolitical and economic uncertainties, and further downward testing of 103.00 (market psychological level) is the first support point, and then the lower line of the Bollinger Band near 102.81 will become a key support.
Consider shorting the US dollar index near 103.38 today, stop loss: 103.50, target: 103.00, 102.90

WTI spot crude oil
Oil prices fell on Tuesday as concerns about global crude oil oversupply intensified. Meanwhile, U.S. stocks weakened and investors remained cautious ahead of the Federal Reserve's upcoming monetary policy meeting, which is expected to provide more clues about the impact of the trade war on the economy. WTI crude oil rose in early European trading on Tuesday and traded near a three-week high of $68.50, up from Monday's close of $67.26. WTI prices extended their upward momentum as the United States vowed to continue its attacks on the Houthis. Unrest in the Red Sea led to higher energy transportation prices and WTI prices as oil and gas cargo transportation was forced to take longer routes. A series of positive Chinese economic data and special plans made by Chinese officials to stimulate domestic consumption also drove WTI's gains. On the other hand, the escalation of the global trade war and the bleak economic outlook caused by Trump's protectionist trade policies may exert some selling pressure on black gold. Trump's aggressive tariffs on imported goods are expected to raise corporate costs, drive inflation, and weaken consumer confidence, thus dealing a blow to economic growth.
Crude oil prices have fallen from the high of $79.37 at the beginning of this year and encountered support at the 65.00 level at the beginning of this month and rebounded slightly (down about 18%) to the resistance level near 68.50, testing the resistance of the descending trend line. If buyers push prices above 68.10 (Monday's high) and $68.45 (21-day moving average) area with the support of the bullish golden cross pattern on the moving average convergence divergence indicator (MACD), then this will negate the recent decline and put the psychological price of 70.00 in focus. If the price breaks above this level, a higher high will be formed. If the resistance range of $68.10-68.45 cannot be recaptured, sellers may test the support at $66.11 (March 13 low) and $65.00 (this year's low). If the price falls below this support, it will form a lower low and put the 2023 low of $63.65 in focus.
Today, consider going long on crude oil around 66.35, stop loss: 66.20; target: 67.60; 67.80

Spot gold
On Tuesday, the price of gold rose by more than 1%, hitting a new high and breaking through the $3,000/ounce mark. The market believes that this is because Trump's tariff plan, as well as the increasing tensions and trade uncertainties in the Middle East, have stimulated the demand for safe-haven assets. The price of gold has soared again, currently reaching a record high of $3,038.50 on Tuesday. The rise came after Israel carried out military operations against Hamas tactical positions and buildings. Driven by continued trade tariff uncertainty and strong safe-haven demand amid geopolitical tensions. Trade war concerns also weighed on investor sentiment as new tariff threats were exchanged between the United States and major trading partners. Gold demand remained strong, supported by continued purchases by exchange-traded funds (ETFs) and central banks, especially China, which has increased its gold purchases for the fourth consecutive month. Investors will now turn their attention to the upcoming central bank policy meetings, especially the decision of the US Federal Reserve later this week. The Fed is widely expected to keep interest rates unchanged amid rising trade tensions and economic concerns, with the market only expecting two rate cuts this year.
Gold traders have multiple reasons and arguments to push gold higher. As the market begins to predict $3,200, this sets a clear target for the coming weeks and months. However, traders need to remember that once the market is positioned in one direction, that is when a reversal can occur. Tuesday European session, Gold prices hit a new all-time high of $3,038.50 after hitting a new high of $2,305 last Friday, but the 14-day relative strength index (RSI), a technical indicator on the daily chart, is already in the overbought area (highest at 71.65), opening the door for a pullback. It should be noted that when gold prices were rising, the RSI failed to hit a new high, showing a negative divergence. However, if gold prices break through the latest all-time high of $3,028.50, the next resistance will be new all-time highs in areas such as $3,032.70 (161.80% Fibonacci retracement level from 2956.30 to 2832.70), and $3,054.00 (178.6% Fibonacci retracement level). On the contrary, if the daily close is below the psychological barrier of $3,000, a pullback to $2,987.00 (5-day moving average) is possible, and $2,982 (early week low) support areas. A breakout points to the daily high of $2,954 on February 20.
Consider going long on gold before 3,030 today, stop loss: 3,025; target: 3,050.00; 3.054.00

AUD/USD
AUD/USD's rebound stalled around 0.6380 as cautious sentiment took over. The pair lost momentum on Tuesday after initially benefiting from renewed optimism surrounding the Chinese economy. The Australian dollar was supported by Beijing's special action plan. However, investors turned to a cautious stance ahead of the Federal Reserve's monetary policy decision on Wednesday. Reserve Bank of Australia Assistant Governor (Economics) Sarah Hunt said on Monday evening that the central bank will adopt a cautious rate cut strategy. The February statement indicated that the RBA board was more conservative than the market expected in terms of further easing. Hunt also emphasized monitoring of US policy decisions and their impact on Australian inflation. The Australian dollar could come under pressure as U.S. President Donald Trump reiterated plans to implement reciprocal and industry tariffs on April 2. From a technical perspective, strong momentum in recent weeks suggests that the Australian dollar could test above $0.6400; it is unclear whether it can definitively break above this level.
AUD/USD started the week with gains, posting its best performance in more than a week to reach the 0.6390 area. The pair gained momentum and broke through key levels as technical indicators turned clearly bullish. The Moving Average Convergence/Divergence (MACD) indicator showed a new green bar, signaling renewed upward pressure. Meanwhile, the 140 Relative Strength Index (RSI) climbed above 63, entering strong bullish territory, confirming rising buying interest. AUD/USD has broken above the 20-day and 100-day simple moving averages, further solidifying the positive outlook. If the upward momentum continues, the next resistance is around 0.6409 (February 21 high), 0.6471 (December 9 high last year), while initial support can be seen at 0.6345 (100-day simple moving average) on a pullback, and the next level is the psychological level of 0.6300.
Today, consider going long on AUD before 0.6350, stop loss: 0.6335; target: 0.6390; 0.6400.

GBP/USD
The British pound retreated against the US dollar during the North American session, having hit a four-and-a-half-month high of 1.3009 before paring earlier gains. The British pound rose slightly against major currencies as investors awaited the monetary policy decisions of the Federal Reserve and the Bank of England, which will be released on Wednesday and Thursday respectively. The Federal Reserve and the Bank of England are expected to keep interest rates unchanged. This will be the second consecutive policy meeting where the central banks have kept interest rates unchanged. Investors are focused on the Bank of England's interest rate decision on Thursday. Traders are increasingly confident that the borrowing rate will remain unchanged at 4.5%, with a vote of 7-2. The Bank of England's Monetary Policy Committee is expected to support a rate cut. Investors will also focus on the BoE's guidance on monetary policy and the impact that the tariff war led by US President Trump may have on the UK's economic outlook. Traders expect the BoE to cut interest rates two more times this year as the central bank lowered its GDP growth forecast to 0.75% at its February policy meeting.
The British pound rose in the early session of the week, and the exchange rate action suggests that GBP/USD may test the 1.3000 level in the short term. The long-term outlook for GBP/USD remains bullish as it remains above its 200-day moving average of about 1.2795. While the 14-day relative strength index (RSI) on the daily chart remains above 65.00, indicating that strong bullish momentum remains. The price action of the currency pair suggests that GBP/USD may test the psychological market barrier of 1.3000 in the short term. If the bulls break through 1.3000, they will be expected to challenge the high of 1.3048 on November 6, followed by 1.3100. On the contrary, if GBP/USD encounters resistance at 1.3000, the currency pair may fall to the daily low of 1.2911 on March 17, followed by the low of 1.2861 on March 10. Further, it will re-test the 200-day moving average level of 1.2795.
Today, it is recommended to go long on GBP before 1.2988, stop loss: 1.2975, target: 1.3040, 1.3050

USD/JPY
USD/JPY rose for the second consecutive day, breaking through 149.00 in the European session on Tuesday, reaching a nearly three-week high of 149.90, after mixed US economic data and good retail sales data. Earlier this week, White House officials confirmed that US President Trump will talk to Russian leader Vladimir Putin about peace in Ukraine. Last week, Ukraine agreed to a 30-day ceasefire plan after talks with US officials in Saudi Arabia. Ending the three-year-long war in Ukraine. Such a situation will be positive for global economic growth. On the domestic front, the main triggers for the yen are the Bank of Japan's monetary policy decision and the country's Consumer Price Index (CPI) data for February, which are scheduled to be released on Wednesday and Friday, respectively. Although investors supported the dollar against the yen, the dollar underperformed among other currencies due to concerns that President Trump's tariff agenda will slow economic growth.
The USD/JPY pair has a downside bias despite rebounding after hitting lows near 146.50 in early March. This fueled a rebound of about 280 pips, which was capped by the dynamic resistance of the turning line at 149.00. Although the latter has been breached, buyers have been unable to conquer the next key resistance level, which is 150.00 (a psychological mark in the market). A daily close above 149.50 could push the USD/JPY pair towards the 150.00 level, followed by the 150.67 base line. On the other hand, if USD/JPY struggles at 150.00, the first support is 148.70 (14-day moving average). In case of further weakness, sellers may push the exchange rate to the turning line of 148.36, followed by the round mark of 148.00, and then the low of March 13, 147.41.
Today, it is recommended to short the US dollar before 149.50, stop loss: 149.70; target: 148.40, 145.30

EUR/USD
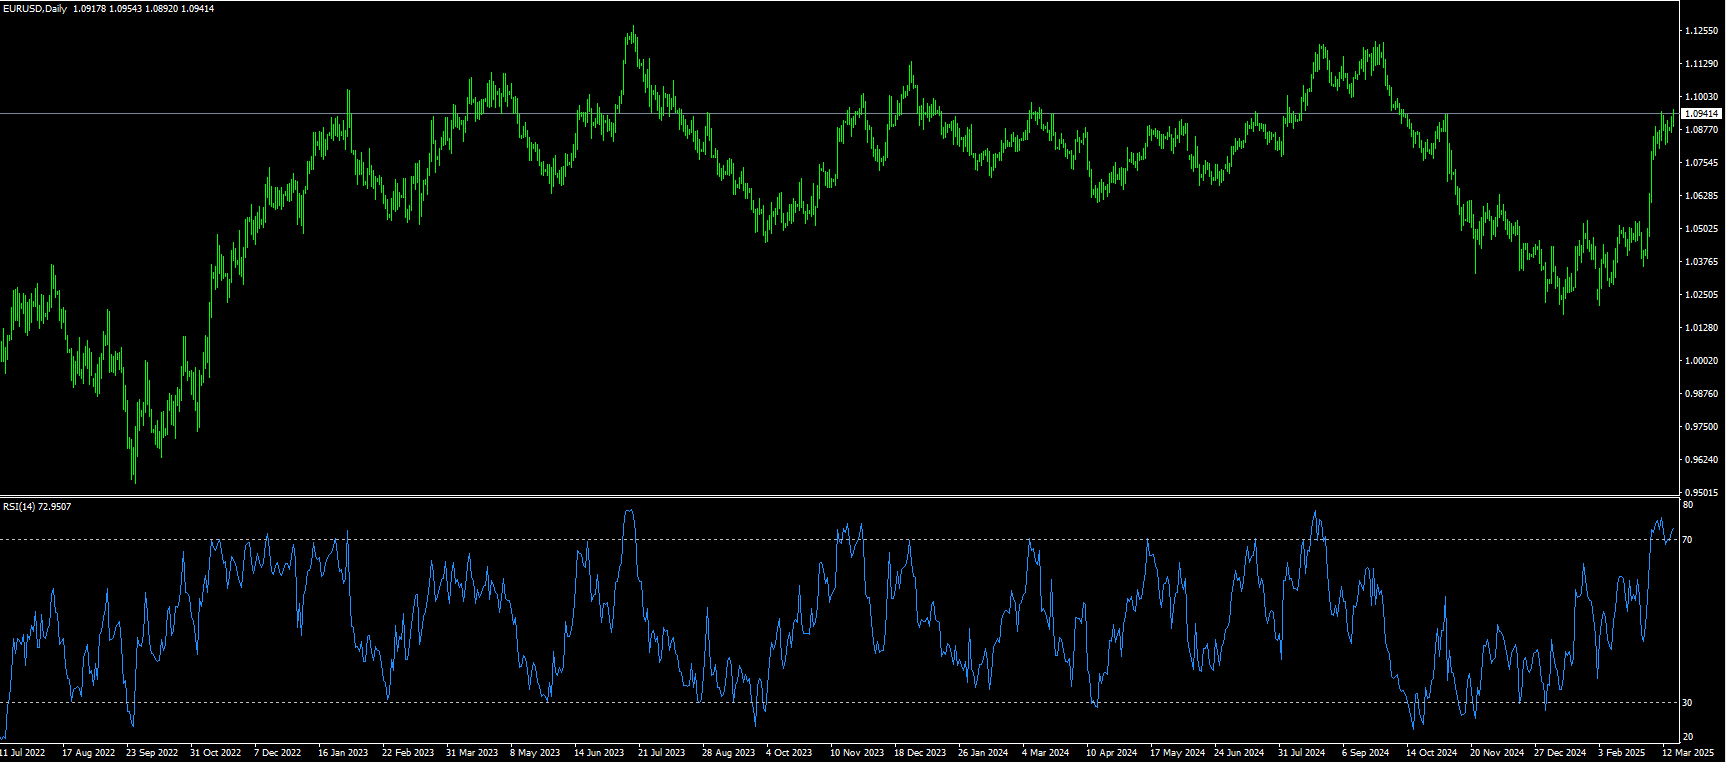
EUR/USD rose to a fresh multi-month high of 1.0955 in response to further weakness in the US dollar. Final inflation rates, labor cost index and wage growth for the eurozone are all due to be released. In addition, ECB's De Guindos and Elderson are also expected to speak. EUR/USD hit a five-month high near 1.0955 during Tuesday's European trading session as the German debt restructuring deal will be voted on in the Bundestag. Market participants expect that a significant increase in Germany's borrowing limits will accelerate economic growth and inflation. This scenario is positive for the euro as Germany is the locomotive of the eurozone. The positive impact of Germany's debt increase plan has been seen in the euro, which has performed strongly in the past few weeks. The escalation of the trade war with US President Trump imposing further tariffs on EU goods has put pressure on the euro. However, a weaker US dollar may limit the downside for this major currency pair due to concerns about a slowdown in the US economy and hopes for a German fiscal deal.
EUR/USD extended its gains during Tuesday's European session, climbing to a fresh five-month high of 1.0955 as bulls returned after a brief correction phase. The 14-day relative strength index (RSI) of the daily chart has returned to overbought levels (71.35), indicating strong buying interest, but the moving average convergence divergence (MACD) shows a weak green bar, suggesting that bullish momentum may be fading. This mixed signal leaves room for sideways trading or a potential pullback if buyers fail to maintain the upward momentum. From a technical perspective, initial resistance is located near 1.0955 (Tuesday's high), and a break above this level may open the door for further gains, targeting the 1.1000 psychological level), as well as the 1.1050 area level. On the downside, initial support is located at 1.0872 (9-day moving average), followed by a stronger support at 1.0822 (March 13 low).
Today, it is recommended to go long on the euro before 1.0930, stop loss: 1.0920, target: 1.0980, 1.0990.
Disclaimer: The information contained herein (1) is proprietary to BCR and/or its content providers; (2) may not be copied or distributed; (3) is not warranted to be accurate, complete or timely; and, (4) does not constitute advice or a recommendation by BCR or its content providers in respect of the investment in financial instruments. Neither BCR or its content providers are responsible for any damages or losses arising from any use of this information. Past performance is no guarantee of future results.
More Coverage


Risk Disclosure:Derivatives are traded over-the-counter on margin, which means they carry a high level of risk and there is a possibility you could lose all of your investment. These products are not suitable for all investors. Please ensure you fully understand the risks and carefully consider your financial situation and trading experience before trading. Seek independent financial advice if necessary before opening an account with BCR.

 English
 简体中文
简体中文
 繁體中文
繁體中文
 Bahasa
Melayu
Bahasa
Melayu
 Tiếng
Việt
Tiếng
Việt
 ไทย
ไทย
 日本語
日本語
 한국어
한국어
 ភាសាខ្មែរ
 español