


0
US Dollar Index
Before the weekend, the US Dollar Index rose and traded close to the 103 area after the release of a stronger-than-expected non-farm payrolls report. The momentum of the dollar was also affected by the comments of Federal Reserve Chairman Jerome Powell, who pointed out that the inflation risk from tariffs was higher than expected, while emphasizing the wait-and-see attitude of the Federal Reserve. Technically, despite the rebound, the US Dollar Index is still in a bearish structure. Earlier last week, the US Dollar Index fell sharply, reaching a six-month low of 101.27. The US dollar continued to decline as investors' concerns about slowing economic activity increased due to the announcement of "Liberation Day" tariffs by US President Trump. The performance of the US Dollar Index in the middle of last week is being hit hard and almost hit the floor. US President Trump triggered the "atomic bomb" of tariffs on Wednesday, and the implementation of reciprocal tariffs hit the US dollar hard. The swing of the US Dollar Index is strong on the left and weak on the right. The left side is the strength of the US dollar for many years, which is regarded as the market standard. However, since the beginning of March, the swing of the US Dollar Index has changed due to the German defense budget spending bill and the inauguration of US President Trump. Once the impact of tariffs on the US economy begins to be felt, the weakness of the US dollar may intensify. As concerns about stagflation and recession grow, the US dollar index could easily fall below 100.00 later this year.
In terms of recent technical trends, the US dollar index fell to a nearly six-month low of 101.27 last week. It rebounded slightly over the weekend, but the bearish tone remains and is currently hovering just below the psychological level of 103. The technical indicator Moving Average Convergence/Divergence (MACD) on the daily chart continues to send a sell signal, although the 14-day relative strength index (RSI) reading of 37.52 is within the negative territory, reflecting fragile bullish momentum. The 30-day; and 200-day simple moving averages, as well as the 10-day exponential moving average (EMA) all point to a bearish trend. The final oscillator and stochastic %K are also neutral, confirming indecision. Due to the sharp decline late last week, some support levels have turned into resistance levels. The first level to watch is Friday's high of 103.18, which has been acting as support throughout March and has now turned into resistance. After that, the upper side is 103.37 {23.6% Fibonacci rebound level from 110.18 to 101.27}, while the key levels are at 104.00 and 104.50 {upper track of the downward channel on the daily chart}. On the downside, since the 30-day and 200-day moving averages formed a "death cross" bearish pattern last week, the first line of defense on the downside is 102.40 {the central axis of the downward channel}. If it falls below the 102.00 integer mark in the next few days, it may lead to a further decline to 101.27 {last week's low), and the 101.00 mark level.
Today, you can consider going long on the US dollar index around 102.75, stop loss: 102.60, target: 103.30, 103.50

WTI spot crude oil
On Thursday (March 27), international oil prices rose slightly as market participants were evaluating the impact of tightening global crude oil supply and the latest US tariffs on the global economy and energy demand. WTI crude oil suffered a heavy blow last week as the reciprocal tariffs announced by US President Trump triggered global economic risks. Oil prices fell 9.79% for the week, the lowest weekly drop since March 2022, with a low of $60.26, after Trump announced the reciprocal tariff plan. Financial market participants expect that Trump's new round of tariffs will force global business owners to postpone new investment plans due to uncertainty about how global markets will develop after the tariffs are implemented. This situation is not good for the outlook for oil demand and will eventually put pressure on its prices. In addition, concerns about possible countermeasures from the United States over Trump's accusations of shaking up global markets by announcing tariffs beyond expectations could further depress oil prices. During the European trading session, China threatened to impose an additional tariff of 34% on all US imports in retaliation for the reciprocal tariffs announced by Trump on Wednesday. Considering that China is the world's largest oil importer, a potential trade war between the United States and China will be negative for oil prices. Meanwhile, IMF Managing Director Kristalina Georgieva called on the United States and its trading partners on Thursday to actively cooperate to "resolve trade tensions and reduce uncertainty." She warned that the higher import tariffs announced by Trump clearly pose a "significant risk" to the global outlook at a time of weak economic growth.
From the technical trend of WTI crude oil after plummeting to the April 2021 low of $60.26 before the end of last week, the commodity now seems to have begun to target the key psychological support level of $60.00. The market chooses to be bearish on commodity prices. Currently, the 14-month RSI indicator, one of the technical indicators of the monthly chart, is at 38.95, which means that market sentiment is bearish. For the bearish outlook to continue, oil prices need to break through and hold below the support level of $65.00 (March low) {now changed to resistance}, and the next possible target for bears is $61.65 (78.6% Fibonacci retracement of 44.00 to 126.51). On the other hand, for the bullish outlook, WTI crude oil prices need to break through the support line of 64.05 (low since December 2021) clearly. A breakout points to $60.26 {last Friday's low}, and $60.00 {market psychological level}, and towards the $57.66 {April 2021 low} level. If oil prices rise instead of falling this week, the first target price can be $63.47 {76.4% Fibonacci retracement}, the next level is $65.00 {March low}, and after breaking through, it will point to $66.58 {last Friday's high} level.
Today, you can consider going long on crude oil near 62.30, stop loss: 62.50; target: 61.00; 60.80

Spot gold
Last week, gold prices fluctuated widely. In the early part of last week, due to the safe-haven buying driven by Trump's tariff policy, gold prices once refreshed the historical high to $3,167.60/ounce, but then the bulls took the opportunity to take profits. Gold prices once fell by more than $150 to around $3,016.00/ounce, and then received support from bargain hunting. The poor performance of US economic data and the sharp drop in US stocks also provided support for gold prices, helping gold prices to rise above the 3,100 mark. The tariffs announced on Wednesday caused a plunge in global markets and drew condemnation from other leaders who believed that the decades-long era of trade liberalization had ended. The US stock market benchmark index plunged on Thursday, recording the largest single-day percentage drop since 2020. Gold also fell as other asset classes saw some profit-taking and margin calls, which may have prompted investors to sell some of their gold holdings to cover losses. However, the overall trend of gold seems to remain unchanged, and the safe haven has soared by more than $500 so far this year. Due to the risks brought by Trump's policies, central banks are expected to further diversify their dollar reserves by buying gold, which will help gold maintain its gains this year.
From the daily chart, although the price of gold fell from a new historical high of $3,167.60 to $3,054.10 and then rebounded to around $3,100. However, it fell sharply again to $3,016, a near one-week low, at the end of last week. The 14-day relative strength index (RSI) indicator of technical indicators fell back to around 54.25, but it is still in the positive area. In addition, the MACD indicator remains above the zero axis, the DIFF and DEA lines run parallel, and the histogram shrinks slightly but is still positive, indicating that the medium-term uptrend has not ended. This shows that the medium-term uptrend is still intact. Gold prices have formed clear short-term support around $3,005.10 (25-day single moving average) and $3,000.00 (market psychological barrier), which will be the key position of the bulls' defense line. If gold prices fall below the above support levels this week, they may fall further to $2,981.70 (34-day single moving average), and the next support level is $2,933 (March 13 low). On the other hand, if gold prices can hold the $3,000 (market psychological barrier) support level and stand firm above $3,014 (lower track of the daily upward channel) and 3.016 (last Friday's low), they may re-challenge the $3054 (last Thursday's low) resistance level, and after breaking through, they will re-test the $3,070 (upper track of the daily upward channel) level.
Consider going long on gold before 3,030 today, stop loss: 3,025; target: 3,055.00; 3.060.00

AUD/USD
AUD/USD once broke below the key psychological 0.60 support in the US session before the weekend, sliding towards the 0.5986 area, hitting a five-year low and the lowest single-day drop in nearly a decade (-4.52%). It rebounded to around 0.6040 before closing. It became the worst performing exchange rate among G7 currencies last week. This sharp drop came after the stronger-than-expected US non-farm payrolls report, further boosting the dollar's gains. However, the main catalyst for the Australian dollar's collapse stemmed from a new round of US tariffs announced by President Trump, which raised concerns about global economic growth and sparked market speculation that the Reserve Bank of Australia may take a series of aggressive interest rate cuts this year. US President Trump announced a reciprocal tariff of at least 10% on all imported goods, of which China faces a 54% tariff. In response, China's Ministry of Commerce said it would resolutely take countermeasures to safeguard its rights and interests. This, in turn, raises the risk of further escalation in the trade war between the world's two largest economies, becoming a key factor in weakening the Australian dollar, which is proxied by China. Meanwhile, global stock markets are generally in the red. This, combined with speculation that a tariff-driven economic slowdown could force the Reserve Bank of Australia to cut interest rates as many as four times by 2025, has further prompted capital outflows from the Australian dollar, which is seen as riskier.
The sharpest single-day drop in nearly a decade from last Friday's sharp setback (-4.52%) has left the AUD/USD deeply in bearish territory, with the pair moving towards the lower end of the intraday range and breaking through an important multi-year support area. The technical indicator Moving Average Convergence Divergence (MACD) on the daily chart continues to show new red bars, reinforcing the downward momentum, while the 14-day Relative Strength Index (RSI) has fallen to the 29.40 area, confirming oversold conditions. Although the Stochastic Oscillator looks neutral, the continued sell-off is further validated by the bearish/bullish strength indicator flashing red and the clear divergence between the moving averages. All short-term and long-term moving averages, 10-day EMA, and 20-day; 100-day; 200-day SMA continue to point downward, emphasizing the current downtrend. Showing a weak signal for the currency pair. The key support below 0.6000 {market psychological barrier}, and 0.5986 (last week's low) constitute a double support. If the bears further increase the selling pressure, it may trigger a technical sell-off to 0.5870 (March 26, 2020 low) level. On the contrary, if AUD/USD can re-break through 0.6087 {February 3 low}, and 0.6089 {76.4% Fibonacci retracement level of 0.5509 to 0.7968} area, and stand above its exchange rate, it may challenge the double resistance levels of 0.6200 (round mark) and 0.6187 (March 4 low) in the short term. A breakout points to 0.6264 (9-day SMA). Opens the door to retest the 75-day SMA of 0.6272, and 0.6257 (April 2 low).
Consider shorting the AUD before 0.6065 today, stop loss: 0.6085; target: 0.5980; 0.5960.

GBP/USD
GBP/USD fell sharply against the US dollar late last week, with a drop of more than 1.63% on Friday, the biggest one-day drop since December 15, 2022. Risk appetite deteriorated as China announced tariffs on US products. It closed at 1.2886 before the weekend, having hit an intraday low of 1.2853, a one-month low. Earlier, China announced that it would impose a 34% tariff on all US products in retaliation for Trump's decision. The pound fell as it is the most volatile currency among the G10 currencies. GBP/USD broke through the 1.3200 mark for the first time at the beginning of last week, climbing to a seven-month high as the US dollar underperformed on all fronts. The UK economic data release schedule was relatively sparse last week, but the US ISM Services Purchasing Managers' Index (PMI) data for March further dampened investor sentiment, falling to a nine-month low of 50.8. However, strong US non-farm payrolls data provided support to the US dollar, pushing the currency pair lower. US President Trump approved a 10% tariff on all imported goods, which will take effect from April 5, and the calculated "reciprocal" tariffs will begin on April 9. Fitch Ratings has warned that the impact of Trump's tariffs will also affect the Federal Reserve, which may delay interest rate cuts as the Fed will monitor the impact of these tariffs on inflation and employment.
GBP/USD pushed up to 1.3207 at the beginning of last week, the highest since September last year. However, GBP bulls encountered strong technical resistance at the psychological level of 1.3200, falling below 1.3000 (market psychological level), and 1.2950 (9-day simple moving average) to a near one-month low of 1.2853 before the weekend, giving up the gains of the whole week. The currency pair continues to trade below the 9-day simple moving average. Indicating that the short-term outlook may turn to a downside. The 14-day relative strength index (RSI) of the daily chart technical indicator has plummeted to around 50.00, indicating that the bullish momentum has weakened. Therefore, on the upside, 1.2950 (9-day simple moving average) and 1.3000 (market psychological level) have become key resistance areas this week. On the other hand, since the 34-day and 200-day simple moving averages formed a bullish "golden cross" pattern last week, the next target is 1.3090 (the central axis of the upward channel). If GBP/USD falls instead of rising, it will test 1.2812 (200-day simple moving average) and 1.2800 (market psychological barrier). If it breaks, it will further point to 1.2767 (March 5 low).
Today, it is recommended to short GBP before 1.2900, stop loss: 1.2920, target: 1.2800, 1.2790

USD/JPY
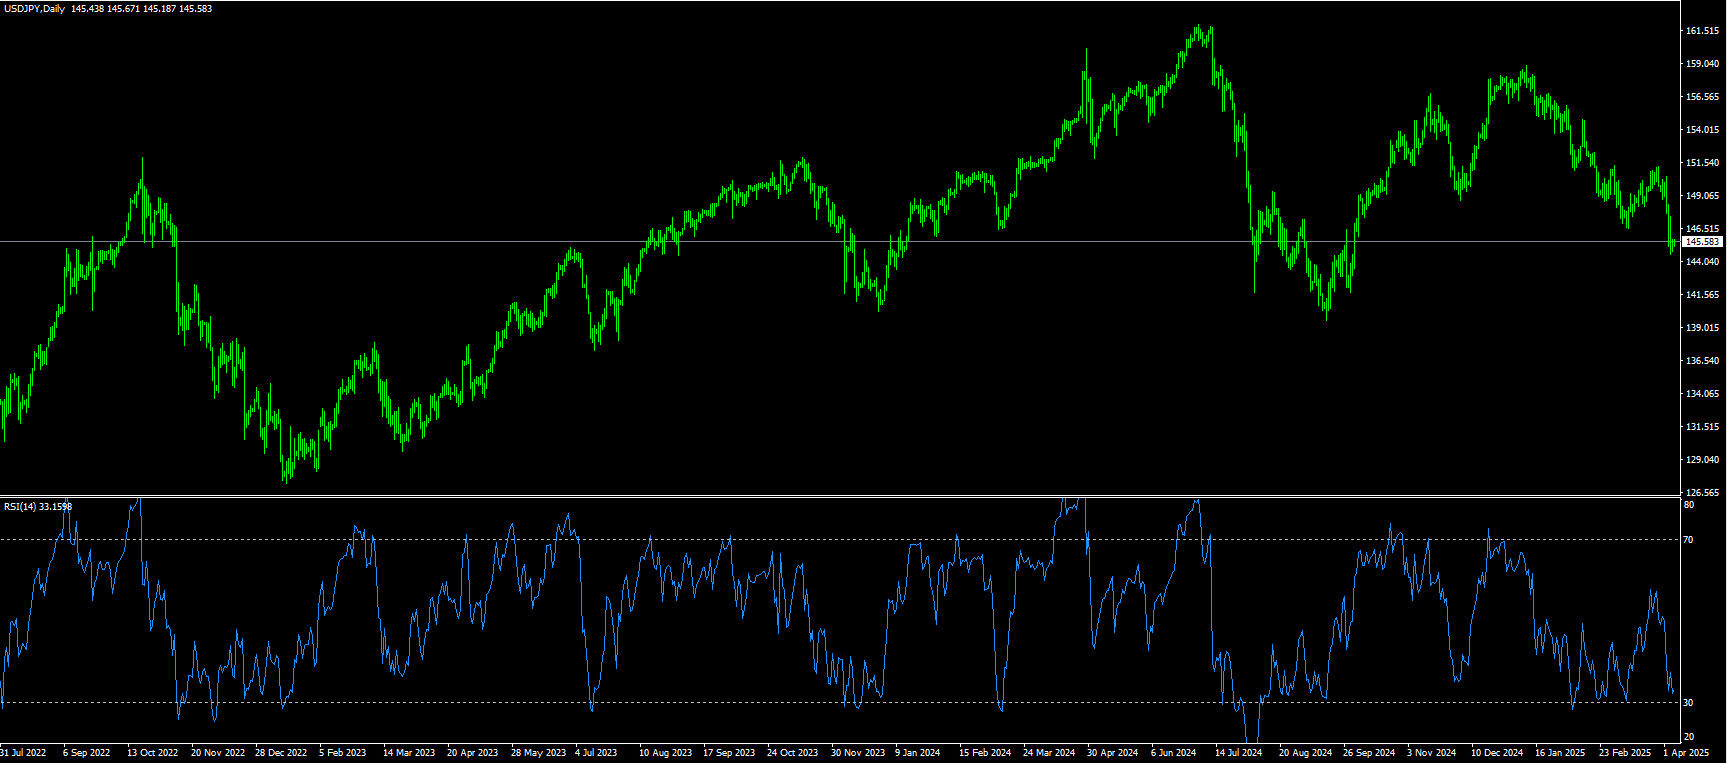
USD/JPY rebounded slightly to close around 146.99 after falling to 144.55, the lowest since October last year, last week. Fears of a full-blown trade war that could trigger a global recession continue to weigh on investor sentiment. This was evident in the broad-based decline in global equities, supporting the safe-haven yen. Moreover, as signs of inflation in Japan widen, expectations for further rate hikes by the Bank of Japan in 2025 have strengthened, becoming another positive factor for the yen. Conversely, the dollar has retained its bearish bias amid market bets that the Federal Reserve will soon resume its rate-cutting cycle, which is particularly evident in the tariff-driven slowdown in the United States. This, in turn, has acted as a headwind for USD/JPY. Meanwhile, investors are concerned about the possible economic impact of the broad trade tariffs announced by U.S. President Trump late last Wednesday. This could force the Bank of Japan to keep its policy rate unchanged for now, thus discouraging new bets by yen bulls.
From a technical perspective, the break below the previous yearly low of 146.55-146.50 area late last week is seen as a new trigger for USD/JPY shorts. Moreover, the 14-day relative strength index (RSI) on the daily chart is stuck in negative territory (latest at 37.00). This suggests that the path of least resistance for the spot price remains to the downside and supports the prospect of further depreciation. Therefore, the possibility of a subsequent break below Thursday’s swing lows in the 145.20-145.15 area towards the 145.00 mark and the next relevant support in the 144.55-144.45 area looks quite obvious. A break below this level would test the 143.71 (78.6% Fibonacci retracement of 139.58 to 158.88), and the 143 psychological market level. On the other hand, any attempt to rally above the 147.00 round-number mark, and 146.95 (61.8% Fibonacci retracement) is likely to attract new sellers and be limited around the 148.00 resistance level. However, a sustained strong breakout above the latter could trigger a short-term covering rally, pushing the pair to the intermediate resistance of 148.60. A decisive breakout would pave the way for further gains to the 149.00 mark.
Today, it is recommended to go long on the dollar before 146.80, stop loss: 146.50; target: 147.80, 148.00
EUR/USD
The recovery of the US dollar has regained additional momentum, allowing the US dollar index to rebound above 103 at one point and lowering the euro/dollar to the daily low area around 1.0900 before the weekend. EUR/USD hit a six-month high of 1.1147 at the beginning of last week. On Wednesday, US President Trump announced global tariffs of at least 10% on imports from most US trading partners. The Trump administration plans to impose a 20% tariff on EU goods and higher tariffs on some of the largest US trading partners. These tariffs will take effect on April 9. Concerns about the escalation of the global trade war and a series of weaker-than-expected US data have raised fears of a sharp slowdown in the global economy. This, in turn, dragged the US dollar lower and provided a tailwind for EUR/USD. On the other hand, the US dollar rebounded after the sell-off triggered by US President Trump's tariffs. The excessive rise of the euro last week seems overblown; EUR/USD is more likely to pause and trade in the 1.0800/1.1100 range rather than continue to rise. In the long term, upside risks remain.
From the daily chart, EUR/USD surged to a six-month high of 1.1147 after breaking through the strong resistance area of 1.0955-1.0985 last week, which was the highest level in March. Some profit-taking before the weekend pushed the pair down to 1.0950. Currently, the short-term outlook for EUR/USD remains bullish as the 9-day simple moving average resumed its upward trend and traded around 1.0839. The 14-day relative strength index (RSI) of the technical indicator remains above 60.00, indicating active bullish momentum. Looking up, the euro not only needs to break through 1.0955-1.0985, but also needs to rise further to the previous high of 1.1147. Although upside risks remain, it remains to be seen whether the euro bulls can effectively break through the significant weekly resistance areas of 1.1214 (last September high) and 1.1275 (July 2023 high). On the other hand, the previous resistance level of 1.0955-10900 will serve as the main first support range for the currency pair. Once it falls below the above area, EUR/USD will test the 1.0839 (9-day simple moving average) and 1.0850 (203 March high) area. The key support is at the 1.0731 {200-day simple moving average} level.
Today it is recommended to short the Euro before 1.0960, stop loss: 1.0980, target: 1.0910, 1.0900.

Disclaimer: The information contained herein (1) is proprietary to BCR and/or its content providers; (2) may not be copied or distributed; (3) is not warranted to be accurate, complete or timely; and, (4) does not constitute advice or a recommendation by BCR or its content providers in respect of the investment in financial instruments. Neither BCR or its content providers are responsible for any damages or losses arising from any use of this information. Past performance is no guarantee of future results.
More Coverage


Risk Disclosure:Derivatives are traded over-the-counter on margin, which means they carry a high level of risk and there is a possibility you could lose all of your investment. These products are not suitable for all investors. Please ensure you fully understand the risks and carefully consider your financial situation and trading experience before trading. Seek independent financial advice if necessary before opening an account with BCR.

 English
 简体中文
简体中文
 繁體中文
繁體中文
 Bahasa
Melayu
Bahasa
Melayu
 Tiếng
Việt
Tiếng
Việt
 ไทย
ไทย
 日本語
日本語
 한국어
한국어
 ភាសាខ្មែរ
 español