


0
US Dollar Index
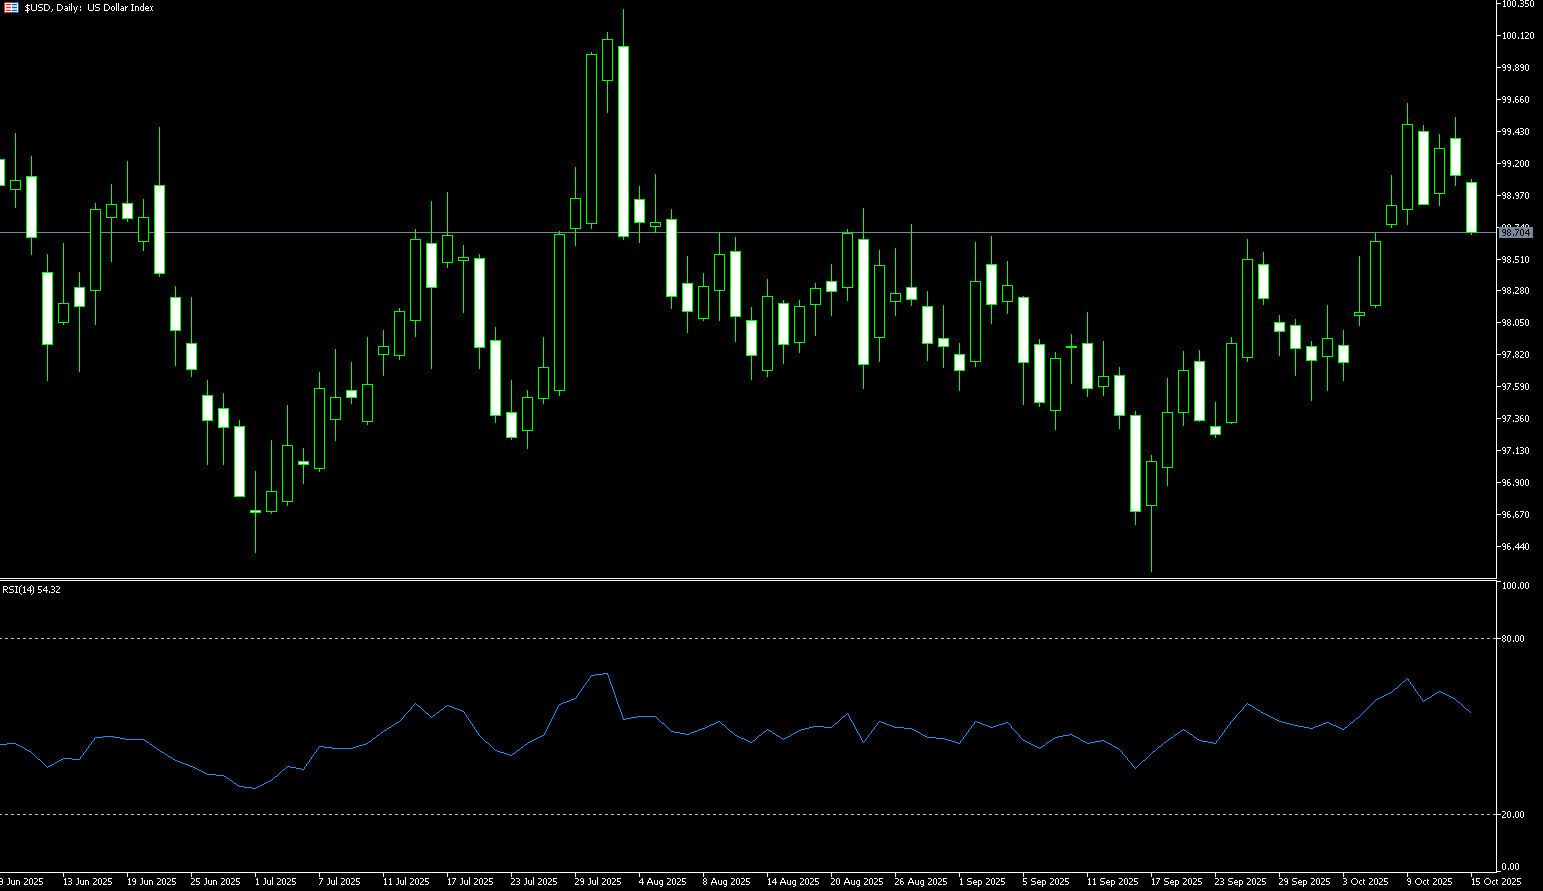
Early this week, Federal Reserve Chairman Powell signaled that an October rate cut remains under consideration and that quantitative tightening may be nearing its end, prompting the US dollar to fluctuate and weaken. In early Asian trading on Wednesday, the dollar largely held onto the previous day's losses, trading around 99.00. The US government shutdown has halted the release of key economic data on which the Fed relies for monetary policy, depriving the market of its traditional tools for predicting the Fed's direction. With the prevailing market consensus of "no data, no policy action"—at least for the upcoming Fed meeting—this uncertainty has actually contributed to the dollar's strength. However, with the potential end of quantitative tightening and expectations of a rate cut still lingering, the current corrective rebound may be nearing its end rather than its beginning. Therefore, the market may continue to look for evidence of a range-bound top on the daily US dollar chart to aid in identifying potential swing lows for other currency pairs.
Recently, given that prices on the daily chart are converging within a potential "bullish flag" pattern, further upside cannot be ruled out. The current rise in the US dollar is a corrective rebound, and bears may wait for a volatile top signal at higher levels to position themselves. Meanwhile, the 14-day Relative Strength Index (RSI) is above 55, indicating strengthening short-term upward momentum. Currently, strong resistance lies at 99.56 (a two-month high) and the psychological 100-number mark, which coincides with the August high of 100.26. On the downside, support lies primarily at 98.45 (the 14-day simple moving average), followed by 98.24 (the 50.0% Fibonacci retracement level from 100.26 to 96.22), and then at the 98.00-number mark.
Consider shorting the US Dollar Index at 98.90 today. Stop-loss: 99.00. Target: 98.45, 98.30.
WTI Spot Crude Oil
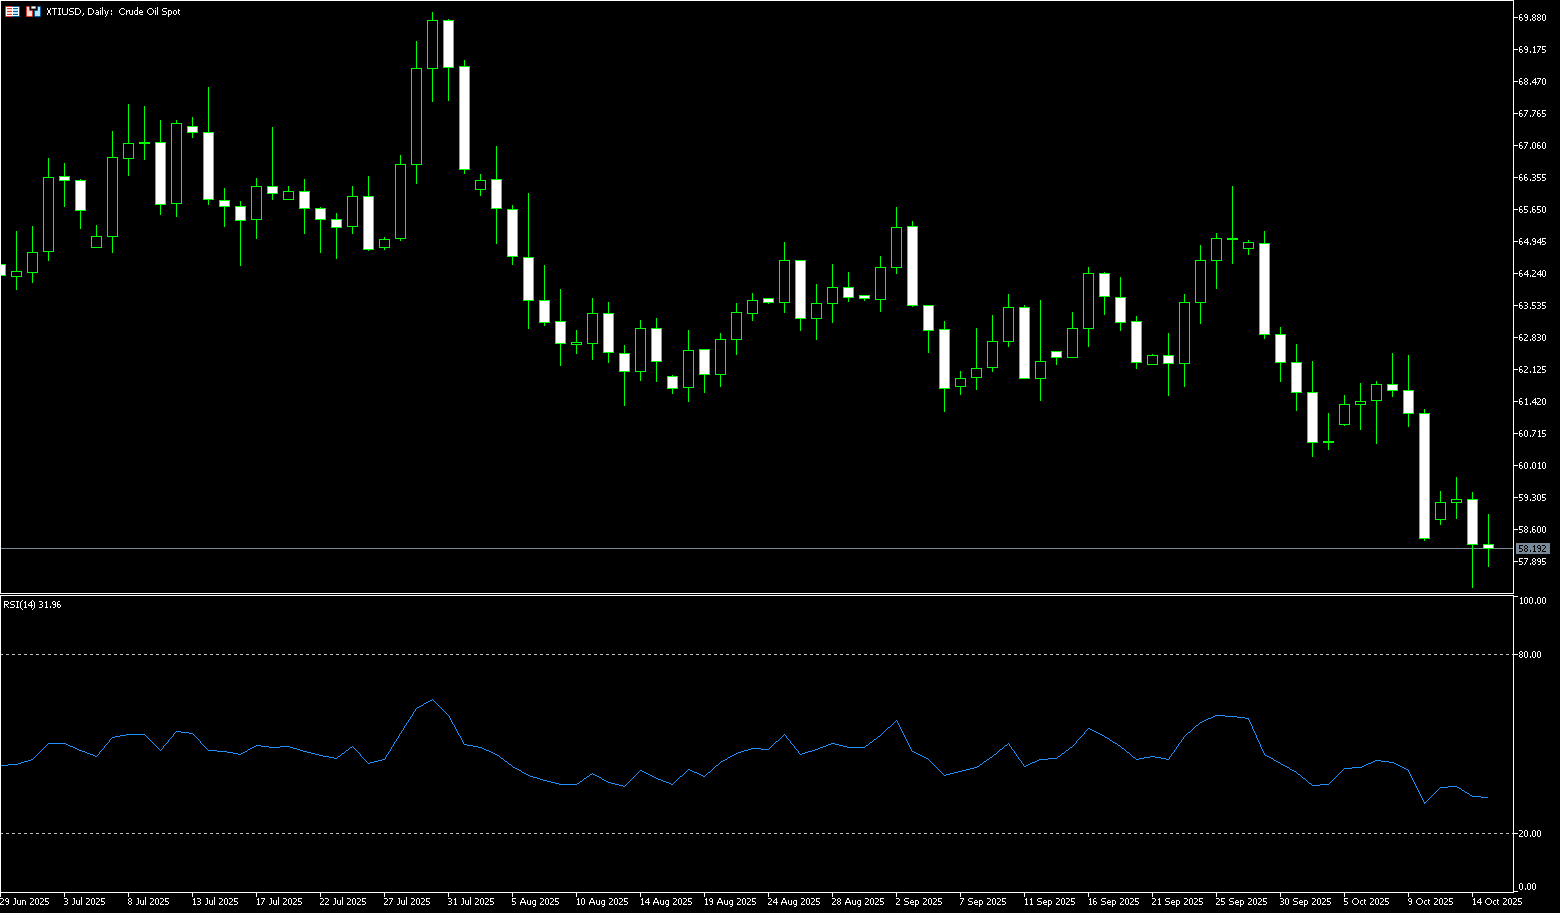
WTI crude oil traded around $58.30 per barrel on Wednesday. Oil prices fell nearly 2% on Tuesday, hitting a new low since May 7th at $57.68 per barrel, due to concerns about trade tensions and the IEA's warning of a massive supply glut by 2026. The oil industry continues to grapple with geopolitical issues, as the International Energy Agency (IEA) warns of a massive supply glut by 2026 and trade tensions persist. Meanwhile, OPEC+ countries continue to increase supply, raising concerns about an impending oversupply that is expected to push down oil prices. The IEA deepened its bearish tone, predicting a global oversupply of 4 million barrels per day by 2026, representing almost 4% of global demand. The agency also lowered its 2025 demand growth forecast to 710,000 barrels per day, citing a weakening economic backdrop and the accelerated adoption of transportation electrification.
From a technical perspective, WTI crude oil prices remain firmly bearish. Prices remain below the psychologically important $60.00 level. They remain below the 21-day (61.79), 50-day (62.56), and 100-day (64.43) simple moving averages, collectively forming a solid ceiling for near-term prices. The 14-day relative strength index (RSI) hovers below 40, indicating strong bearish momentum but not oversold territory, suggesting further downside potential. On the downside, immediate support lies at Tuesday's swing low of $57.32. A break below this level could challenge the year's low near $55.14 (May 5 low). On the upside, oil prices face initial resistance at the psychologically important $60 level. Even if this level is broken, a corrective rally to $61.79 (the 21-day simple moving average) will be challenging. Any upward move is likely to be short-lived as long as oil prices fail to reclaim this key moving average.
Consider going long on crude oil at $58.00 today. Stop-loss: $57.80. Target: $59.50, $60.00.
Spot Gold
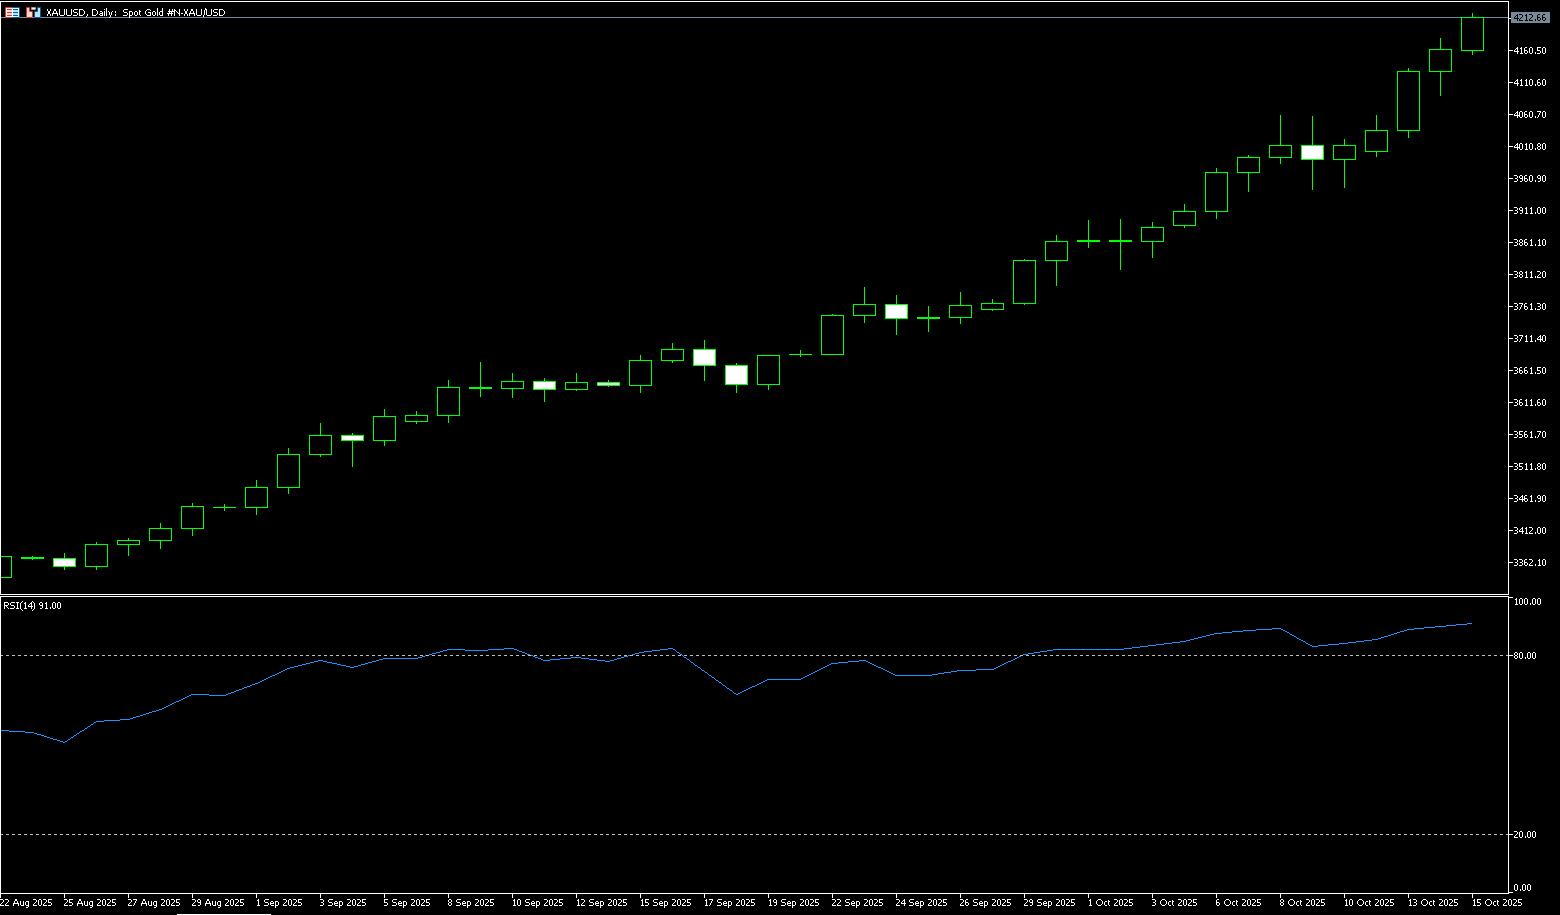
Spot gold hit a new all-time high near $4,218.20/oz in early trading on Wednesday. Gold prices reached a high of $4,179.50/oz on Tuesday, as expectations of a Federal Reserve rate cut this month and escalating trade tensions fueled risk aversion. The gold price rally is driven by multiple factors, including geopolitical uncertainty, expectations of a US rate cut, strong buying from central banks, and inflows into gold exchange-traded funds (ETFs). Bank of America and Societe Generale currently forecast gold prices to reach $5,000/oz by 2026. Escalating trade tensions, the ongoing US government shutdown, and market expectations of further Federal Reserve easing are all supporting gold prices. The global trend of de-dollarization could push gold prices to $5,000 per ounce by the middle of next year.
From a technical perspective, the upward trend over the past seven weeks has consistently followed an upward-sloping trendline. Furthermore, after breaking through the psychological resistance area of $4,000, gold prices surged above $4,100 at the start of the week, solidifying the short-term bullish outlook for gold, reaching a new all-time high of $4,218.20 midweek. However, the 14-day Relative Strength Index (RSI) on the daily chart is showing a severe overbought signal, suggesting that gold prices may need a period of consolidation before further gains can be expected. The area between $4,085 (the 5-day simple moving average) and $4,100 is expected to provide strong support. However, a break below this support level could trigger a technical sell-off, dragging gold prices towards the psychological level of $4,000. At this stage, gold's technical outlook remains firmly bullish, extending gains above $4,200. A daily close above this level could confirm further upward momentum, paving the way for a test of $4,250 and then $4,300.
Consider a long position in gold at $4,202 today, with a stop-loss at $4,195 and targets at $4,235 and $4.245.
AUD/USD
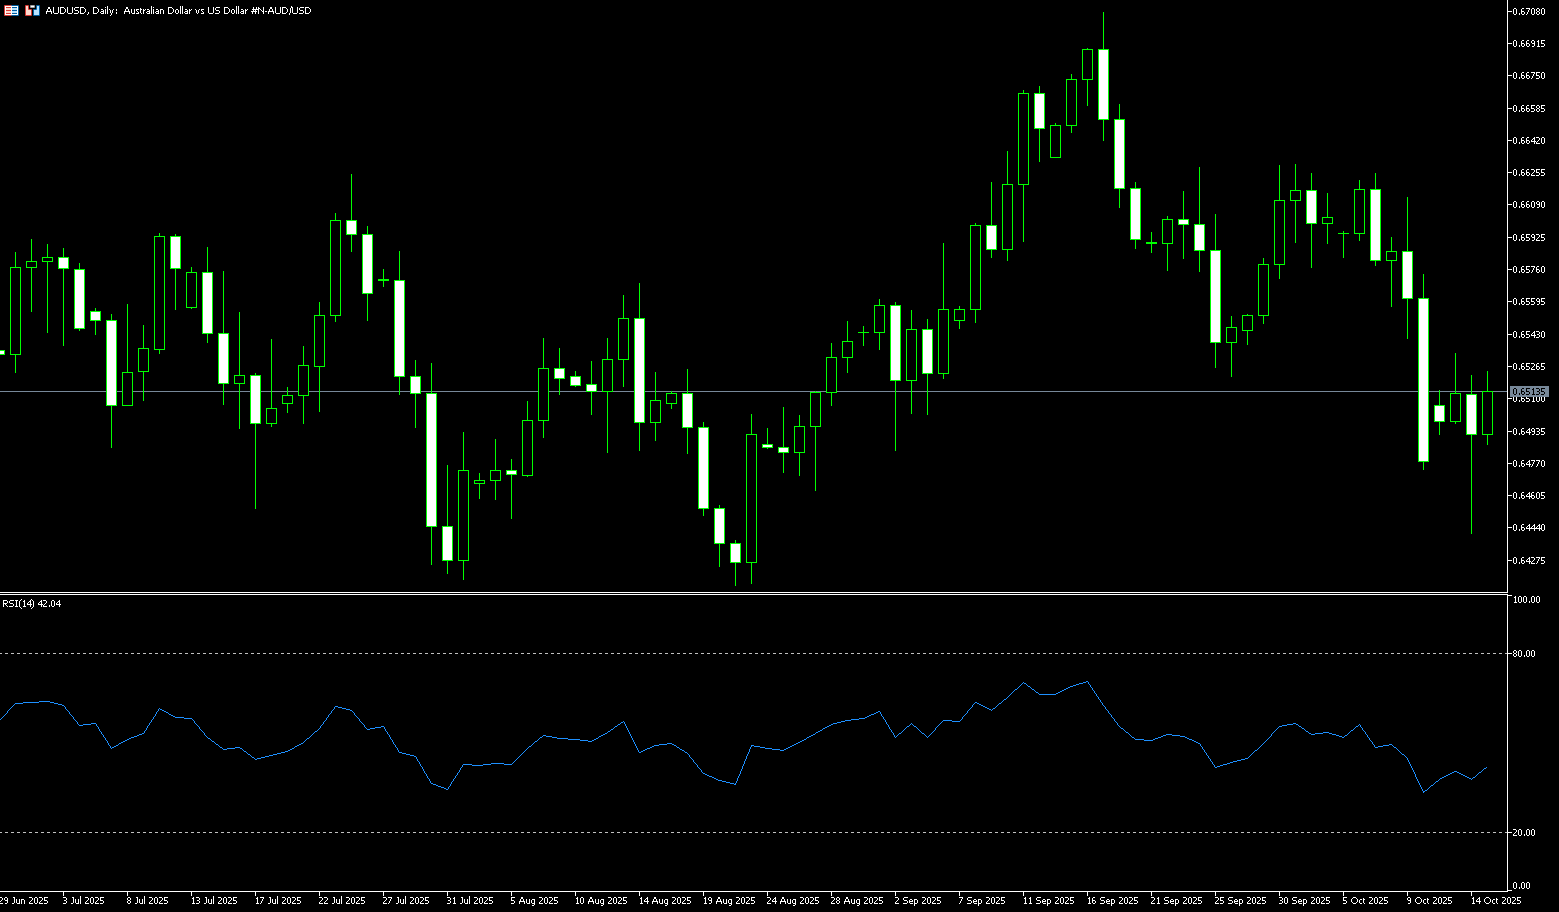
The Australian dollar appreciated above $0.6500 on Wednesday, recovering some of the previous session's losses, as investors weighed comments from a senior Reserve Bank of Australia official noting higher-than-expected inflation. Deputy Governor Sarah Hunt noted that recent economic data had been slightly stronger than expected, suggesting that third-quarter inflation could exceed previous forecasts. Her comments echoed Tuesday's RBA meeting minutes, which showed that policymakers saw no urgency to cut interest rates amid persistent services inflation and stable employment. Traders, on the other hand, awaited the release of key data such as third-quarter inflation at the end of the month and labor market data later in the week. Meanwhile, the latest data showed that Australia's Westpac-Melbourne Leading Economic Index remained unchanged in September, suggesting weakening growth momentum, but steady trend growth is expected to continue until early 2026.
The Australian dollar (AUD)/US dollar (USD) exchange rate retraced around 0.6500 on Wednesday. Technical analysis on the daily chart suggests a bearish bias. Furthermore, the 14-day relative strength index (RSI) remains below 50, further reinforcing the bearish bias. On the downside, AUD/USD could target Tuesday's near two-month low of around 0.6440. A break above this channel would strengthen the bearish bias and prompt the pair to test the four-month low of 0.6414 set on August 21, followed by the 0.6400 round-figure mark. Key resistance lies near the 14-day simple moving average at 0.6562, followed by the psychologically important 0.6600 level. A break above these levels would improve short- and medium-term price momentum and allow AUD/USD to test the October 1 high of 0.6629.
Consider a long position on the Australian dollar at 0.6500 today, with a stop-loss at 0.6490 and targets at 0.6550 and 0.6540.
GBP/USD
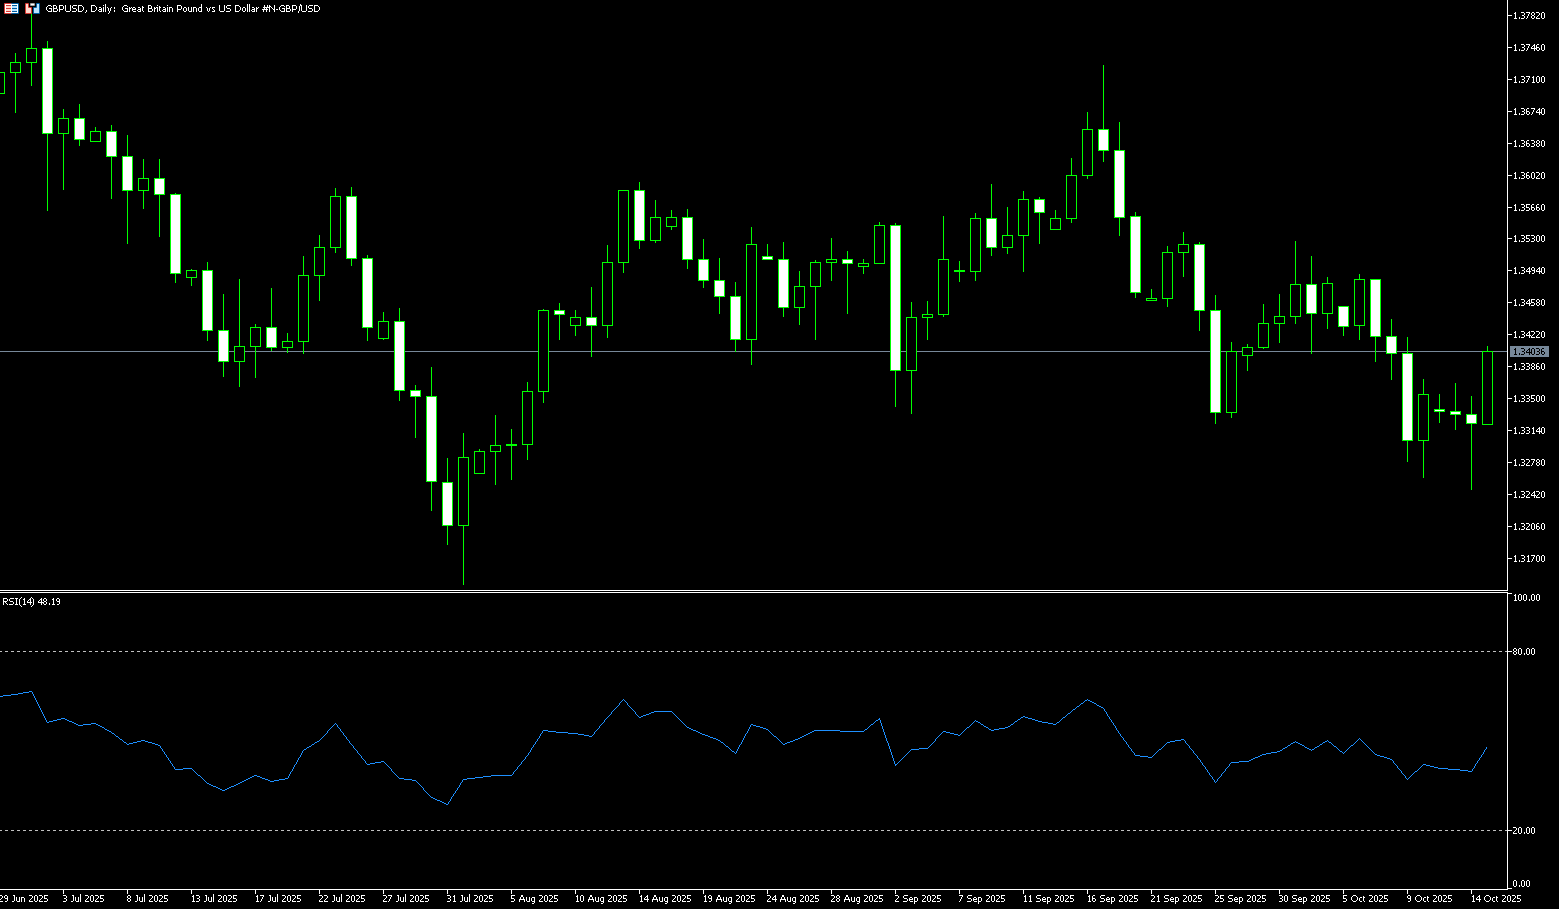
GBP/USD recovered losses from the previous two consecutive sessions during Wednesday's Asian session, trading around 1.3380. The US dollar declined, driving the pair higher, as the likelihood of further Federal Reserve rate cuts in 2025 increased. The likelihood of further rate cuts increased after Federal Reserve Chairman Powell stated on Tuesday that the Fed is on track to cut interest rates by another 25 basis points later this month, despite the government shutdown significantly dampening economic sentiment. Powell highlighted the low pace of hiring and noted that this trend could weaken further. GBP/USD's upside may be limited due to signs of a cooling UK labor market, which has reinforced market expectations for further Bank of England rate cuts throughout the year. According to Reuters, traders expect the Bank of England to cut interest rates by another 46 basis points this year.
Recent technical charts suggest a neutral to downside bias for GBP/USD. A daily close below the 1.3300 level could pave the way for a test of lower prices. Momentum is also bearish, as indicated by the 14-day relative strength index (RSI). This suggests the first support level will be at 1.3300. A break above this level would expose the October 10 low of 1.3261, followed by 1.3200. Conversely, if GBP/USD climbs above the 1.3400 level, the next resistance level will be the 25-day simple moving average at 1.3460, followed by the psychological market level of 1.3500.
Consider a long position on the British pound at 1.3375 today, with a stop loss of 1.3365 and a target of 1.3445 or 1.3355.
USD/JPY
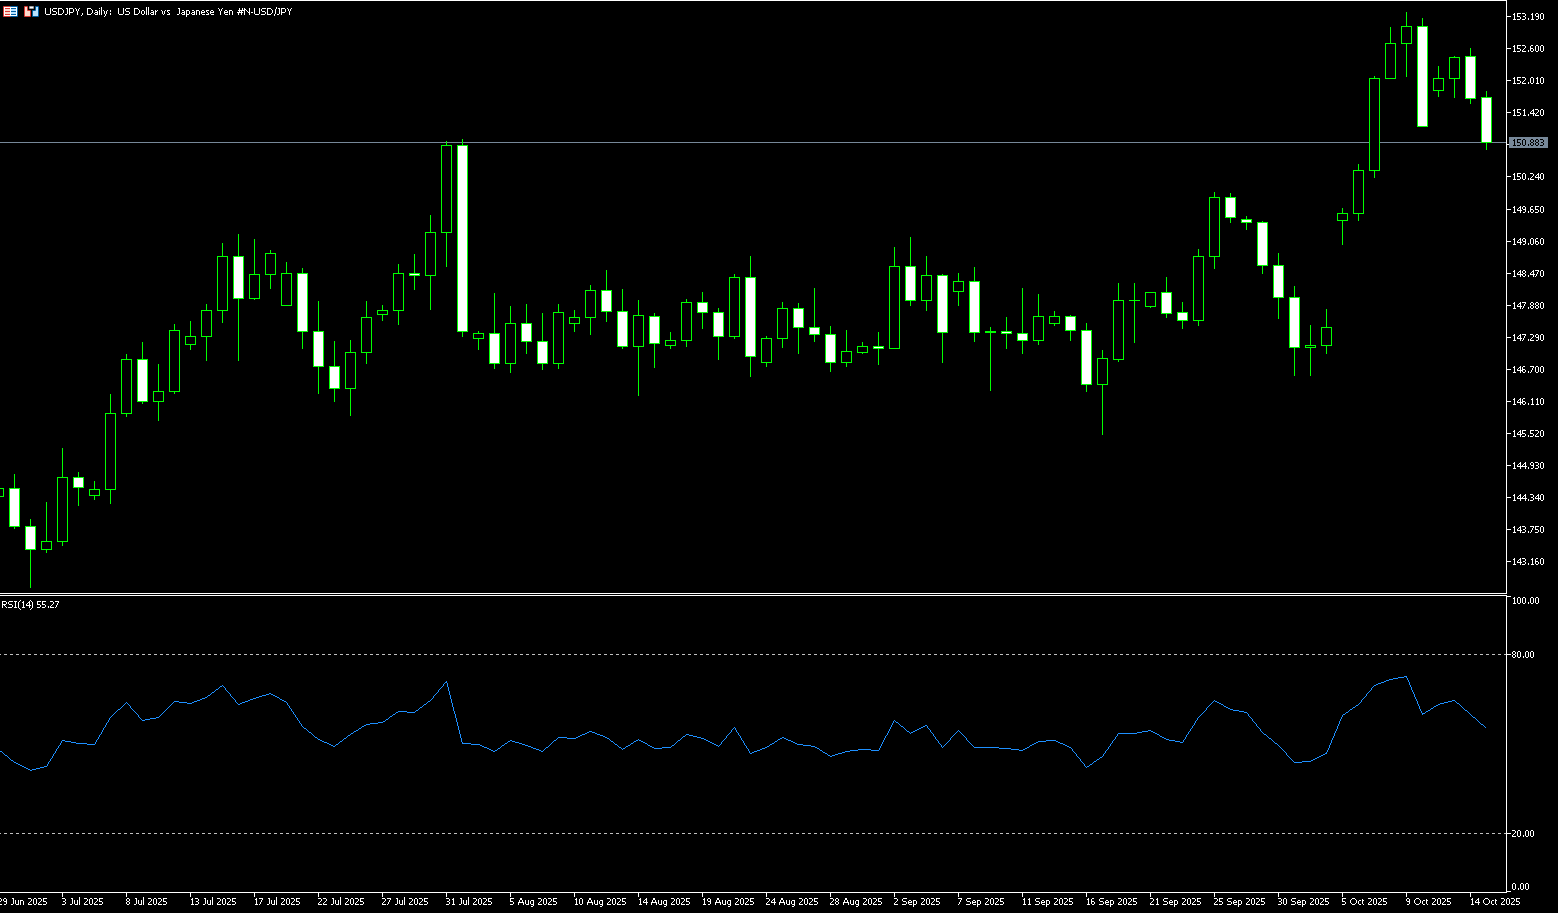
The yen rose to around 151.00 against the US dollar on Wednesday, strengthening for the second consecutive trading day as markets remained uncertain whether ruling Liberal Democratic Party leader Sanae Takaichi would become the next prime minister following her split from the Komeito Party. Takaichi, known for her support of Abenomics-style expansionary policies, has fueled bets on increased fiscal spending and looser monetary policy, typically weighing on the yen while boosting stocks. Opposition parties were also holding talks today to secure sufficient support to form a new government. Meanwhile, the yen received additional support from safe-haven demand as US-China tensions escalated, with President Trump threatening to impose a cooking oil embargo on Beijing in response to a Chinese soybean boycott.
The daily chart shows that USD/JPY has failed to break above its 10-day simple moving average of 150.92 several times this week, subsequently breaking below its 9-day simple moving average, around the 151.35 area. This could be seen as a key trigger for USD/JPY bearish sentiment. A sustained breakout and acceptance below the 151.00 level would reaffirm the negative outlook and drag the spot price to the October 7 low of 150.24. A break below this level would target the psychological 150.00 level. On the other hand, any intraday rebound above the 151.65-151.70 area would likely face immediate resistance near the 152.00 round-figure mark. Further gains could attract some selling in the 152.25 area and be capped at 152.61 (Tuesday's high). A sustained strong break above the latter level could shift bullish traders' appetite and push USD/JPY towards the 153.00 level.
Consider shorting the US dollar at 151.50 today. Stop-loss: 151.75, target: 150.50, 150.30.
EUR/USD
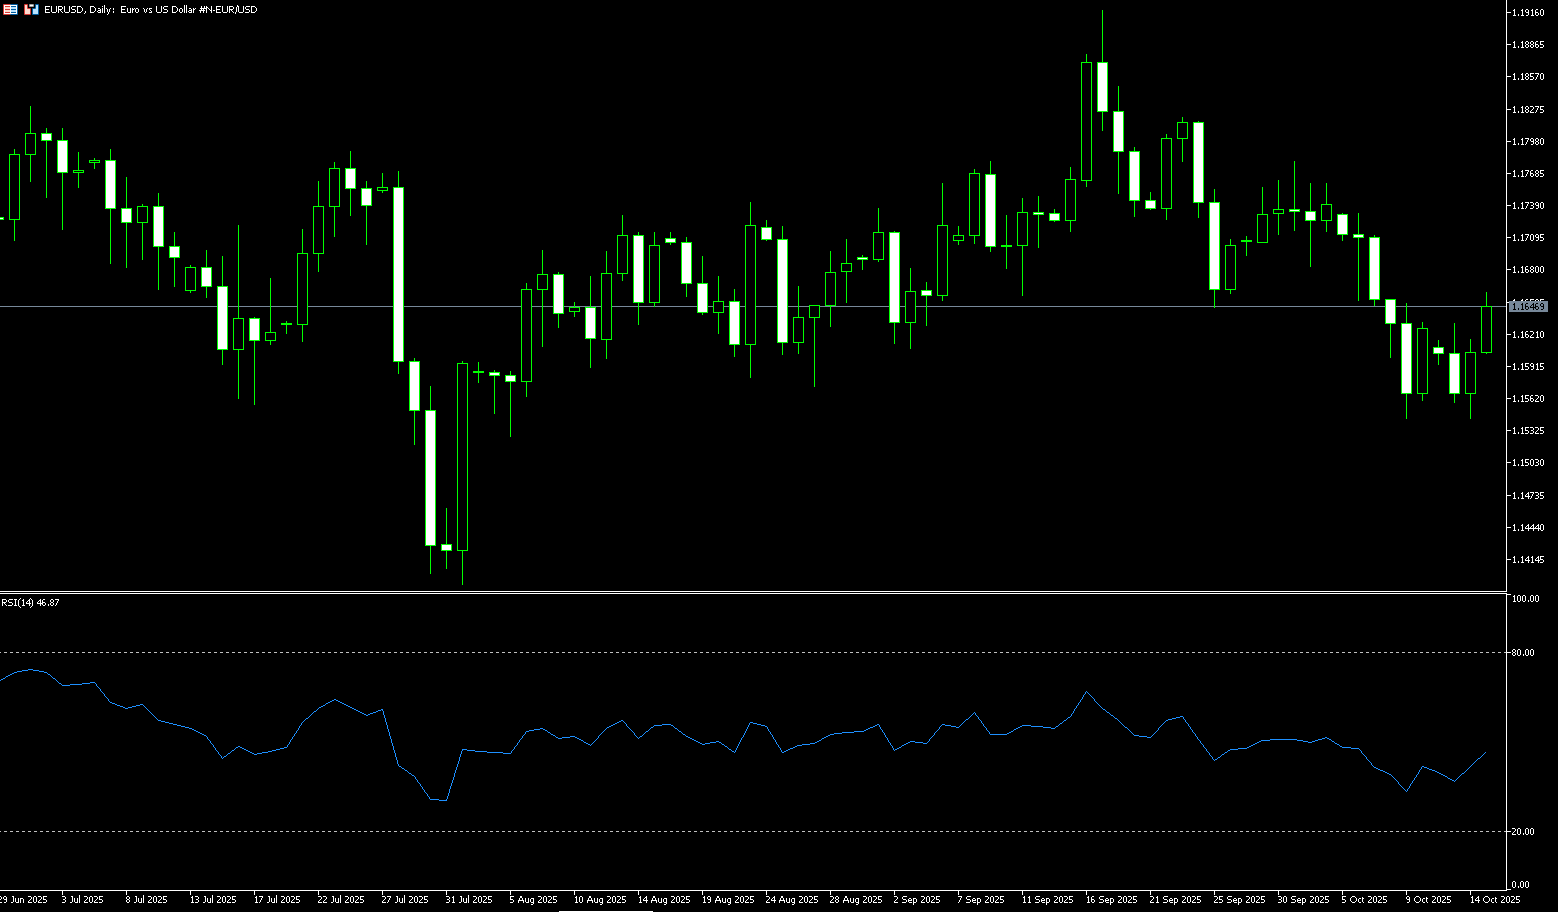
The EUR/USD pair rose to near 1.1635 during Wednesday's trading session. The US dollar weakened against the euro following comments from Federal Reserve Chairman Powell, strengthening bets on a rate cut this month. Eurozone industrial production data for August will be released later on Wednesday. Powell said on Tuesday that a sharp slowdown in hiring poses a growing risk to the US economy, suggesting the central bank could cut interest rates two more times this year. His dovish comments put pressure on the US dollar and created a tailwind for the major currency pair. Across the Atlantic, French Prime Minister Sébastien Le Cornu suspended a landmark 2023 pension reform until the 2027 presidential election to end months of political turmoil in the country. Following the announcement, the common currency edged higher against the dollar. Meanwhile, European Central Bank President Christine Lagarde reiterated that monetary policy is in a good position and that the bank's next move is more likely to be a rate cut than a hike.
The daily chart shows that the EUR/USD pair's technical picture improved on Wednesday, with the pair re-entering the 1.1600 level and converging. However, the pair's short-term outlook remains neutral to the downside, with the 14-day Relative Strength Index (RSI) falling below the 50.00 level, suggesting increasing downward momentum. Currently, the pair remains below its 100-day simple moving average (SMA) at 1.1643. Key support currently lies at 1.1575 (the 120-day SMA), followed by 1.1542 (the October 9 low). A break above the latter would expose the 1.1500 level, a round-figure mark. Conversely, key resistance lies at the 100-day SMA at 1.1643. A break above this level could pave the way for a test of the 1.1700 level.
Today, you can consider going long on EUR at 1.1625, stop loss: 1.1615, target: 1.1670; 1.1660
Disclaimer: The information contained herein (1) is proprietary to BCR and/or its content providers; (2) may not be copied or distributed; (3) is not warranted to be accurate, complete or timely; and, (4) does not constitute advice or a recommendation by BCR or its content providers in respect of the investment in financial instruments. Neither BCR or its content providers are responsible for any damages or losses arising from any use of this information. Past performance is no guarantee of future results.
More Coverage


Risk Disclosure:Derivatives are traded over-the-counter on margin, which means they carry a high level of risk and there is a possibility you could lose all of your investment. These products are not suitable for all investors. Please ensure you fully understand the risks and carefully consider your financial situation and trading experience before trading. Seek independent financial advice if necessary before opening an account with BCR.