


0
US Dollar Index
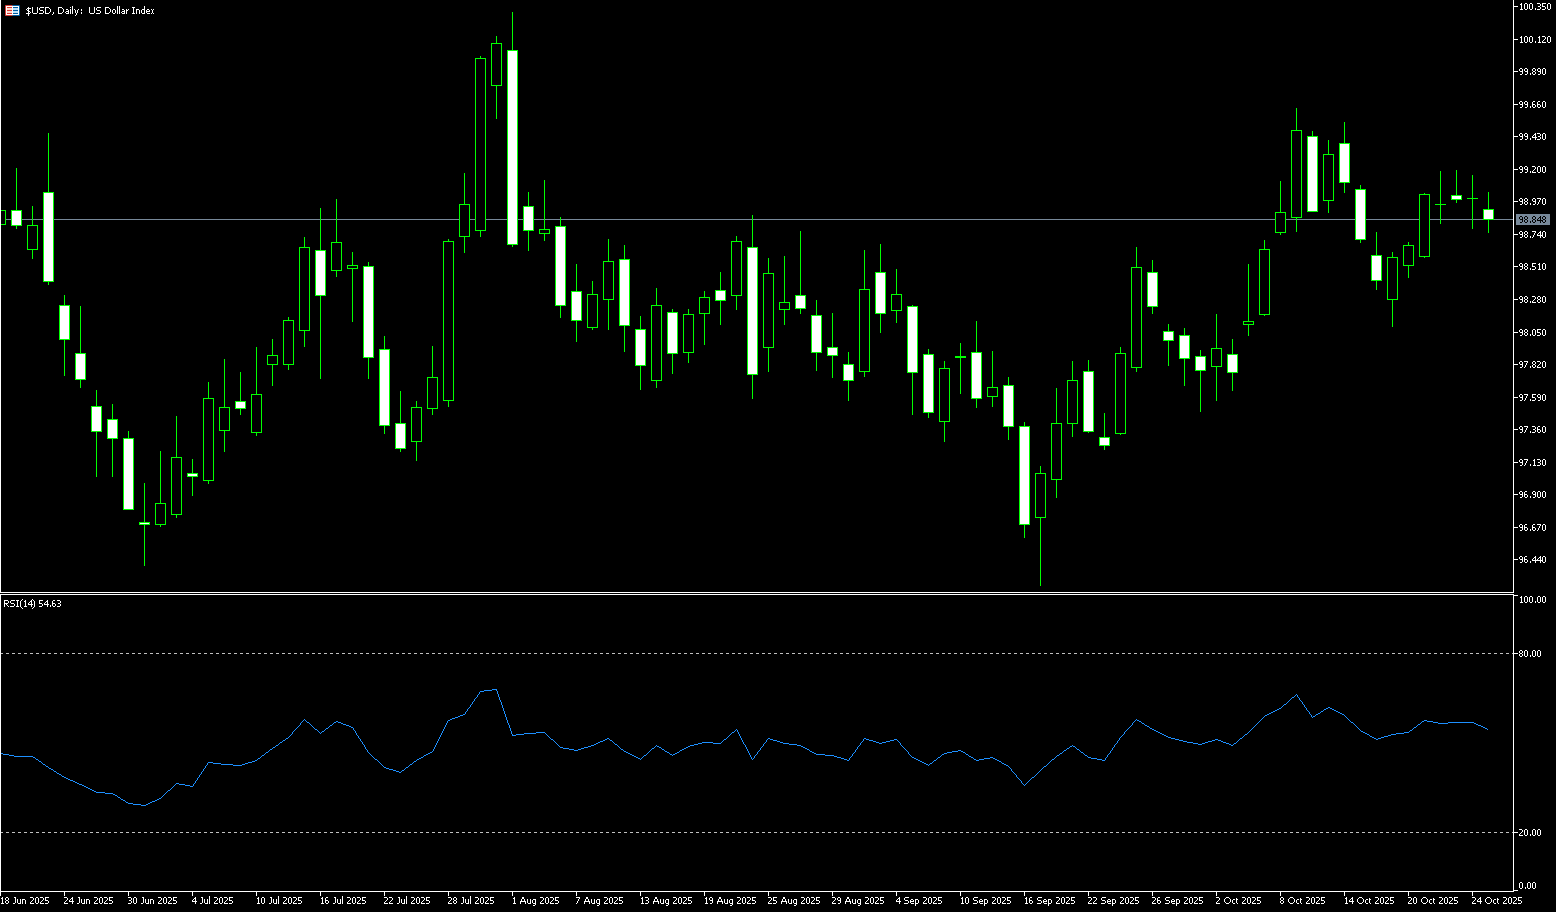
The US dollar dipped slightly at the start of the week. Key focus this week is the heightened risk aversion triggered by the Trump administration's halt in trade negotiations, and weak US CPI data, which reinforced expectations of rate cuts. These factors, combined with geopolitical tensions, are driving increased market volatility. This week's summit will be a key variable. Currently, the foreign exchange market is showing a divergent pattern amid multiple uncertainties. The US dollar was virtually flat last Friday after new inflation data showed a weaker-than-expected increase in US consumer prices in September, maintaining the possibility of another Fed rate cut this week. Looking ahead to this week, if the summit signals easing, it could ease risk aversion and drive a rebound in non-US currencies. Conversely, renewed tariff concerns could test the US dollar's support at 99. Central bank activity is intensive, with meetings of the Federal Reserve, Bank of Japan, and European Central Bank shaping the trajectory. Data releases and official speeches are crucial. In the short term, US dollar bulls are favored, but volatility risks remain.
On the daily chart, the US dollar index is trading below its 200-day simple moving average of 100.63, maintaining a bearish outlook. However, momentum signals are bullish: the Relative Strength Index (RSI) hovers above 55, suggesting short-term upside potential, while the Average Directional Index (ADX), near 19, suggests the trend is slowly gaining momentum. If the current recovery accelerates further, the US dollar index is expected to face further resistance at the 170-day simple moving average (SMA) at 99.42 and 99.56 (a near two-month high), followed by the psychologically important 100.00 level. Conversely, the 21-day SMA at 98.57 presents an immediate challenge. A break below this level would expose a deeper correction to the 50.0% Fibonacci retracement level at 98.24, which could lead to a further correction to lower support at the 98.00 round-figure mark.
Consider shorting the US Dollar Index at 99.95 today. Stop-loss: 99.05. Targets: 98.50, 98.40.
WTI Spot Crude Oil
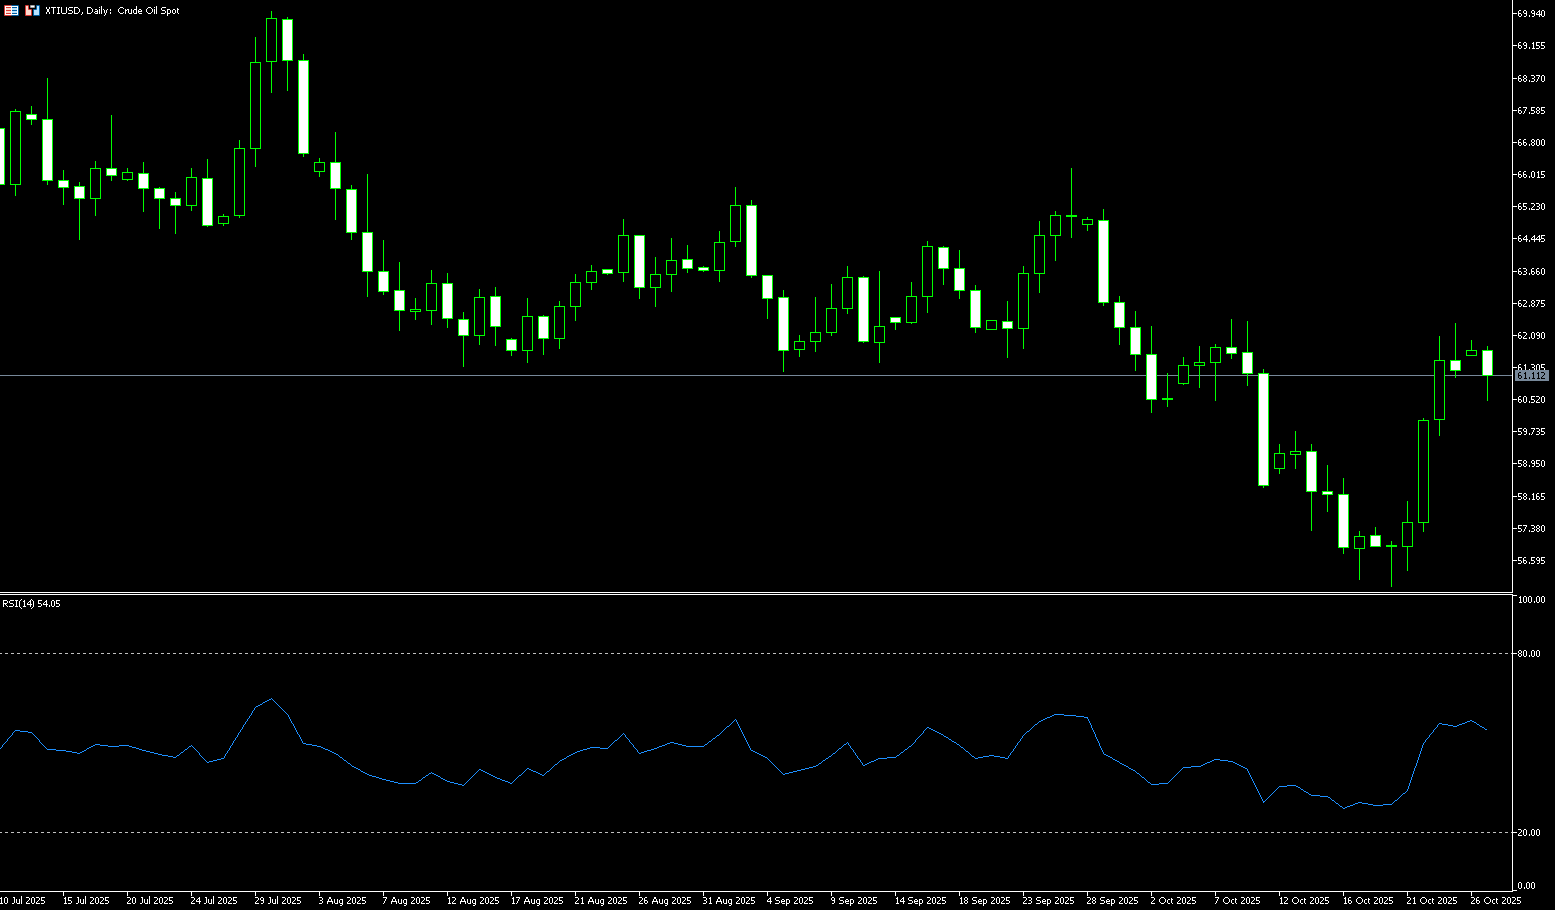
WTI crude oil is trading near $61.00. Due to US sanctions on Russia, India has reduced its imports of Russian crude oil, while easing trade tensions has boosted demand. Both crude oil benchmarks rose in early trading, extending gains of over 5% following the announcement of sanctions last Thursday, but retreated in the final two hours of trading. Both benchmarks still rose over 7% last week, their largest weekly gain since mid-June. US President Trump imposed sanctions on Rosneft and Lukoil to pressure Russian President Vladimir Putin to end the war in Ukraine. While the easing of trade tensions has boosted demand, the market is assessing the impact of US sanctions on Russian crude oil. Furthermore, the US government shutdown, which could last until the end of November, is increasing uncertainty and limiting oil price gains. From a structural perspective, the current rally in crude oil prices is driven by "expectations of improved sentiment combined with supply disruptions," rather than a pure demand recovery. Therefore, the resilience of the trend remains to be verified.
The daily chart shows signs of convergence in the MACD indicator, signaling a correction. Short-term volatility favors a strong trend, but if trading volume fails to expand or trade sentiment fluctuates, oil prices could retest moving average support. In the short term, prices are entering a range of intense pressure, with WTI crude oil finding signs of stabilization near $60.05 (21-day SMA) and $60.00 (psychological barrier). A break below this level could lead to a test of last Thursday's low of $59.65, with subsequent support at $58.97 (9-day SMA). A failure to break above the $62.60 (65-day SMA) - $62.44 (October 9 high) range could lead to a renewed challenge of $63.47 (89-day SMA).
Consider going long on crude oil at 61.20 today. Stop-loss: 61.05, target: 62.60, 62.80.
Spot Gold
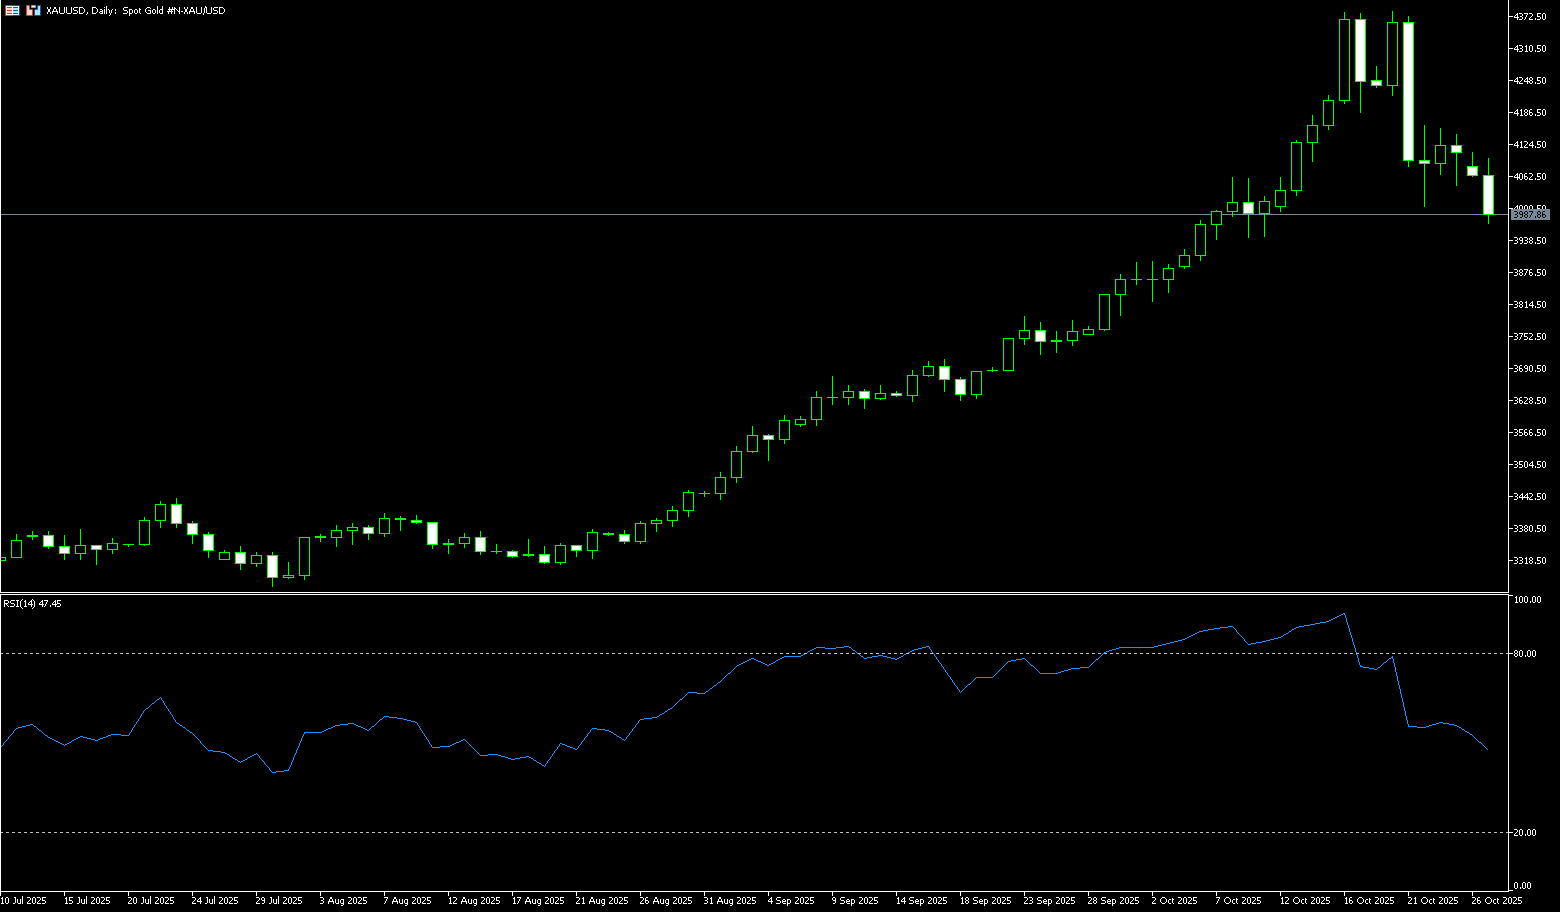
Amidst the volatile global economy, gold, a traditional safe-haven asset, is facing a tug-of-war between multiple factors. Spot gold prices opened sharply lower in early trading on Monday, gapping down nearly $50 to $4,058.50 per ounce before hitting a low of $3,971 during the extended session. This wasn't just a momentary release of market sentiment; it was the product of a complex interplay of forces, including the international trade situation, geopolitical dynamics, monetary policy expectations, and stock market performance. While gold prices are under significant short-term pressure and market bullish sentiment has significantly cooled, support from the Federal Reserve's interest rate cuts and lingering geopolitical risks have kept investors cautiously optimistic about gold's long-term outlook. Furthermore, President Trump hopes to focus on trade relations, and possibly other topics, during his meeting with the Chinese President this week. This series of positive signals quickly weakened gold's safe-haven appeal, causing prices to plummet at the opening bell on Monday.
Gold is showing initial signs of consolidation after a strong rally that began early last week. The short-term outlook has turned bearish, as prices are currently trading below the 5-day (4107); 9-day (4186); and 14-day (4140) simple moving averages on the 4-hour chart. Furthermore, the 5-day and 14-day simple moving averages formed a bearish "death cross" pattern over the weekend, suggesting fading bullish momentum. On the downside, $4,004 (October 22 low) and the psychological $4,000 level remain key support areas. A decisive break below this level could trigger a deeper correction towards the 30-day simple moving average at $3,955, potentially testing the $3,900 round-figure mark. On the upside, the 5-day simple moving average near $4,106 poses immediate resistance, followed by the 14-day simple moving average at $4,140.
Consider going long on gold at 3,975 today. Stop loss: 3,970. Target: 4,020, 4.030.
AUD/USD
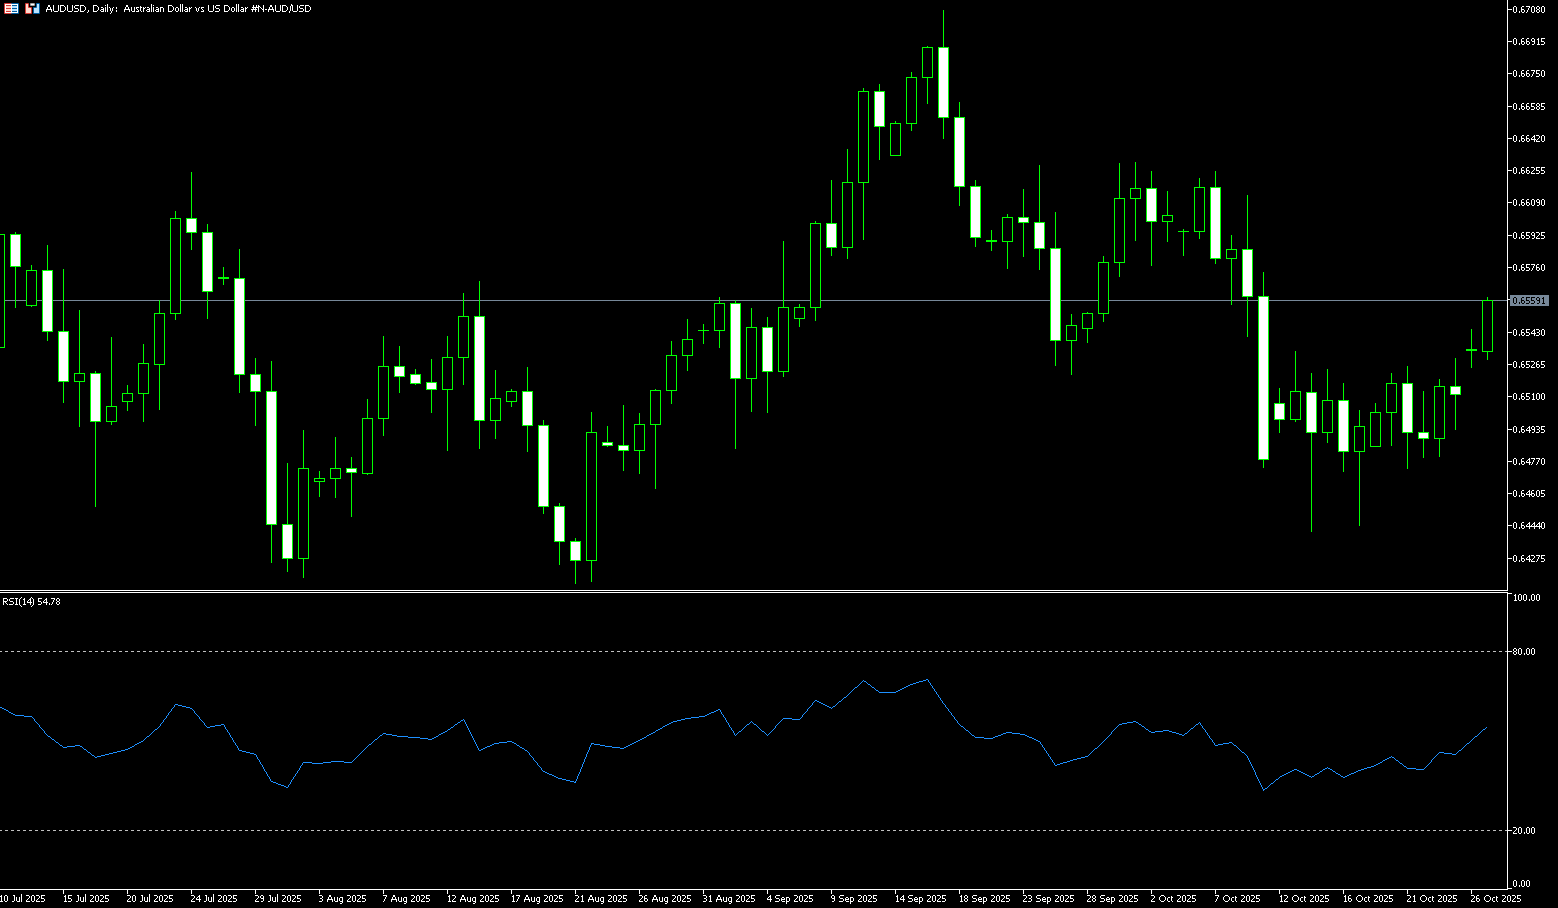
The Australian dollar rose to a high of around $0.6560 on Monday, supported by optimism about progress on the US-China trade deal. This paves the way for President Trump and President Xi Jinping to formally reach an agreement later this week. This highly anticipated meeting could reduce the risk of a full-blown global trade war, which has been threatening industries around the world. Last week, the US and Australia also finalized a critical minerals partnership, which Presidents Trump and Albanese positioned as a strategic move to curb US dependence on China. Domestically, investors are eyeing the upcoming third-quarter inflation data and the September monthly CPI report, which are expected to provide key insights into the Reserve Bank of Australia's future policy direction.
The Australian dollar traded around $0.6550 against the US dollar on Monday. Technical analysis on the daily chart suggests that bearish sentiment may be waning. The pair is currently trading above its 14-day simple moving average at 0.6512, indicating strong short-term price momentum. On the upside, immediate resistance lies at 0.6570 (the 34-day simple moving average) and 0.6600 (a psychologically important level). A successful break above this overlapping resistance zone would support the AUD/USD pair in testing the 12-month high of 0.6624 on October 7. Initial support lies at 0.6512 (the 14-day simple moving average) and 0.6500 (a round-figure level). A break below these levels would weaken short-term price momentum and cause the AUD/USD pair to hover around 0.6443 (the October 17 low) and 0.6437 (the 200-day simple moving average).
Consider a long position on the Australian dollar at 0.6540 today, with a stop-loss of 0.6530 and targets of 0.6590 and 0.6600.
GBP/USD
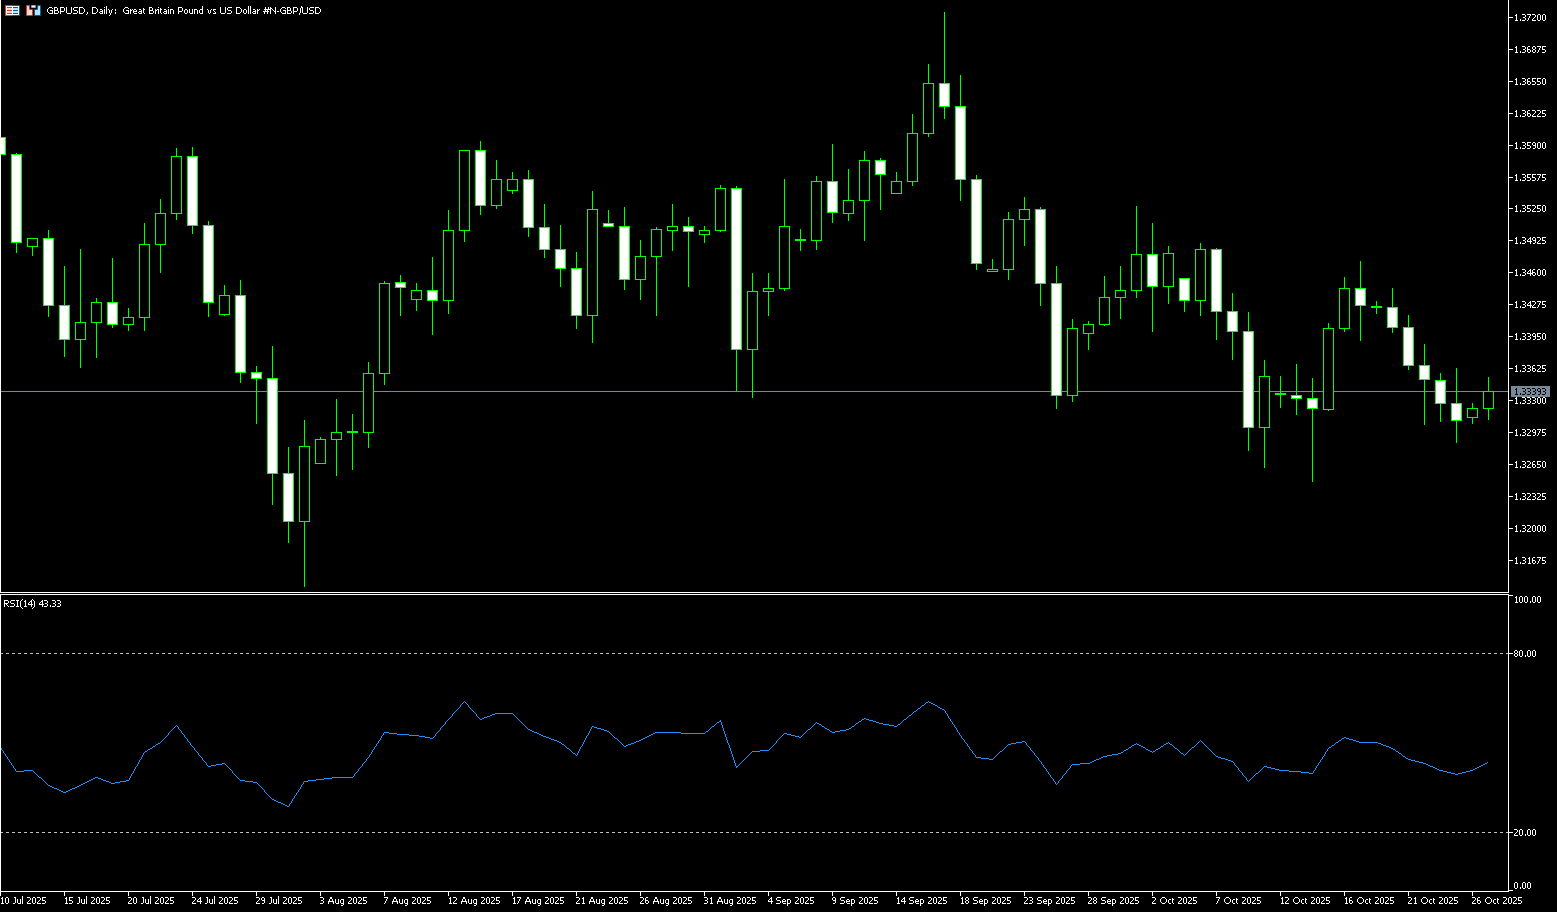
GBP/USD started the new week on a slightly positive note, holding firmly above the 1.3300 round-figure mark during the Asian session, despite a lack of sustained buying. Furthermore, the fundamental backdrop suggests that the path of lowest resistance for the spot price remains downward, supporting a continuation of the six-day downtrend. The British pound continues to underperform relative to the dollar amid growing expectations of further easing by the Bank of England, which in turn serves as resistance for GBP/USD. Furthermore, concerns about the UK's fiscal outlook ahead of the crucial Autumn Budget in November could further limit GBP/USD's gains. Meanwhile, the US dollar struggled to continue its gains after rebounding from a one-week low on Friday, as markets bet on two more rate cuts from the Federal Reserve this year. Furthermore, concerns about a prolonged US government shutdown are also weakening the dollar.
The daily chart clearly shows that the British pound is hovering within the lower half of the Bollinger Band, currently trading above the lower Bollinger Band at 1.3273. The indicator parameters show the Bollinger Band's central axis at approximately 1.3391, and the upper band at approximately 1.3509. Regarding the price structure, the previous high of 1.3527 (01/10) fell back to the secondary high of 1.3471 (17/10) and then retreated to 1.3248, where it then rebounded, forming a short-term convergence pattern characterized by unformed lows and declining highs. The current price's repeated tests of the lower band at 1.3273 suggest a typical pattern of "weak mean reversion": rallies will likely end at the middle band at 1.3391, with little potential for extension to the upper band at 1.3509. If the Bollinger Band's lower band, between 1.3287 (last week's low) and 1.3273 (last week's low), continues to fall, a retest of 1.3248 (October 14 low) is likely; a break below this level could push prices down to 1.3200.
Consider going long on the British pound at 1.3322 today, with a stop-loss of 1.3310 and targets of 1.3380 and 1.3390.
USD/JPY
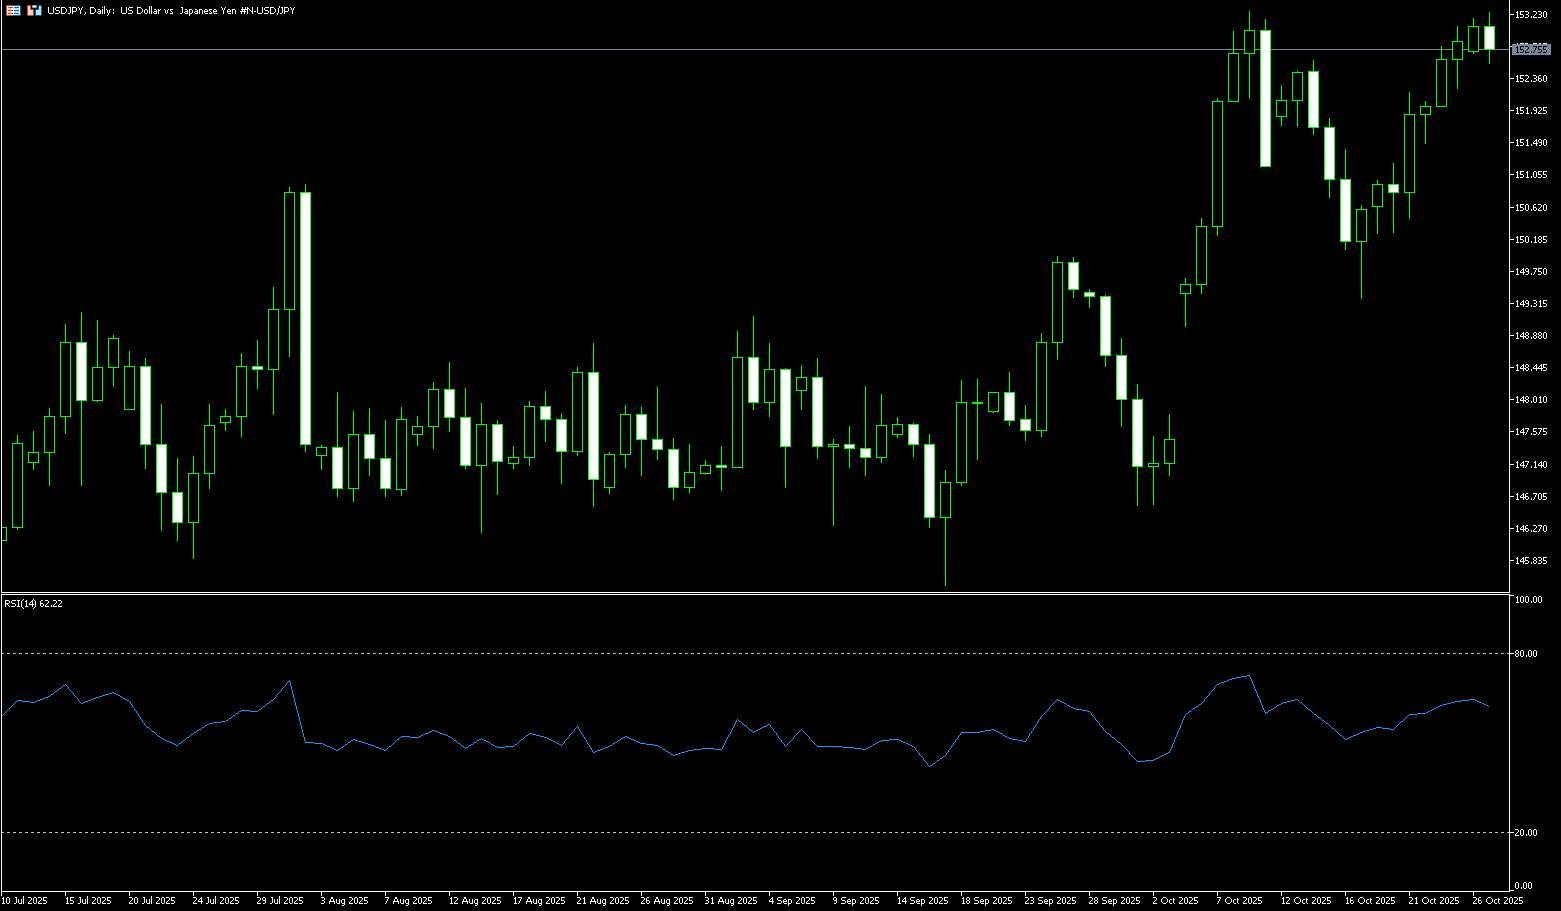
The yen briefly fell below 153.25 per dollar on Monday, nearing its lowest level since February, as market expectations of an aggressive fiscal expansion by the new government and uncertainty about the Bank of Japan's policy outlook weighed on the currency. The yen has fallen sharply this month following the election of Prime Minister Sanae Takaichi, who is expected to implement expansionary fiscal measures and support loose monetary policy. Reports suggest she may unveil a major stimulus package early next month, potentially exceeding the 13.9 trillion yen plan enacted last year to ease household inflationary pressures. Meanwhile, the Bank of Japan is widely expected to keep interest rates unchanged this week, although policymakers will discuss the conditions for resuming rate hikes if tariff-related risks ease.
From a technical perspective, any follow-through buying in the 153.25-153.30 area (or the highest level since February reached earlier this month) would be seen as a fresh trigger for USD/JPY bulls. Considering that oscillators on the daily chart are gaining positive momentum and remain well outside overbought territory, the spot price could aim to recapture the 154.00 round-figure mark. Momentum could extend further to the next relevant barrier near the mid-154.00 level, leading to the 154.75-154.80 area and the psychological 155.00 level. On the other hand, the Asian session low around the 152.65 area could act as immediate support. A break below this level could see the pair slide to the intermediate support of 152.25, and thus the 152.00 level. A decisive break below the latter could negate the positive outlook and trigger some technical selling, paving the way for a deeper decline towards the 151.10-151.00 support range.
Consider shorting the US dollar at 153.05 today. Stop-loss: 153.20. Target: 152.00, 151.80.
EUR/USD
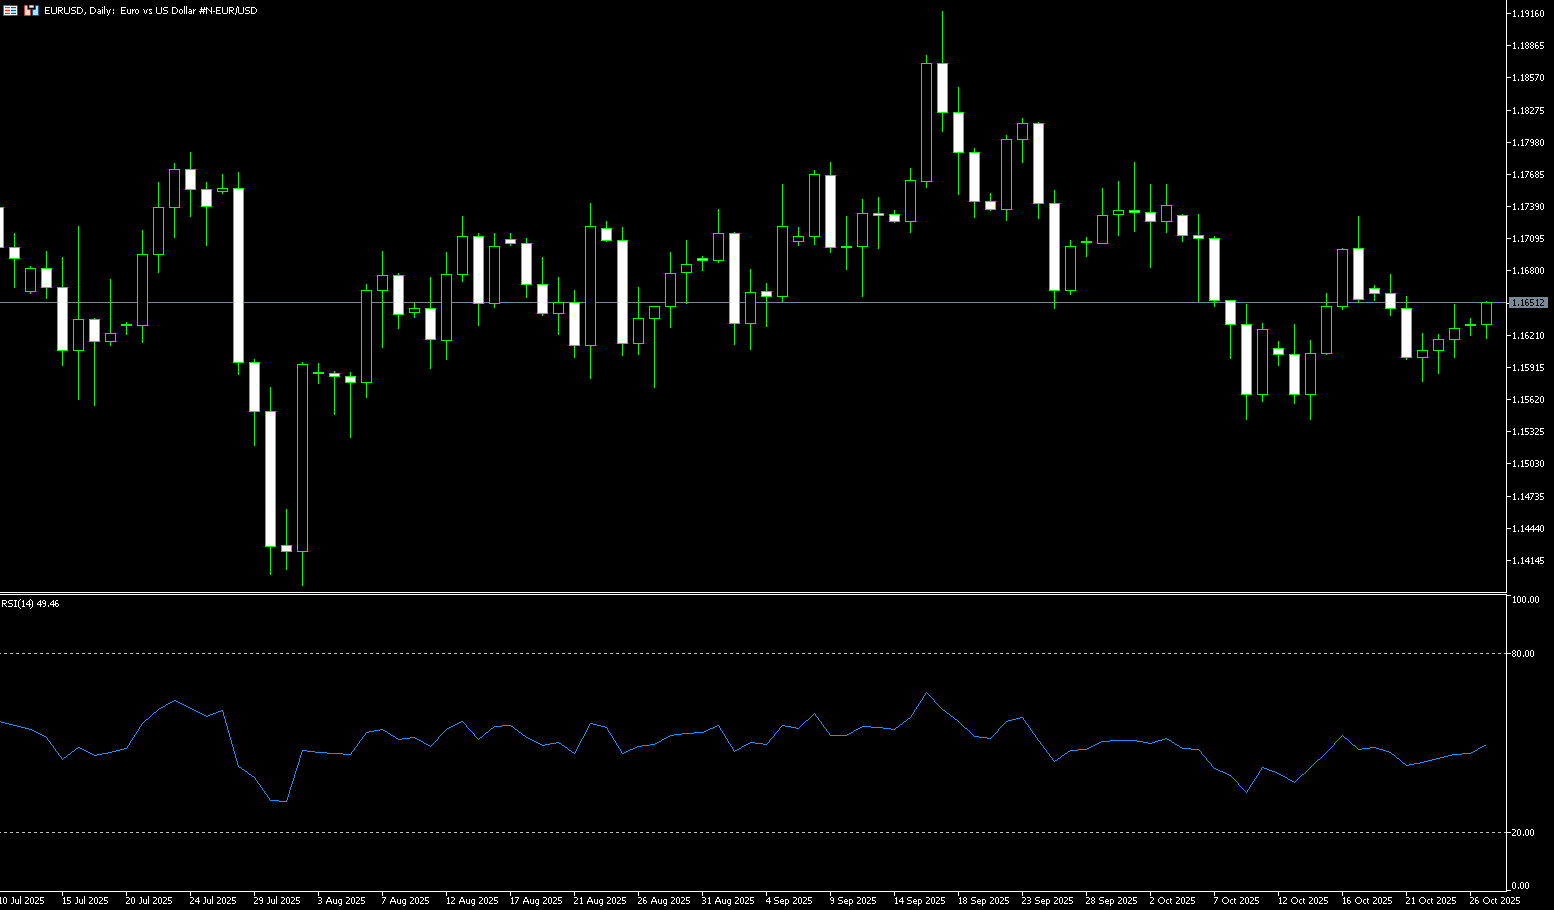
EUR/USD remained strong for the fourth consecutive day during Monday's Asian session, trading around 1.1650. The euro found support after ECB Governing Council member José Luis Escriva stated on Sunday that he was comfortable with current borrowing cost settings and that inflation was on target, pushing the pair slightly higher. However, the euro could come under pressure after French Socialist Party leader Olivier Faure threatened to overthrow Prime Minister Sébastien Le Cornu's government on Monday if his party's budget demands were not met. He threatened to submit a motion of no confidence unless higher taxes on billionaires were imposed. EUR/USD's upside may be limited by reports that US and Chinese negotiators have reached a consensus on key issues. Malaysian officials announced after two days of talks that the two sides had reached an agreement on key issues, including export controls, fentanyl, and transportation taxes.
The technical outlook for EUR/USD improved slightly starting late last week, but remains neutral as the pair trades below both the 20-day (1.1649) and 100-day (1.1662) SMAs on the daily chart. Furthermore, the 20-day (1.1649) SMA has slipped below the 100-day (1.1662) SMA, forming a bearish "death cross" pattern. The 14-day Relative Strength Index (RSI) has slipped below the neutral 50 level, suggesting increasing bearish momentum. Immediate support lies at 1.1600 (round number), followed by last week's low of 1.1576. A break below these levels would raise the next level towards 1.1526 (150-day SMA), and further towards the 1.1500 round number. On the upside, resistance lies at 1.1688 (the 50-day simple moving average). A decisive break above 1.1700 would pave the way for the October 1 high of 1.1780.
Today, consider going long on the euro at 1.1636, with a stop-loss at 1.1625 and targets at 1.1680 and 1.1690.
Disclaimer: The information contained herein (1) is proprietary to BCR and/or its content providers; (2) may not be copied or distributed; (3) is not warranted to be accurate, complete or timely; and, (4) does not constitute advice or a recommendation by BCR or its content providers in respect of the investment in financial instruments. Neither BCR or its content providers are responsible for any damages or losses arising from any use of this information. Past performance is no guarantee of future results.
More Coverage


Risk Disclosure:Derivatives are traded over-the-counter on margin, which means they carry a high level of risk and there is a possibility you could lose all of your investment. These products are not suitable for all investors. Please ensure you fully understand the risks and carefully consider your financial situation and trading experience before trading. Seek independent financial advice if necessary before opening an account with BCR.

 English
 简体中文
简体中文
 繁體中文
繁體中文
 Bahasa
Melayu
Bahasa
Melayu
 Tiếng
Việt
Tiếng
Việt
 ไทย
ไทย
 日本語
日本語
 한국어
한국어
 ភាសាខ្មែរ
 español