


0
US Dollar Index
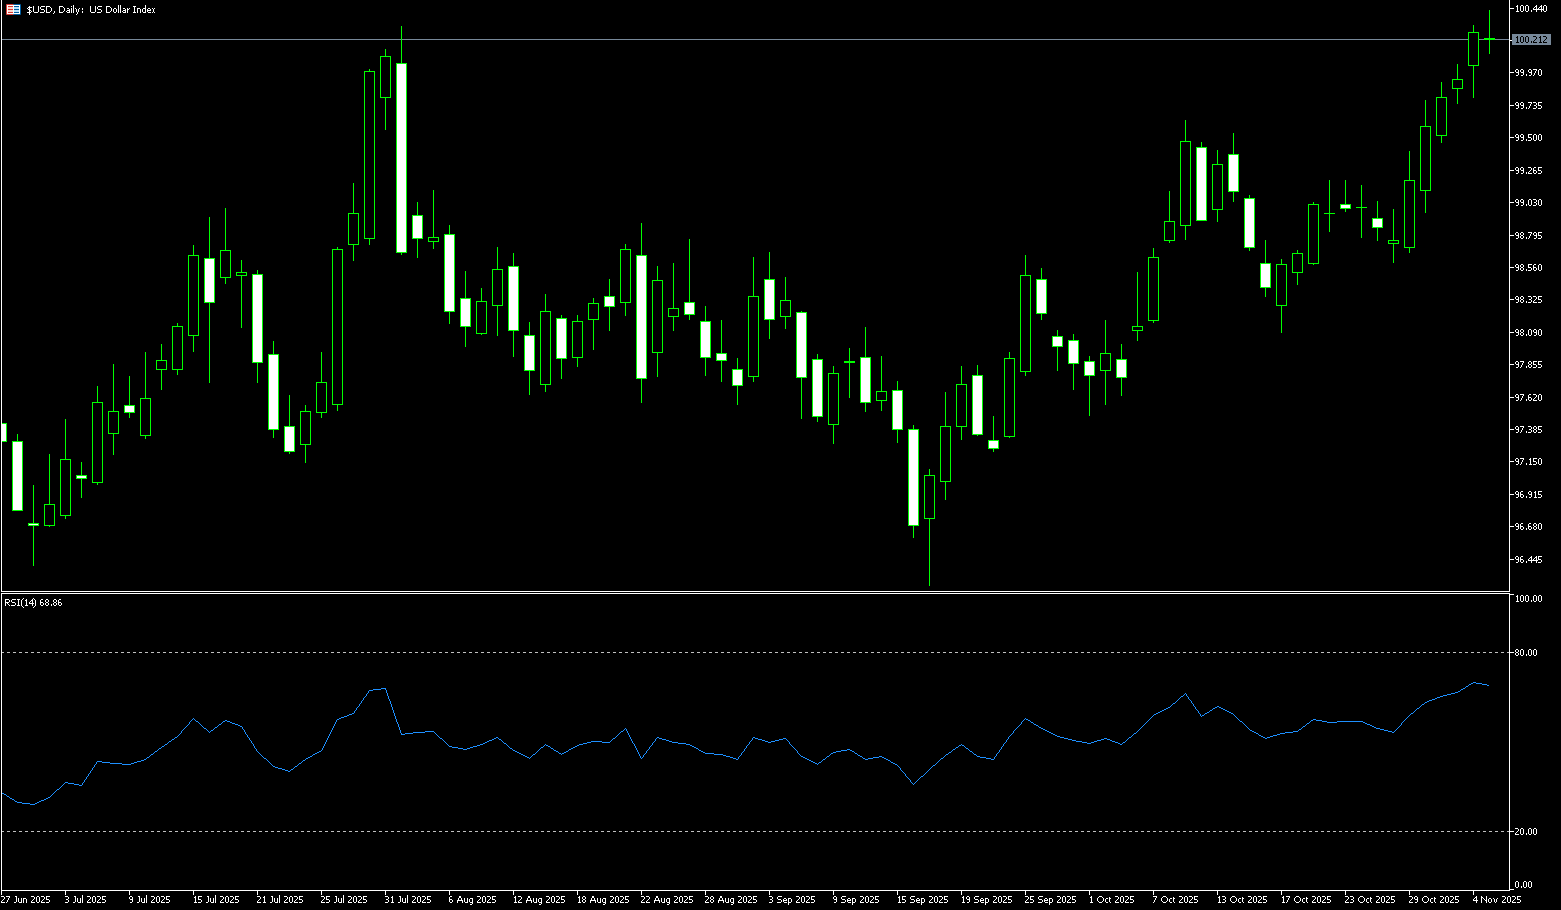
The US dollar index remained above 100 on Wednesday, hovering near its highest level since May, as global risk aversion fueled demand for safe-haven currencies. Global equities and other risk assets came under pressure amid heightened concerns about rising artificial intelligence valuations, while warnings from top Wall Street bank CEOs about a potential market correction further dampened risk appetite. The dollar also received support from speculation that the Federal Reserve might keep interest rates unchanged in December after officials expressed caution about further easing. The market now sees a 69% probability of a 25 basis point rate cut next month, down from around 90% before last week's FOMC decision. Meanwhile, the ongoing US government shutdown, the longest in history, has clouded the outlook by delaying the release of key economic data.
After falling below 100 for the first time since early August, the US dollar index rebounded this week, reaching a high of 100.26, forming a "double top" pattern with the August 1st high of 100.26. The near-term outlook for the US dollar index remains cautiously bullish, supported by waning expectations of a December Fed rate cut and continued demand for safe-haven assets. However, the rally faces technical resistance at 100.53 (the May 29 high) and the 210-day simple moving average at 100.72. A sustained stay above this level could indicate that traders are pricing in a more hawkish Fed stance or heightened global risk aversion, paving the way for a move towards the 101.00 level. Conversely, a failure to break 100.53 could reflect limited market confidence due to weak US manufacturing data and the continued lack of official economic reports during the government shutdown. In this scenario, traders may reassess long positions, potentially triggering a pullback towards the support zone at 98.71 (early weekly low) and 99.46 (the 9-day simple moving average).
Today, consider shorting the US Dollar Index at 100.28, with a stop-loss at 100.45 and targets at 99.60 and 99.70.
WTI Crude Oil
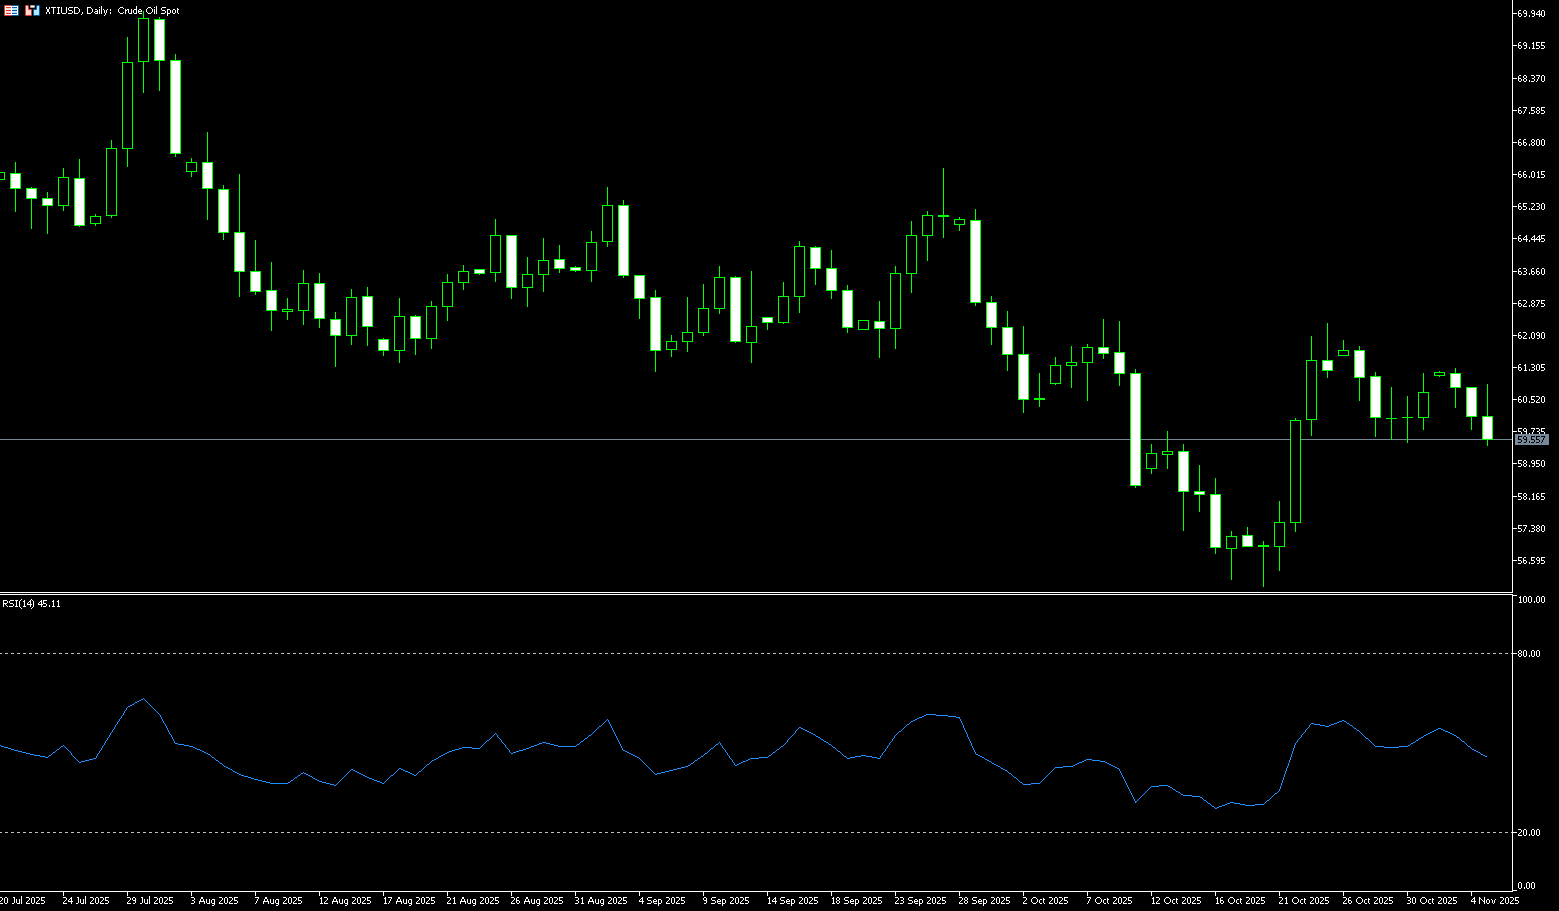
US WTI crude oil traded below $60 a barrel on Wednesday, extending losses from the previous session, as concerns about oversupply and weak demand weighed on market sentiment. Data from the US Energy Information Administration showed that US crude oil inventories surged by 5.202 million barrels last week, the largest increase since July, while fuel inventories declined. Prices were pressured by rising production from OPEC+ and non-member countries, fueled by concerns about a global oversupply. OPEC+ recently agreed to slightly increase production in December but plans to pause increases in early 2026, indicating their awareness of weak demand. Meanwhile, India's Reliance Industries sold a shipment of Iraqi crude oil to Europe, raising questions about potential stricter US sanctions against Russia's top oil company. Furthermore, disappointing manufacturing purchasing managers' indices in Asia and the US highlighted a slowdown in industrial activity, further dampening the demand outlook.
Observing the recent price movements, the technical rebound in WTI crude oil supports a mild short-term recovery, but the medium-term outlook remains constrained by the fundamental pressure of oversupply. Meanwhile, the market is also affected by geopolitical risks. A Ukrainian drone recently attacked an oil tanker, causing it to catch fire and damaging its loading facilities. Technically, the WTI crude oil daily chart shows that the price has recently been consolidating within a range of $59.48 (the 20-day simple moving average) to $62.38 (the high of October 24th), forming a clear box pattern. The price is currently trading above $59.48 (the 20-day simple moving average), with slightly positive short-term momentum, but the 14-day Relative Strength Index (RSI) is still hovering around 50, indicating a balance between bullish and bearish forces. If oil prices can effectively break through the resistance zone above $62.38, it may open up upward space towards the $63 mark and $63.52 (100-day simple moving average); conversely, if it falls below the $59.48 support, it may return to a weak channel towards $59.00 (psychological level). The next target is $57.89 (October 10 low).
Consider going long on crude oil today at $59.35, with a stop loss at $59.20 and targets at $61.00 and $61.30.
Spot Gold
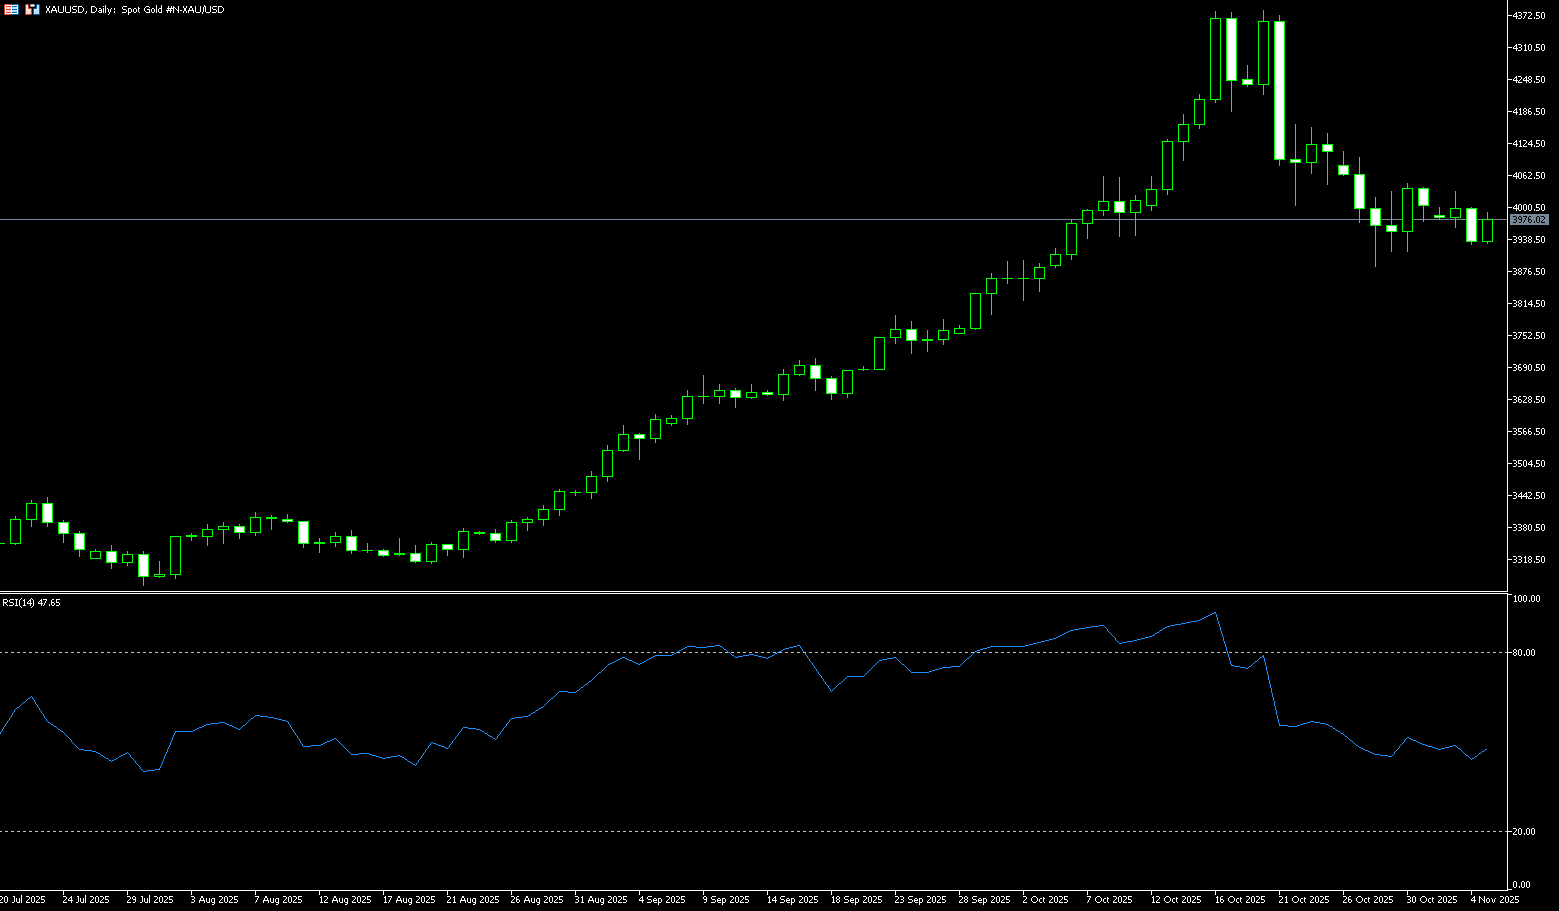
Spot gold traded in a narrow range in early European trading on Wednesday, currently trading at $3,980 per ounce. The US dollar index broke through the 100 mark on Tuesday, closing at 100.21, having reached a three-month high of 100.22 during the session, the highest since early August. This surge in the US dollar has directly increased the cost of gold for holders of non-US currencies, deterring global buying. Overall, gold has entered a phase of orderly pullback and consolidation since reaching a record high of $4381 on October 20th, currently in a rebalancing period before a crucial directional decision. On the other hand, market pricing in a December rate cut has cooled somewhat. This combination of "cutting while remaining cautious" means gold faces two forces simultaneously: firstly, the slow downward revision of discount rate expectations provides medium-term support for gold prices; secondly, the temporary resilience of the US dollar and US Treasury yields suppresses the upward momentum of gold prices. However, looking at the medium term, with global central bank gold purchases continuing unabated, geopolitical risks in the Middle East lingering, and inflation stickiness remaining, gold's strategic value as the ultimate safe-haven asset remains unshaken. Investors may consider buying opportunities near the $3750-$3800 range; once safe-haven sentiment reverses, a bullish counterattack could be imminent.
Since hitting a record high of $4,381 on October 20th, gold prices have entered a phase of orderly pullback and consolidation, currently in a rebalancing period before a crucial directional decision. In the short term, prices are fluctuating between $3,920 and $4,000, with candlestick charts showing alternating small-bodied bullish and bearish candles, a typical consolidation market characterized by "no increase in volume and no clear direction." Technical indicators such as the RSI remain near the midpoint of 48.00, indicating a slightly weak but fluctuating short-term trend. Currently, the first resistance levels to watch are $3,988 (9-day simple moving average) and $4,000 (psychological level). A break and hold above these levels could open the way to $4,060.00 (14-day simple moving average), with the next bullish price target pushing gold towards the strong resistance level of $4,100.00. Support levels are focused at $3,933 (40-day simple moving average) and $3,929.00 (Tuesday's low), with the next level at the $3,900 (psychological level). A break below this level would further test $3,886 (October 28 low) and $3,855 (50-day simple moving average).
Consider going long on gold today at $3,976, with a stop loss at $3,970 and targets at $4,010 and $4,020.
AUD/USD
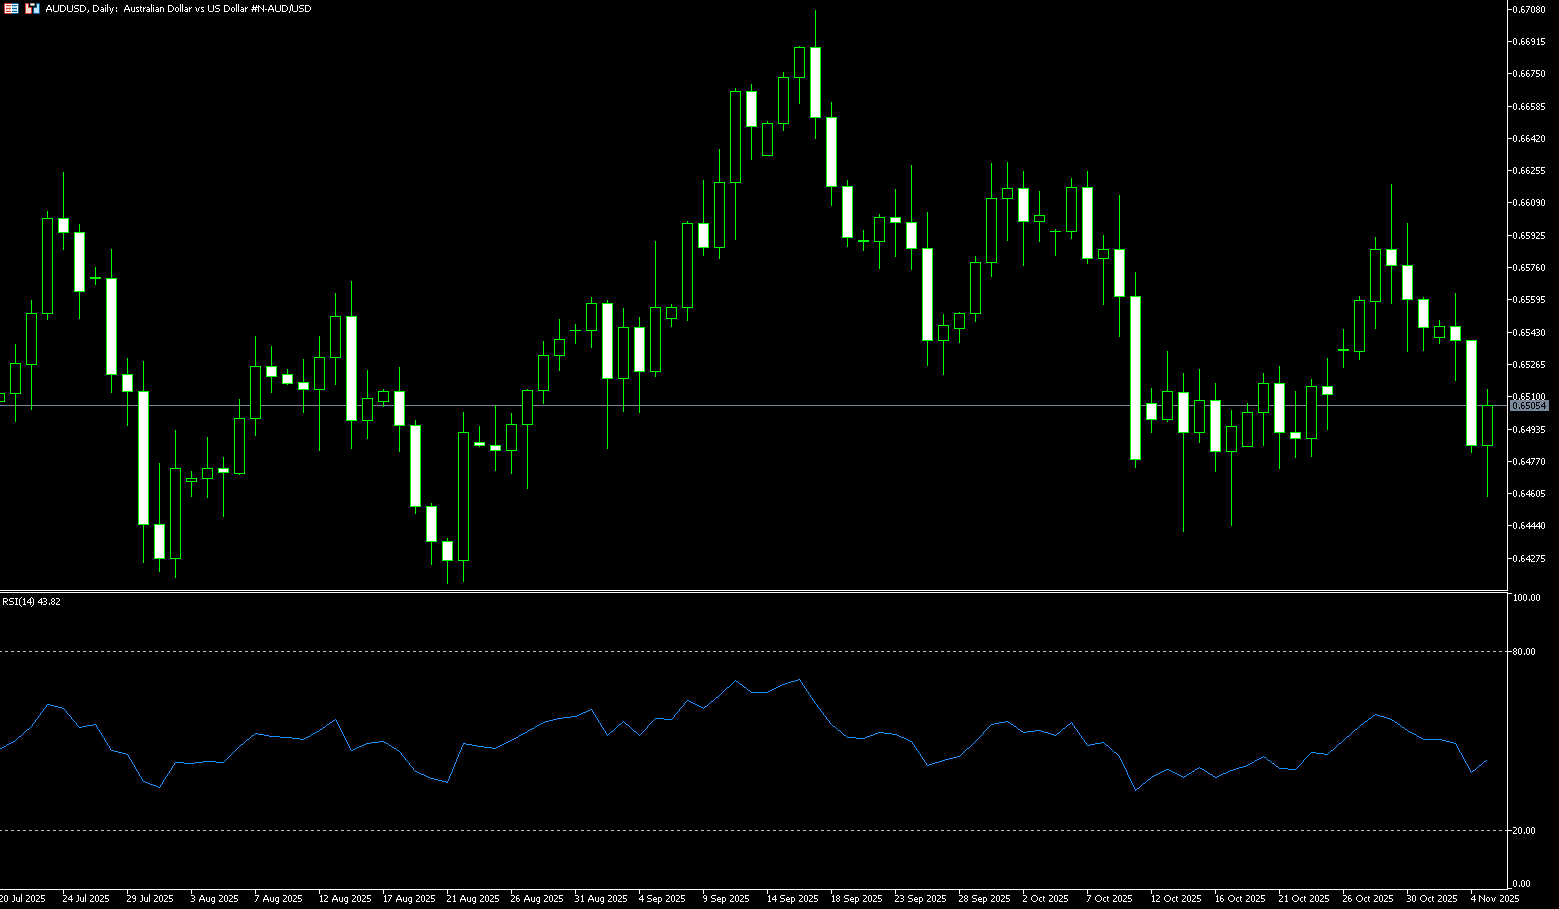
The Australian dollar fell to around $0.6458 against the US dollar on Wednesday, extending its recent downtrend to its lowest level in 11 weeks, before rebounding above $0.6500, as widespread risk aversion in global markets outweighed the Reserve Bank of Australia's hawkish policy outlook. The RBA kept interest rates unchanged at 3.6% in November as expected, citing persistent inflationary pressures. The RBA Governor indicated limited room for further rate cuts, and the market currently sees only a low probability of rate cuts this year, suggesting the cycle may have ended. However, the central bank's hawkish stance has so far failed to boost the currency, with traders instead focusing on deteriorating risk sentiment. Global markets have become cautious following a sharp decline in US tech stocks and renewed valuation warnings from major bank executives, raising concerns about a potential market correction. The Australian dollar faces further pressure as opinions diverge on whether the US will raise interest rates in December.
The AUD/USD exchange rate remains trapped in the 0.6400-0.6600 range, awaiting a clear catalyst, whether it's data from China, the Fed's next move, the RBA's statements, or broader changes in the US-China trade context. Currently, the 14-day Relative Strength Index (RSI) has declined further, approaching 45, indicating further downside potential. The Australian dollar continues to weaken near two-week lows, and selling pressure could push the AUD/USD to retest the key 200-day simple moving average at 0.6446, slightly above the October baseline of 0.6440 (October 14). Further declines could pave the way for a drop to the August low of 0.6414 (August 21), followed by a potential test of the June low of 0.6372 (June 23). On the other hand, occasional bullish attempts could challenge the 9-day simple moving average at 0.6538. A break above this level could lead the pair towards 0.6597 (October 30 high) and 0.6600 (psychological level), followed by the October 1 high at 0.6630.
Consider going long on the Australian dollar today at 0.6495, with a stop-loss at 0.6482 and targets at 0.6550 and 0.6540.
GBP/USD
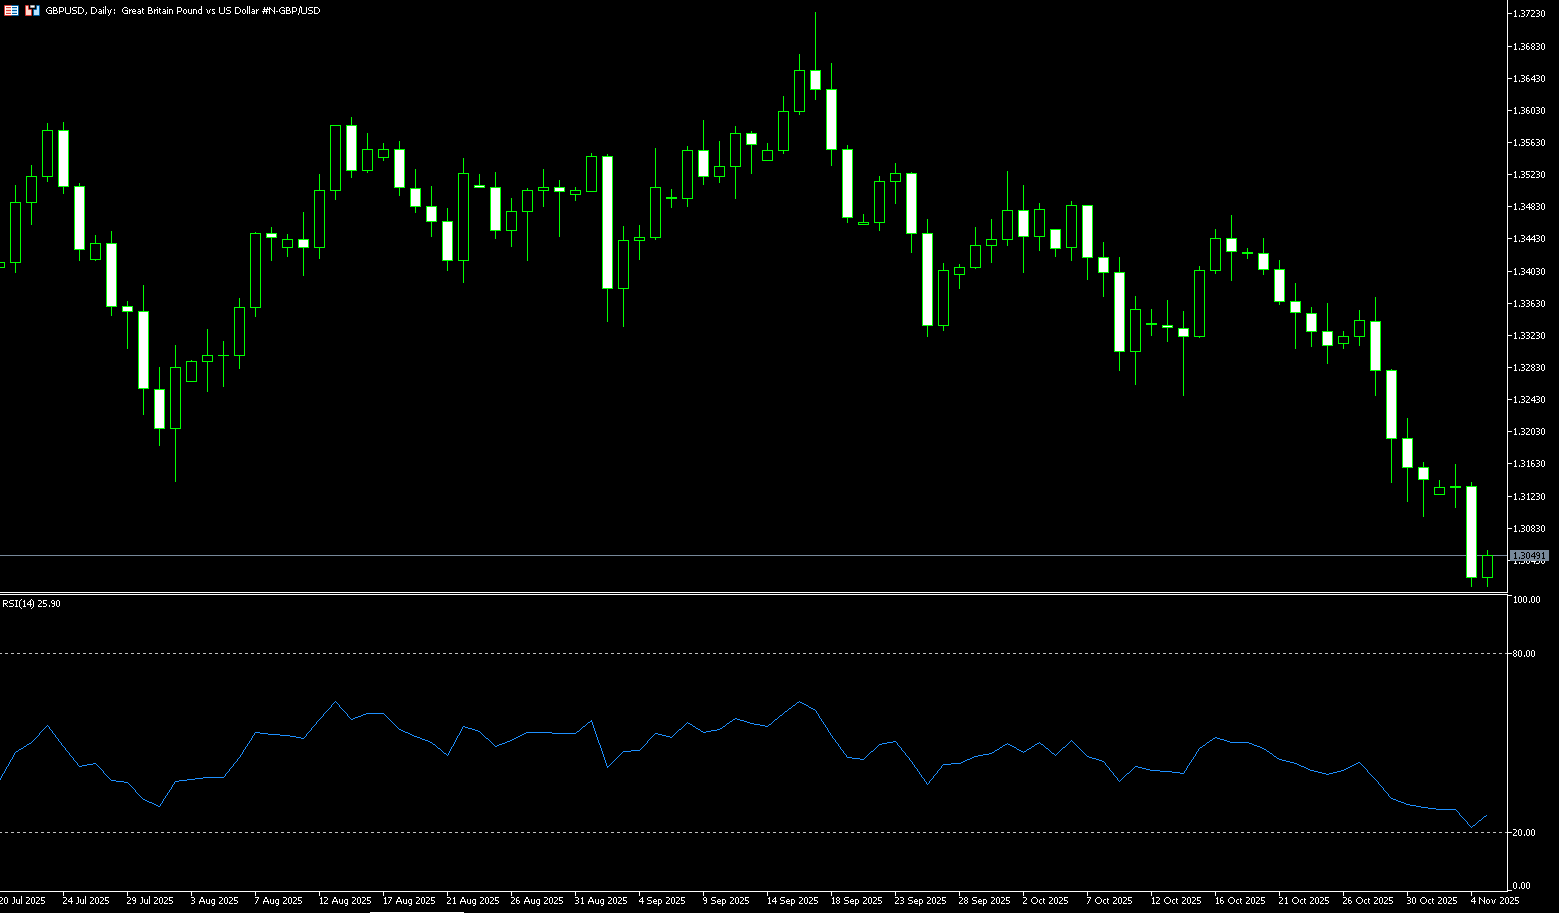
GBP/USD rose slightly to around 1.3050 during Wednesday's European session. However, upside potential for the pound is capped by the upcoming UK autumn budget. Chancellor of the Exchequer Rachel Reeves stated clearly on Tuesday that the budget will include a wide range of tax measures, expected to involve over 100 possible tax and spending options, with a focus on high-income groups. Reeves emphasized that her fiscal rules are "ironclad," meaning that market expectations of tax increases may limit further gains in the pound in the short term. The UK autumn budget will be announced on November 26th, and the pound/dollar exchange rate may continue to be under pressure until then. Meanwhile, the Bank of England is about to hold its interest rate meeting, with the market widely expecting it to maintain the key interest rate at 4.0%. However, due to the uncertainty surrounding fiscal policy, some believe the Bank of England may observe the effects of the tax reform before deciding on its interest rate direction. This uncertainty further increases the short-term volatility risk for the pound/dollar exchange rate.
The recent movement of the pound/dollar exchange rate has been mainly due to the continued strengthening of the US dollar, which has pressured the exchange rate lower. However, the upside potential is limited. If the budget clearly indicates tax increases or US economic data is stronger than expected, the pound may come under pressure and fall back. Positions should be adjusted flexibly based on the dollar's performance, UK fiscal policy, and US economic data. From a technical perspective, a mild rebound is expected in the short term, as the 14-day Relative Strength Index (RSI) has further declined, approaching the oversold level of 26, but this suggests room for a technical rebound in the future. The currency pair maintains a mild bullish structure in the short term, but may face resistance at the 300-day simple moving average of 1.3097 and the psychological level of 1.3100. Support lies around the psychological level of 1.3000; a break below this level could lead to a short-term pullback to the psychological level of 1.2900, paving the way for a further decline in the pound.
Today, consider going long on GBP at 1.3040, with a stop-loss at 1.3030 and targets at 1.3080 and 1.3090.
USD/JPY
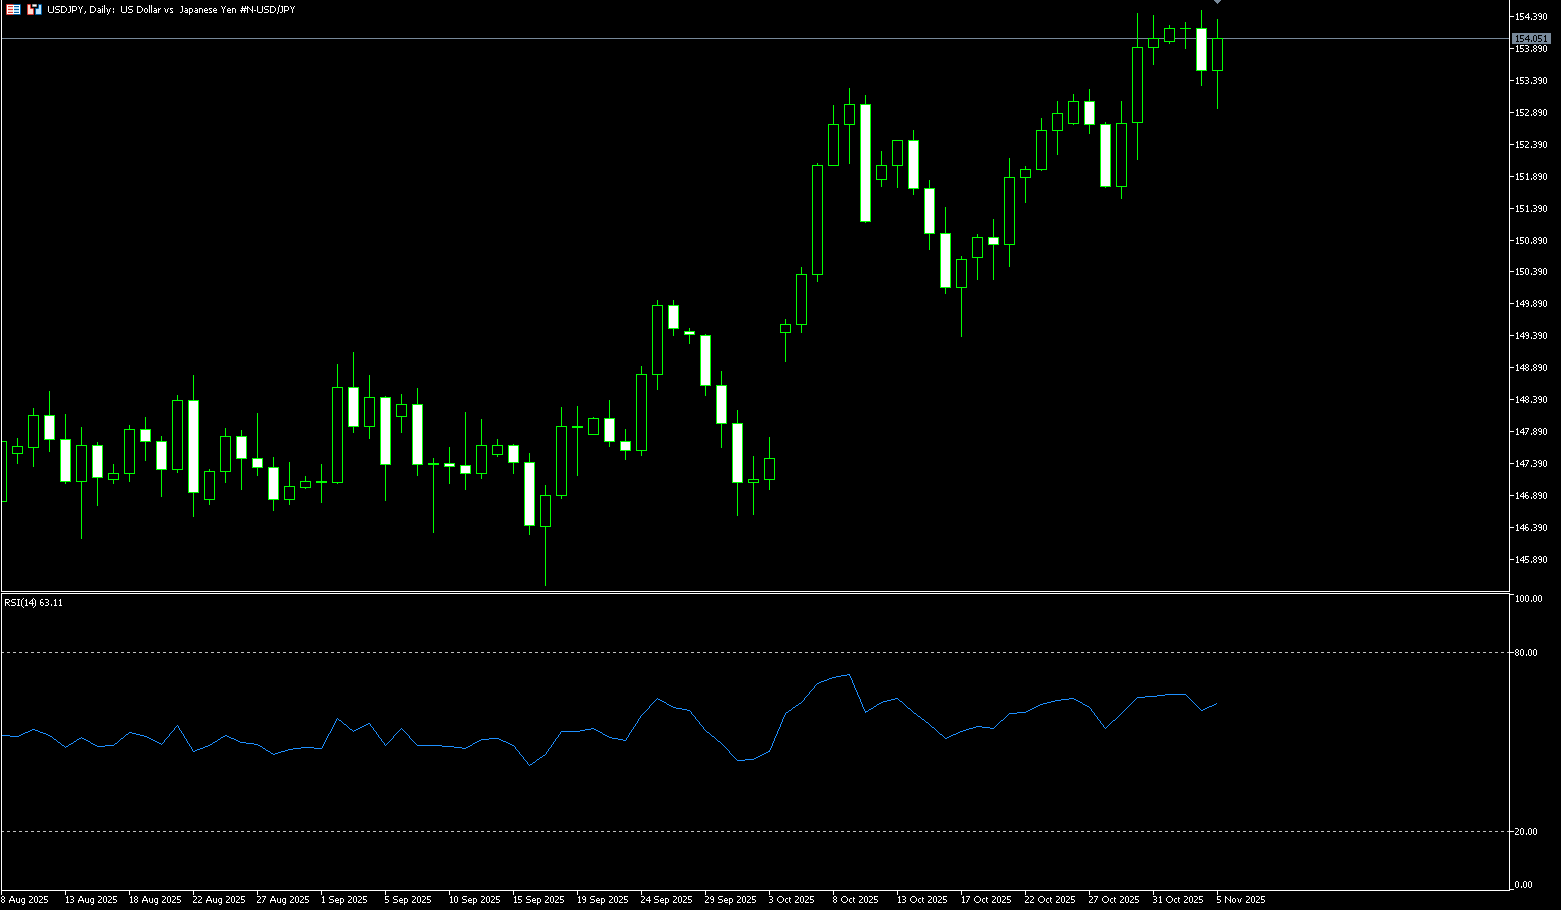
On Wednesday, the yen appreciated against the dollar to around 153.80, extending gains from the previous session, as a surge in global risk asset sell-offs increased safe-haven demand. Global equities and other risk assets were pressured by heightened concerns about overvalued artificial intelligence, while warnings of a potential market correction further dampened risk appetite. The yen also received renewed verbal support, with Finance Minister Rika Katayama reiterating that the authorities are closely monitoring exchange rate fluctuations and warning against sharp one-sided movements. Meanwhile, Takashi Mayor Sanae Takaichi pointed out that Japan has not yet achieved sustainable inflation supported by wage growth, indicating caution regarding further interest rate hikes. Investors are now awaiting key economic data this week, including wage and household spending figures, for further insight into the Bank of Japan's policy direction.
From a technical perspective, the strong break above 154.00 after last week's breach of the resistance zone between 153.00 (psychological level) and 153.34 (9-day simple moving average) is considered a key trigger for the USD/JPY bulls. Furthermore, the oscillator on the daily chart remains firmly in positive territory (61.80) and far from overbought territory. This, in turn, supports the possibility of a break above 154.50 (Tuesday's high), the intermediate resistance level, towards reclaiming the psychological level of 155.00. A break above this level would target 155.88 (February 3rd high). On the other hand, any corrective pullback currently appears to be finding some support near the 15300 level, with the next resistance level at 152.39 (20-day simple moving average) turning into support, as well as the psychological level of 152.00.
Today, consider shorting the US dollar at 154.30. Stop loss: 154.50. Target: 153.50.
EUR/USD
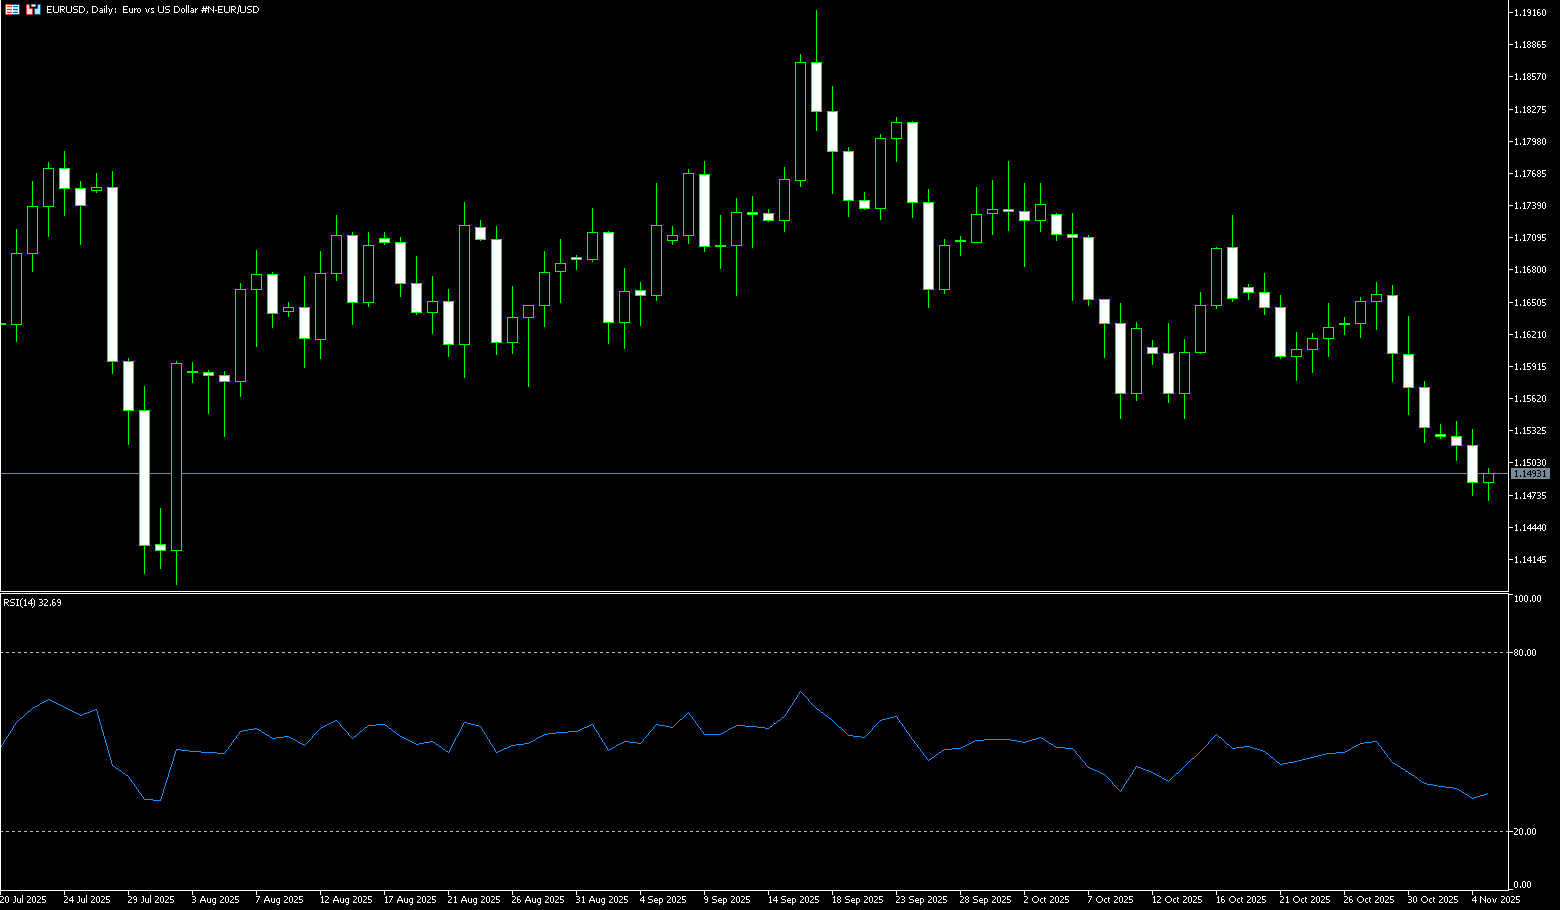
The euro/dollar pair traded around 1.1490 during Wednesday's Asian session, ending a five-day downtrend. The euro gained support as traders anticipated a cautious stance from the European Central Bank (ECB) at its upcoming policy meeting. The ECB decided to keep interest rates unchanged for the third consecutive time at its October policy meeting last week. The central bank noted that the inflation outlook was generally stable and the economy continued to grow, but uncertainty remained. Inflation and growth risks in the Eurozone were more balanced. Kazaks added that the central bank would act if necessary, but should avoid hasty reactions. The dollar faces some challenges amid the ongoing US government shutdown. The stalemate has entered its sixth week and is expected to become the longest federal funding disruption in US history, after the Senate again failed to pass a short-term funding bill. The most recent attempt to resolve the stalemate with Republican-backed temporary legislation was rejected by the Senate for the 14th time on Tuesday.
Currently, the euro/dollar pair remains range-bound, searching for a clear catalyst. A more dovish Federal Reserve, improved global risk appetite, or signs of increased demand for Eurozone assets could finally give this currency pair a breather—but until then, the strength of the US dollar will continue to dominate the market. A continuation of the bearish trend should prompt EUR/USD to retarget the 1.1400 area in the short term. Additional downside should break the November low of 1.1473 (November 4th). A break above this area could lead to a visit to the August low of 1.1391 (August 1st), followed by the important 200-day simple moving average at 1.1327. Conversely, immediate resistance lies at the weekly high of 1.1533 (Wednesday's high), followed by the October high of 1.1568 (9-day simple moving average). If the bulls exert further pressure, the psychological level of 1.1600 should become the focus.
Consider going long on EUR/USD today at 1.1478, with a stop loss at 1.1465 and targets at 1.1530 and 1.150.
Disclaimer: The information contained herein (1) is proprietary to BCR and/or its content providers; (2) may not be copied or distributed; (3) is not warranted to be accurate, complete or timely; and, (4) does not constitute advice or a recommendation by BCR or its content providers in respect of the investment in financial instruments. Neither BCR or its content providers are responsible for any damages or losses arising from any use of this information. Past performance is no guarantee of future results.
More Coverage


Risk Disclosure:Derivatives are traded over-the-counter on margin, which means they carry a high level of risk and there is a possibility you could lose all of your investment. These products are not suitable for all investors. Please ensure you fully understand the risks and carefully consider your financial situation and trading experience before trading. Seek independent financial advice if necessary before opening an account with BCR.
BCR Co Pty Ltd (Company No. 1975046) is a company incorporated under the laws of the British Virgin Islands, with its registered office at Trident Chambers, Wickham’s Cay 1, Road Town, Tortola, British Virgin Islands, and is licensed and regulated by the British Virgin Islands Financial Services Commission under License No. SIBA/L/19/1122.
Open Bridge Limited (Company No. 16701394) is a company incorporated under the Companies Act 2006 and registered in England and Wales, with its registered address at Kemp House, 160 City Road, London, City Road, London, England, EC1V 2NX. This entity acts solely as a payment processor and does not provide any trading or investment services.

 English
 简体中文
简体中文
 繁體中文
繁體中文
 Bahasa
Melayu
Bahasa
Melayu
 Tiếng
Việt
Tiếng
Việt
 ไทย
ไทย
 日本語
日本語
 한국어
한국어
 ភាសាខ្មែរ
 español