


0
US Dollar Index
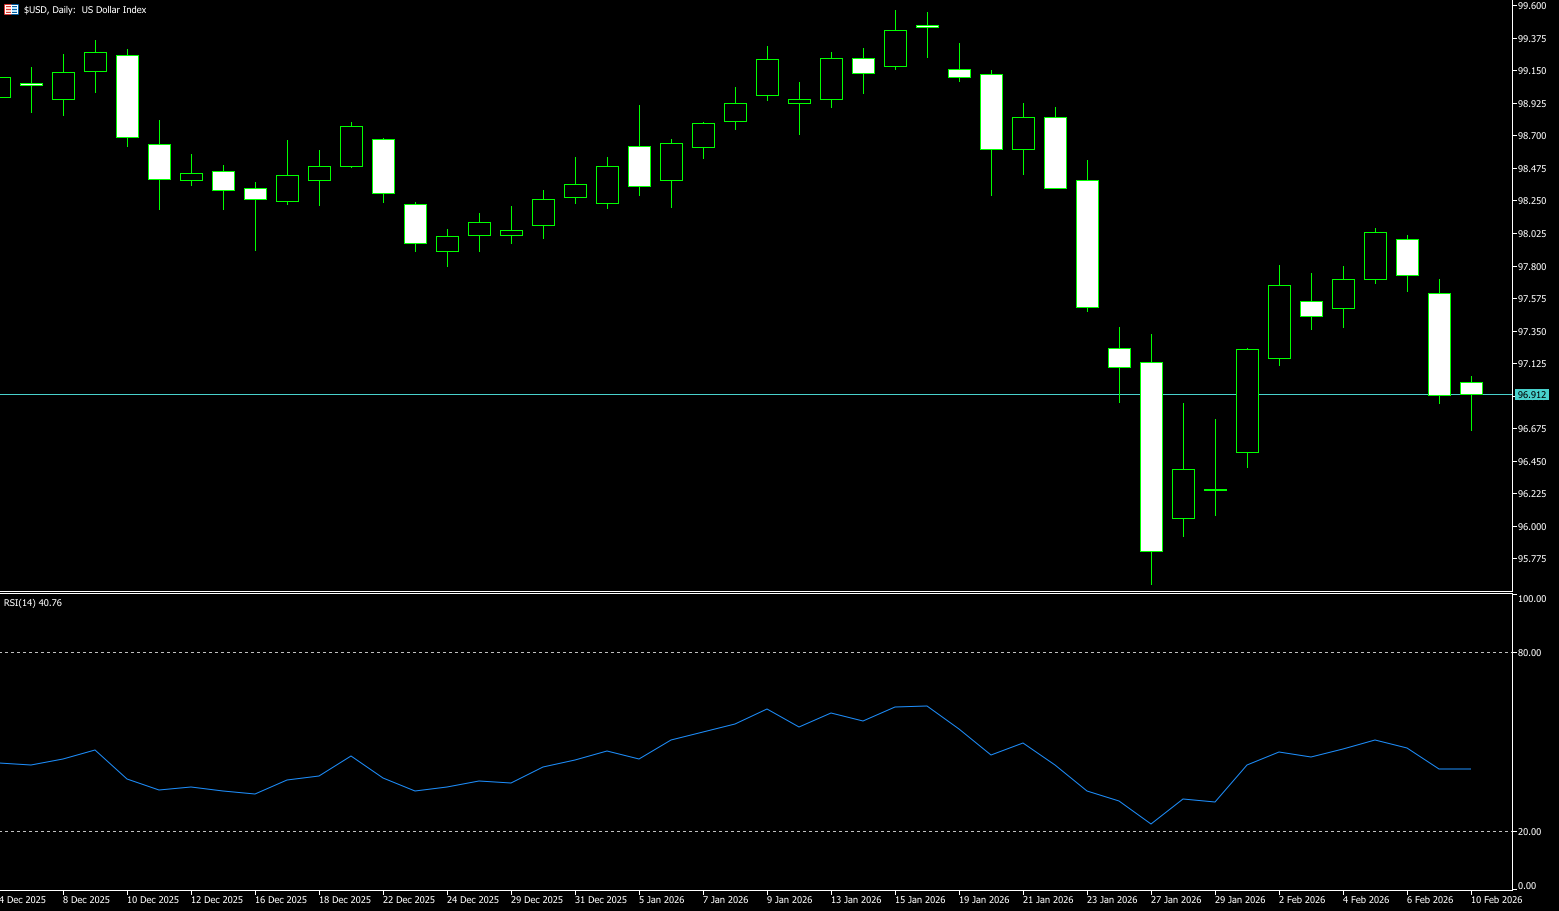
The US dollar index fell to around 96.82 on Tuesday, after declining by more than 1% in the previous two trading days, as weak US economic data strengthened market expectations for a Federal Reserve rate cut. A weaker-than-expected retail sales report showed that consumer spending stagnated in December, further reinforcing the view of slowing economic growth and supporting the case for policy easing. The currency market now prices a higher probability of three Fed rate cuts in 2026, compared to two cuts expected a week ago. Investors are turning to upcoming US employment and inflation data for further signals on the economic outlook and policy path. The dollar also faced pressure from external demand due to reports that Chinese regulators advised financial institutions to limit their holdings of US Treasury bonds to reduce concentration risk and mitigate uncertainty surrounding US economic policy.
The overall outlook and daily chart pattern suggest that the US economy still possesses a certain degree of resilience, sufficient to prevent a significant collapse in the exchange rate from current levels. Technically, the main trend for the US dollar index is downward. The price hit a new low at the beginning of the week, making 97.97 a new secondary high. A break above this level would reverse the main trend to upward; a break below 95.56 (the previous low) would confirm a continuation of the downtrend. The medium-term trading range is 99.50 to 95.56. The new short-term range is 95.56 (the previous low) to 97.73 (the 20-day moving average). 97.00 (the psychological level) and 95.56 (the previous low) are the next downside targets; attention should be paid to whether the price experiences a technical rebound or breaks down directly. It should also be noted that the US dollar index is currently trading weakly below the 20-day moving average (97.73) and the psychological level of 98.00, confirming the bearish tone.
Today, consider shorting the US Dollar Index around 96.96; Stop loss: 97.08; Target: 96.50; 96.40
WTI Crude Oil
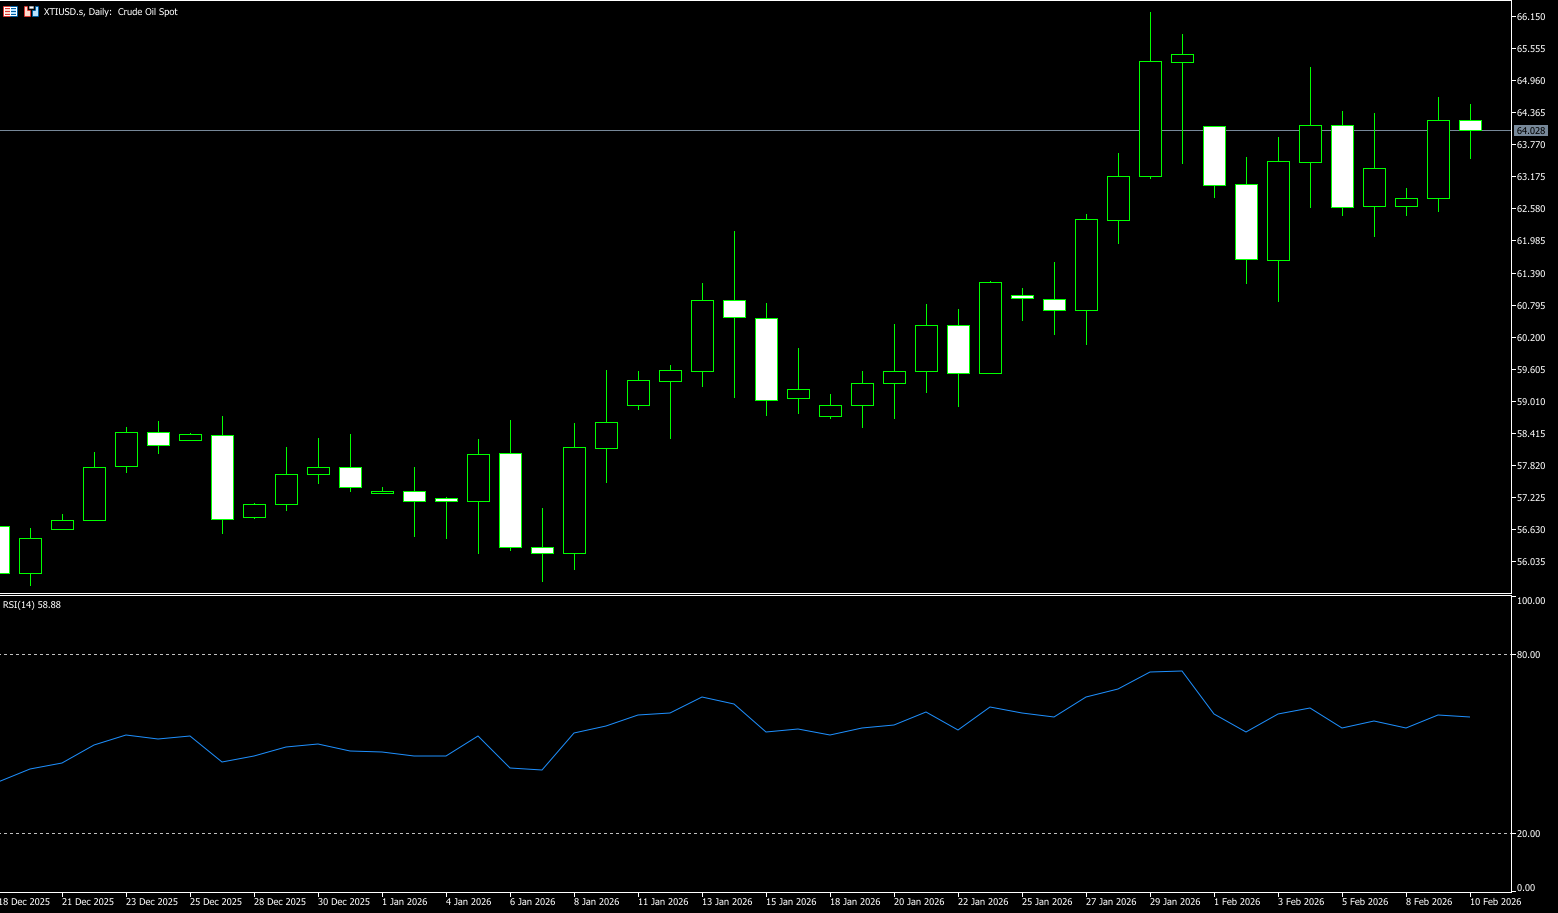
WTI crude oil started the week trading around $64.50 per barrel. Oil prices rose more than 1% on Monday, mainly driven by geopolitical tensions. At the start of the new week, WTI crude oil prices weakened slightly as easing signals from US-Iran negotiations reduced the probability of military conflict and supply disruptions, leading to a decline in geopolitical risk premiums. However, against the backdrop of a weaker dollar and continued US pressure on Iranian energy trade, the downside for oil prices was somewhat limited. Technically, WTI has entered a short-term correction phase, but key support areas continue to provide support. With the probability of military conflict in the Middle East decreasing, concerns about severe disruptions to crude oil supply have eased. Oil prices briefly dipped during the Asian session but subsequently rebounded from their lows and are currently fluctuating around $64. The easing of tensions between the US and Iran remains limited, and policy risks persist, thus limiting further downside potential for oil prices. Furthermore, the overall weakening of the US dollar also provides some support for oil prices.
From a daily chart perspective, WTI crude oil failed to break through the high of around $66.25 last month and subsequently entered a technical correction phase. Currently, the price has fallen back to around $64, remaining within a medium-term trading range. Momentum indicators show that the daily RSI has fallen from its high to the neutral zone, indicating that the current correction is primarily a technical adjustment rather than a trend reversal. On the downside, $63.00 forms the first key support level, a recent area of concentrated closing prices and a short-term support/resistance level. If this level is breached, the second support level to watch is the $62.00-$62.20 range, which corresponds to the previous correction low. A decisive break below this level could accelerate the decline and open up further downside potential. On the upside, $64.50 is the first short-term resistance level, which, combined with short-term moving average resistance, limits the upside potential. If oil prices rebound and hold above this level, further resistance will target the $65.80-$66.25 range, which represents the previous high and is a key resistance zone in the current consolidation structure.
Consider going long on crude oil around $64.35 today; Stop loss: $64.13; Target: $65.60; $65.80
Spot Gold
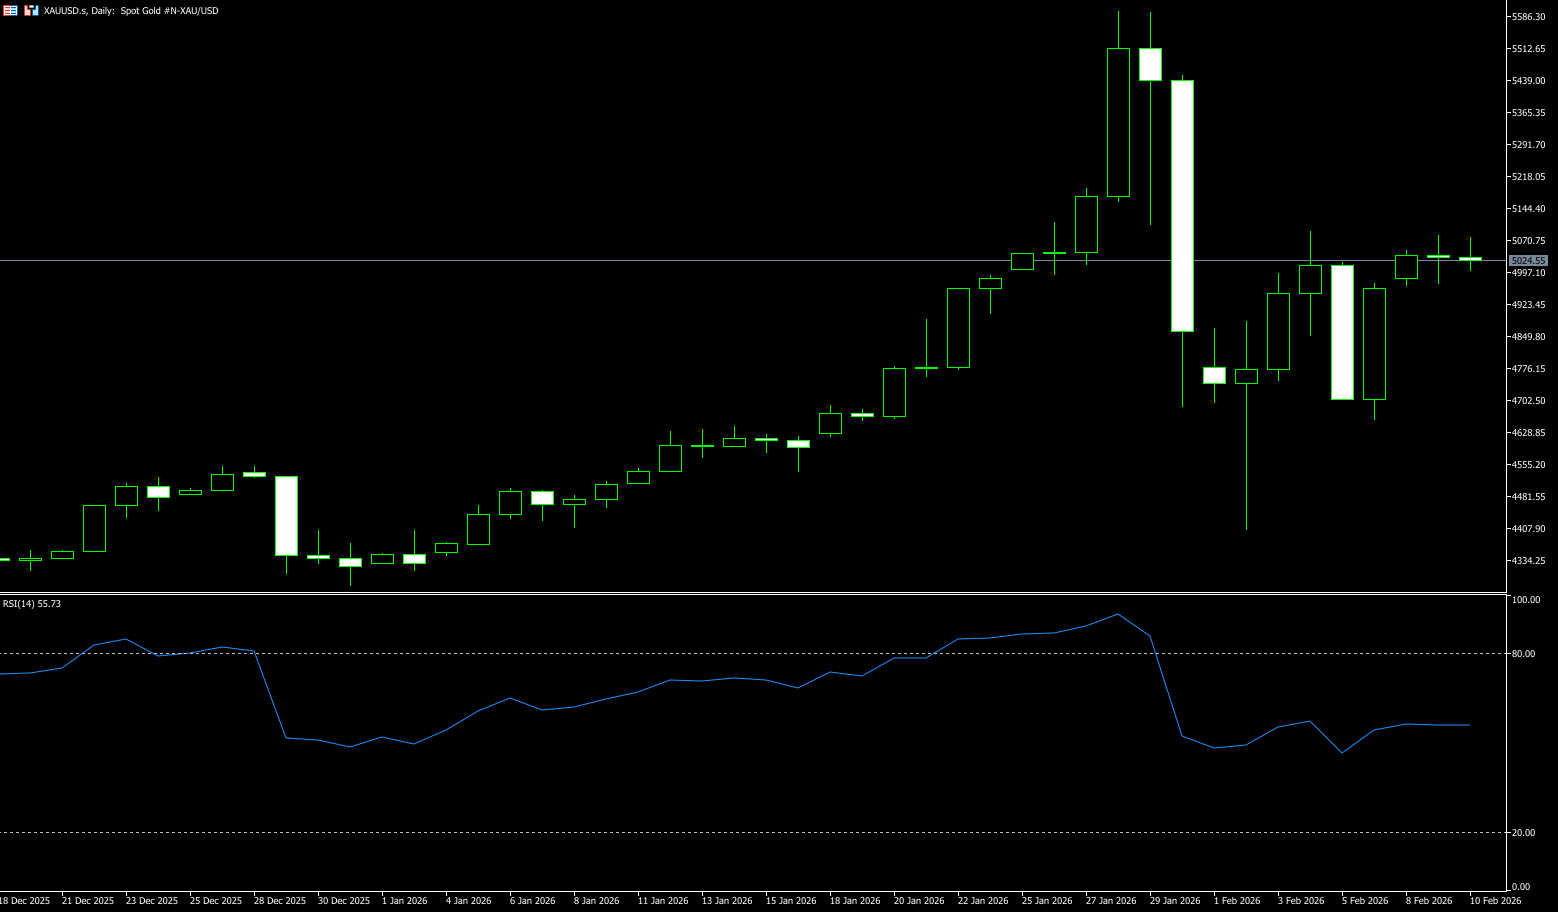
On Tuesday morning in European trading, spot gold traded around $5040 per ounce. Gold prices rose significantly on Monday, mainly driven by a weaker dollar. Market focus shifted to upcoming US employment and inflation data for clues about monetary policy. The market expects potentially weak US economic data, especially in the employment sector. Investors are closely watching the non-farm payrolls, consumer price index, and initial jobless claims data to be released later this week for guidance on the interest rate path. The market has already priced in at least two rate cuts in 2026. The People's Bank of China continued to increase its gold reserves, reaching 74.19 million ounces at the end of January, marking the 15th consecutive month of growth. This is seen as a significant stabilizing force in the market, with official gold purchases providing structural support for gold prices. The Middle East geopolitical situation became a key turning point for the rebound in gold's safe-haven demand. Although the indirect negotiations between the US and Iran regarding the Iranian nuclear issue were successfully held and concluded, they ultimately failed to reach an effective consensus on the long-standing interests of both countries, only temporarily easing tensions. Coupled with the unusual movements of the Pentagon Pizza Index on Saturday and Sunday, which sparked market speculation, this contributed to Friday's surge in gold prices.
The daily chart shows that gold's ability to hold above the $5,000 mark is primarily due to the dual support of the rigid demand from central bank gold purchases and expectations of a Fed rate cut. On the other hand, the significant contraction in liquidity has made it difficult for gold bulls to form an effective upward momentum, which is also the core reason for the current weakness in gold prices. However, in the short term, gold prices are likely to continue to consolidate around the $5,000 mark. From a technical perspective, gold prices have now stabilized above the key psychological level of $5,000. Short-term pullbacks to the $4,911 (20-day moving average) and the $4,800 range are still seen as valuable buying opportunities. If a breakout above the $5,100 (psychological level) resistance is achieved, the next target will be $5.182 (January 27 high). In the medium to long term, gold prices may even challenge the historical high near $5,600 again.
Today, consider going long on gold around $5,038; Stop loss: $5,030; Target: $5,100; $5,130
AUD/USD
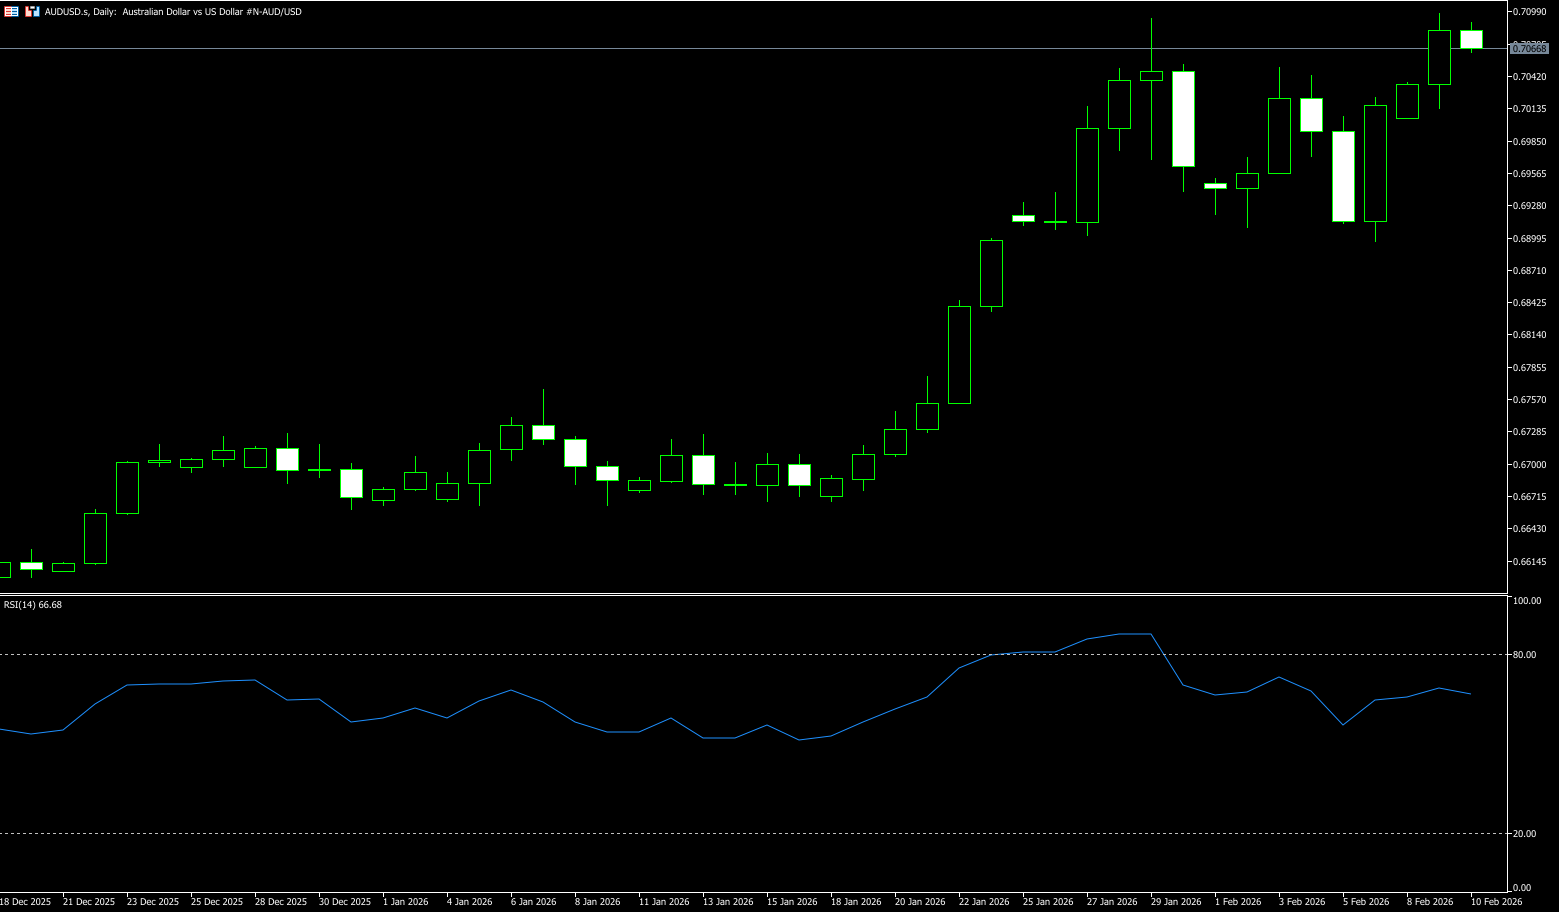
On Tuesday during the European session, the AUD/USD pair remained weak after two days of gains, trading around 0.7075. Mixed domestic data led to a deterioration in market sentiment, weakening the Australian dollar and putting pressure on the pair. Westpac's consumer confidence index fell 2.6% month-over-month in February to a 10-month low of 90.5, impacted by a 25-basis-point interest rate hike, the first in over two years. Meanwhile, the NAB business confidence index rose to 3 in January from a downwardly revised 2, reaching its highest level since October. Investors are awaiting the delayed January US jobs report and upcoming CPI data, which are expected to influence views on economic cooling and the timing of potential Federal Reserve easing. US Treasury Secretary Bessenter on Thursday did not rule out a criminal investigation into Kevin Warsh, President Donald Trump's nominee for Federal Reserve chair, should he refuse to cut interest rates.
The Australian dollar/US dollar pair traded near a three-year high after breaking above the psychological level of 0.7000, its first such move since February 2023. The daily chart shows the pair in a clear uptrend, holding above the 9-day simple moving average at 0.7013 and the psychological level of 0.7000. After hitting a high of 0.7094 on January 29, prices retreated to the 0.6960 area over the weekend as safe-haven inflows and a sell-off in tech stocks pressured the commodity-linked Australian dollar. On Monday, renewed buying pushed AUD/USD up to 0.7098, then to 0.7138 (the October 2022 high), followed by the 0.7200 psychological level. On the downside, the first support level is 0.7000 (the psychological level). Further major support lies at the 14-day simple moving average level of 0.6985.
Consider going long on AUD/USD today near 0.7060; Stop loss: 0.7050; Target: 0.7120; 0.7140
GBP/USD
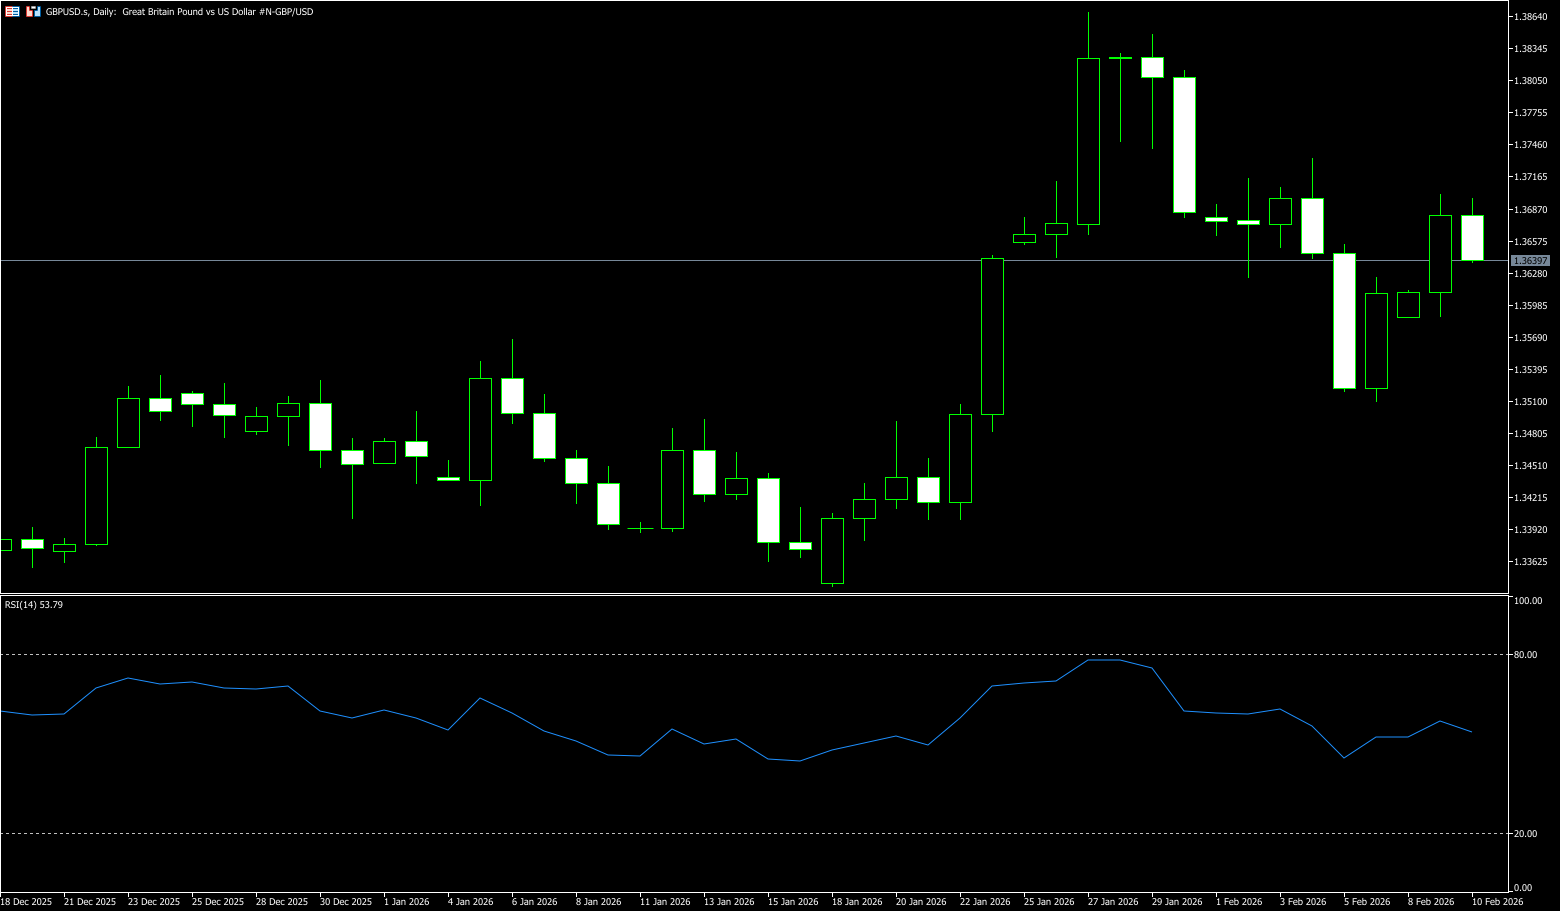
The pound sterling saw a strong rebound against the dollar at the start of the week. Although the Bank of England's decision last week initially pressured the pound, market sentiment quickly recovered, and the exchange rate has largely regained its losses. From a price structure perspective, the pound/dollar pair is at a crucial observation window. The previous rally reached a high of 1.3869 before quickly retreating to around 1.3508, indicating heavy selling pressure and concentrated profit-taking by short-term traders. Currently, the exchange rate is around 1.3680, precisely at the midpoint of the previous pullback range, where bulls and bears are locked in a tug-of-war, and the direction remains unclear. Technical indicators also confirm this oscillating pattern: the MACD indicates that momentum has retreated from its highs and remains in a consolidation phase; the RSI is around 57, in a neutral-to-strong range, consistent with the volatile market. On the upside, watch the 1.3700 level and maintain hope of testing the February 4 high of 1.3734, with a target of 1.3800. On the downside, pay attention to 1.3620 (the 18-day moving average) and 1.3600 (the psychological level).
Today, consider going long on GBP around 1.3648; Stop loss: 1.3635; Target: 1.3720; 1.3730
USD/JPY
USD/JPY fell to near 155.20 during Tuesday's European session. The yen strengthened against the dollar after Prime Minister Sanae Takaichi's ruling Liberal Democratic Party (LDP) achieved a historic landslide victory. Traders are preparing for upcoming US economic data that could provide further clues about the Federal Reserve's monetary policy. Takaichi's LDP secured a sweeping victory in Sunday's election. This news, coupled with verbal intervention from Japanese officials, provided some support for the yen and created resistance for the pair. Japan's chief currency official, Atsushi Mimura, stated that the government remains highly vigilant in monitoring the foreign exchange market. Federal Reserve Governor Stephen Milan said on Monday that a weaker dollar is not currently a major problem for central banks. "I don't think it has had a substantial impact on monetary policy," he said. On Wednesday, focus will shift to the delayed January jobs report. Any signs of improvement in the US labor market could help limit the dollar's losses in the short term.
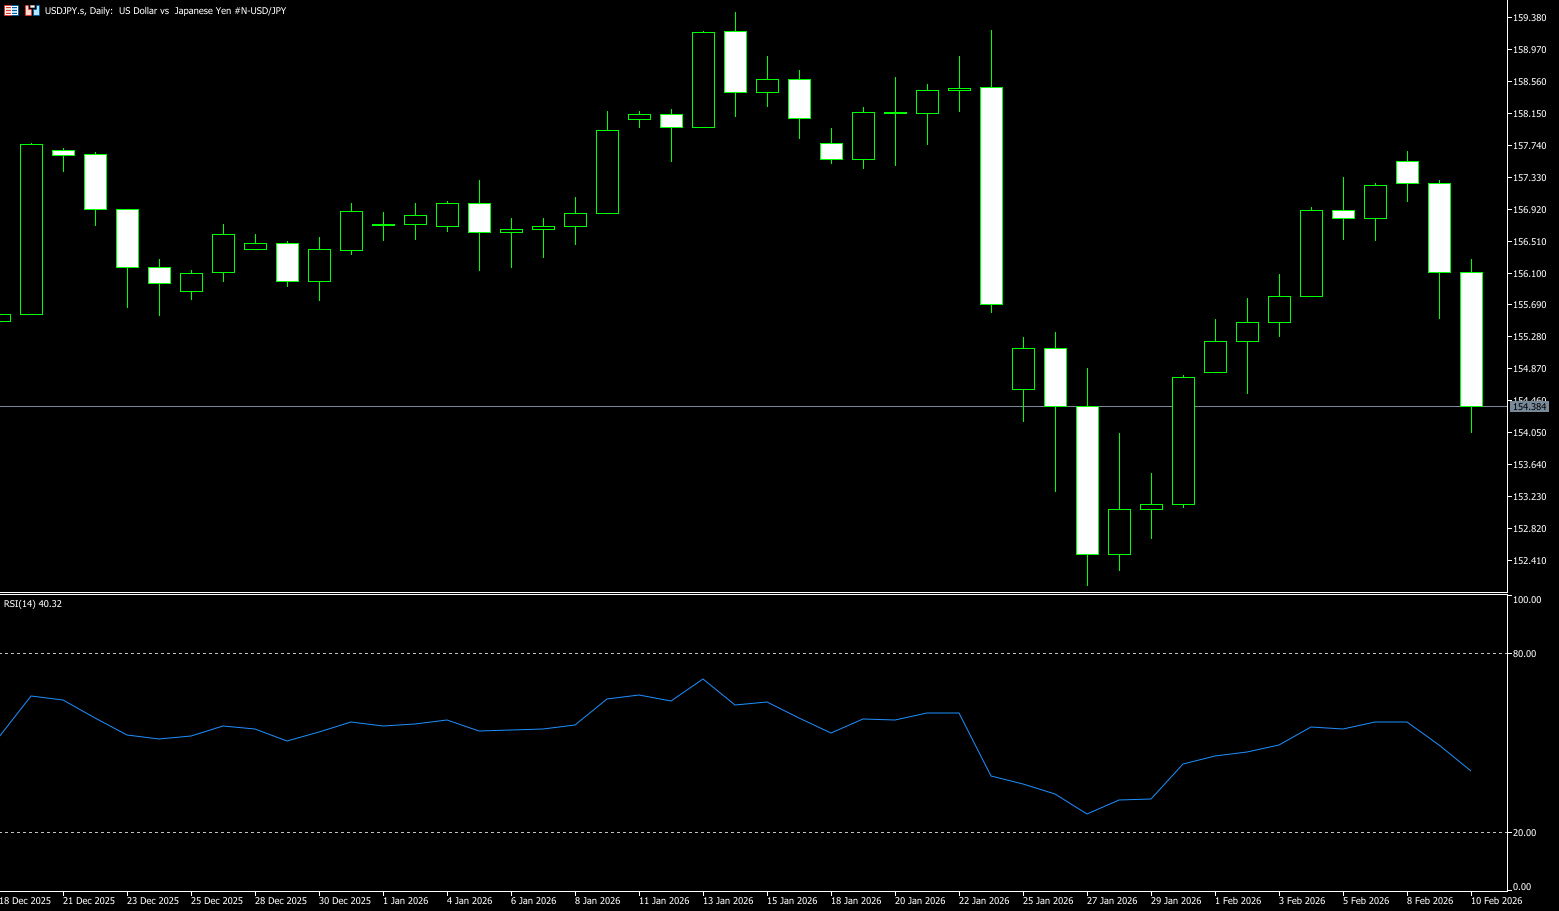
Sanae Takashi's victory did not accelerate the yen's depreciation; instead, the yen exhibited a "sell the news" pattern, with the USD/JPY pair falling instead of rising. Currently, the USD/JPY exchange rate has failed to hold the key level of 156.90, which is now acting as resistance. The USD/JPY pair has shown some resilience near the 16-day simple moving average at 155.80 and paused its intraday pullback near the 156.30 area (Tuesday's high). The latter should now be a key pivot point for intraday traders. The MACD indicator shows a bearish crossover near the zero line, and with momentum turning negative, it suggests increasing downward pressure. The Relative Strength Index (RSI) is at 47, below the 50 midline, reflecting weak momentum. Meanwhile, the pair remains above the 100-day simple moving average at 154.60 and the 154.00 area (psychological level), maintaining a near-term upward bias and providing dynamic support nearby. Regarding the resistance levels, the first target is 156.35 (50-day simple moving average), followed by 157.66 (Monday's high).
Consider shorting the US dollar near 155.50 today; stop loss: 155.70; target: 154.50; 154.30
EUR/USD
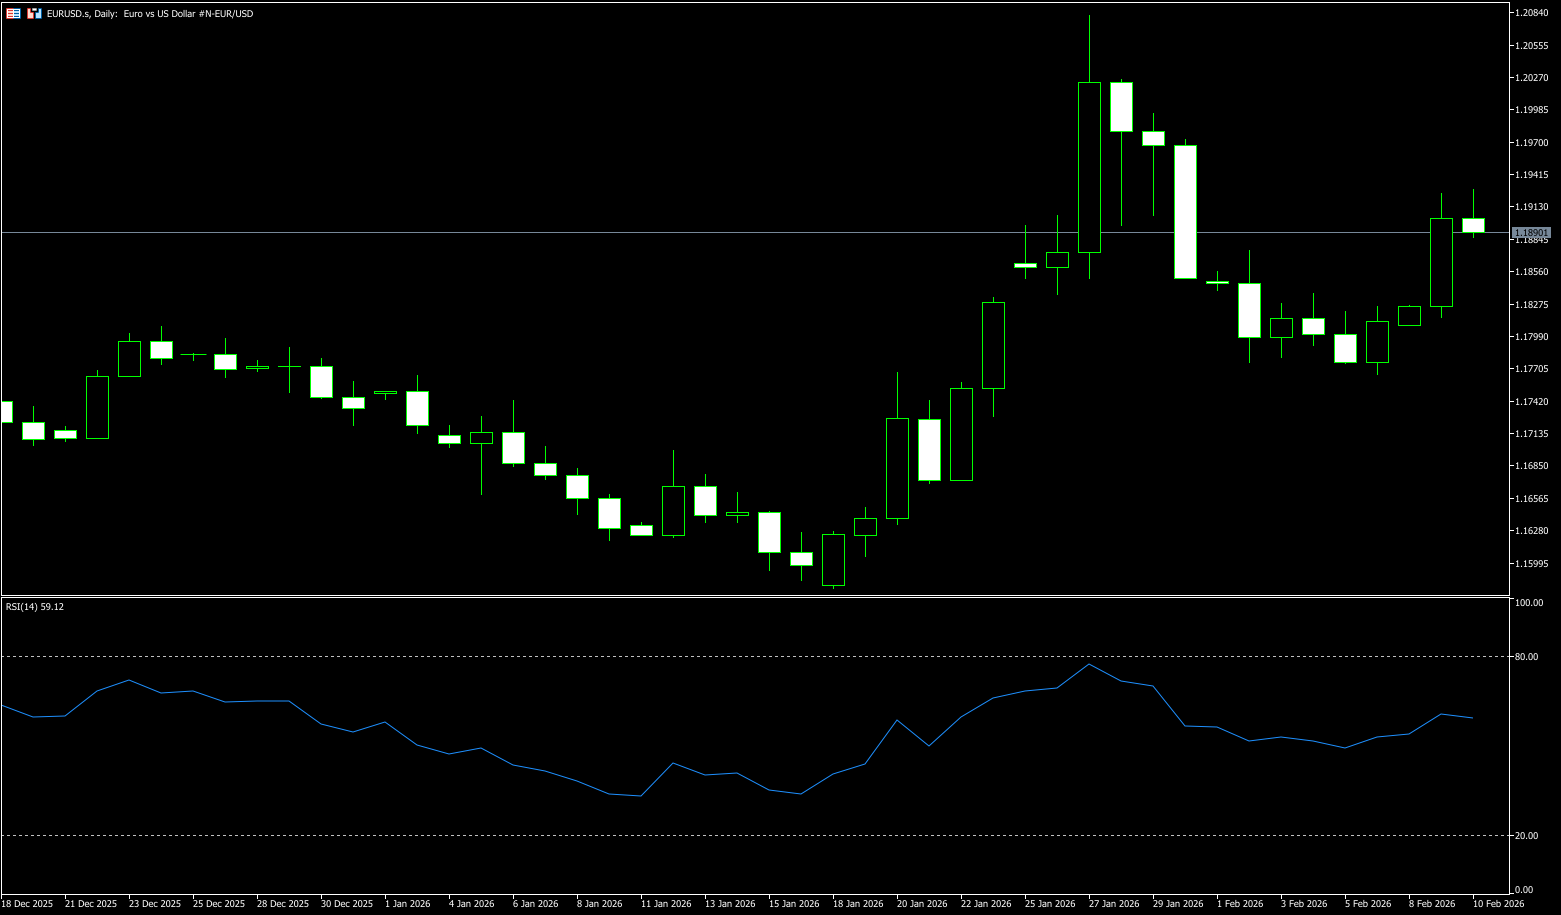
The EUR/USD pair is consolidating its strong gains over the past two days during Tuesday's European session, fluctuating within a narrow range. The spot price is currently trading near 1.1900, slightly below the more than one-week high reached the previous day. The US dollar has recovered some of its losses from the previous day's sharp decline, falling to a six-day low and becoming a major headwind for the EUR/USD pair. However, given the market's widespread acceptance of two more rate cuts by the Federal Reserve this year, any meaningful dollar appreciation seems unlikely. Furthermore, the current risk-averse environment may limit the upside potential for the safe-haven dollar. Meanwhile, Chinese regulators have advised financial institutions to reduce their holdings of US Treasury bonds to address concerns about concentration risk and market volatility. This, in turn, benefits dollar bears. Furthermore, the relatively hawkish outlook from the European Central Bank should favor the euro and further support the EUR/USD pair.
Currently, the EUR/USD pair is primarily driven by US developments rather than any news from the Eurozone. Any upward movement is likely to remain slow rather than escalate into a clear and decisive breakout. On the upside, the 1.2000 level is likely to come under scrutiny again in the near future. A break above this area could see the pair attempt to move towards the 2026 high of 1.2082, which dates back to January 28th, followed by the peak of 1.2266 on May 25th, 2021. On the downside, initial support lies at the 14-day moving average of 1.1863. A break below this level would expose the psychological level of 1.1800. Momentum indicators remain constructive. The Relative Strength Index (RSI) is approaching the low 60 range, while the Directional Movement Index (DPI) above 31 points to a fairly solid underlying trend.
Consider going long on the Euro today around 1.1890; Stop loss: 1.1880; Targets: 1.1950, 1.1960
Disclaimer: The information contained herein (1) is proprietary to BCR and/or its content providers; (2) may not be copied or distributed; (3) is not warranted to be accurate, complete or timely; and, (4) does not constitute advice or a recommendation by BCR or its content providers in respect of the investment in financial instruments. Neither BCR or its content providers are responsible for any damages or losses arising from any use of this information. Past performance is no guarantee of future results.
More Coverage


Risk Disclosure:Derivatives are traded over-the-counter on margin, which means they carry a high level of risk and there is a possibility you could lose all of your investment. These products are not suitable for all investors. Please ensure you fully understand the risks and carefully consider your financial situation and trading experience before trading. Seek independent financial advice if necessary before opening an account with BCR.
BCR Co Pty Ltd (Company No. 1975046) is a company incorporated under the laws of the British Virgin Islands, with its registered office at Trident Chambers, Wickham’s Cay 1, Road Town, Tortola, British Virgin Islands, and is licensed and regulated by the British Virgin Islands Financial Services Commission under License No. SIBA/L/19/1122.
Open Bridge Limited (Company No. 16701394) is a company incorporated under the Companies Act 2006 and registered in England and Wales, with its registered address at Kemp House, 160 City Road, London, City Road, London, England, EC1V 2NX. This entity acts solely as a payment processor and does not provide any trading or investment services.

 English
 简体中文
简体中文
 繁體中文
繁體中文
 Bahasa
Melayu
Bahasa
Melayu
 Tiếng
Việt
Tiếng
Việt
 ไทย
ไทย
 日本語
日本語
 한국어
한국어
 ភាសាខ្មែរ
 español