


0
USD
On Wednesday, December 6th, the ADP employment report for November in the United States recorded an increase of 103,000 people, marking the fourth consecutive month below expectations. Despite the weaker-than-expected non-farm payroll performance, the U.S. dollar index did not decline but instead rose, reaching a two-month high as the market speculated that the European Central Bank would likely cut interest rates as early as March next year. Since the middle of last week, the U.S. dollar index has been continuously rising and is currently trading just below 104.00.
A survey released at the beginning of the week indicated that most economists believe that even if the job market eventually softens under the pressure of high-interest rates, the U.S. economy may avoid a recession next year. This forecast implies that people believe the Federal Reserve can achieve a delicate balance, slowing the economy enough to control inflation without completely stifling economic growth. The U.S. dollar index fluctuated upward at the beginning of the week, challenging the 104.00 level and reaching a high near the previous 9 trading days.
Apart from the continuous short-covering providing support to the index, strong economic data from the United States during this period has also supported the exchange rate. In addition, the euro weakened against the U.S. dollar under the pressure of dovish remarks from European Central Bank officials, contributing to some support for the U.S. dollar index.
From a technical perspective, the U.S. dollar index showed an overall upward trend at the beginning of the week. The index reached a high of 104.19 and a low of 103.06 during the week. Currently, with weakening risk sentiment, the U.S. dollar index reversed its downward trend from last week's low of 102.46, rising more than 100 points and briefly surpassing the key level of 104.00 to 104.19, a two-week high. The short-term key resistance levels are around 104.21 (the weekly high on November 22) and 104.23 (the 38.2% Fibonacci retracement level from 107.11 to 102.46). Once breaking through 104.21-23, the U.S. dollar index could open the door to 104.80 (89-day moving average). At present, the current target for the shorts is 103.55 (23.6% Fibonacci retracement level), and if the shorts successfully break below 103.55 this week, the next target would be 103.00 (a psychological level), further looking towards 102.46 (the monthly low on November 29).
It is suggested to consider shorting the U.S. dollar index near 104.30 today, with a stop loss at 104.50 and targets at 103.90 and 103.85.

WTI Crude Oil Spot
Despite the weaker-than-expected non-farm payroll performance, aggressive selling occurred in the oil market, leading to a 4% plunge to the lowest point since January. This came as the market speculated that the European Central Bank would likely cut interest rates as early as March next year. Following the conclusion of the OPEC+ meeting this week, WTI oil prices approached $70 per barrel. With the strengthening of the U.S. dollar and widening interest rate differentials between the United States and other countries, there might be pressure on oil due to the replenishment of SPDR strategic reserves. Concerns about OPEC+ production cuts and demand worries contributed to a fourth consecutive day of declining oil prices, closing at the lowest level for the two crude benchmarks since July 6. This marks the first time WTI has seen four consecutive days of decline since May. The situation is attributed to near-historic highs in U.S. oil exports and record-high domestic crude production, overshadowing Saudi Arabia's commitment to the OPEC+ production cut plan.
In the U.S., as of the week ending December 1, API crude oil inventories unexpectedly increased by 594,000 barrels, leading to an extended decline in oil prices after settlement. The unexpected increase in U.S. crude inventories intensified concerns among investors that the global oil supply may exceed expectations due to weaker-than-expected commitments from major oil-producing countries last week. The stronger U.S. dollar has made oil more expensive for buyers using other currencies, thereby reducing demand. Meanwhile, two anonymous traders have revealed unusual activities in South Korea, with two refiners purchasing 4 million barrels of U.S. oil and planning to take delivery in March.
The daily chart indicates that the outlook for WTI spot crude oil has turned bearish for the first time in five consecutive trading days since May. The oil price has been oscillating in a low-range pattern in recent weeks, but considering the MACD indicator just crossed above the signal line, it is expected that oil prices will continue to slightly favor consolidation in the short term. Current support is first seen at 66.90-67.10, forming a triple bottom in May and June, with a larger support level pointing to 64.35 (March 10 low). Resistance is estimated at $70 (psychological level), with the next levels at $72.72 (Wednesday's high) and $73.60 (mid-channel line of the downward channel).
It is suggested to consider going long on crude oil near $69.10 today, with a stop loss at $68.85 and targets at $70.50 and $71.00.

Spot Gold
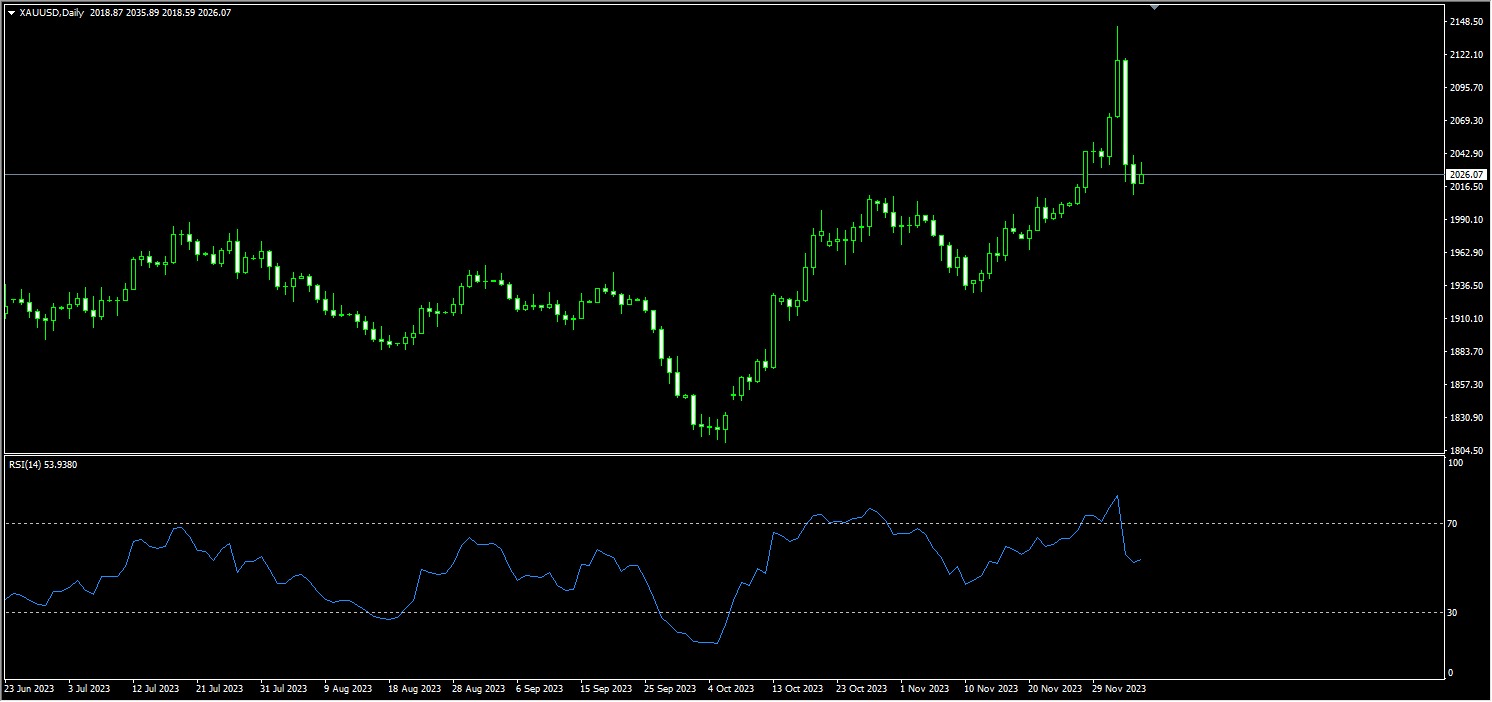
ADP's nonfarm payroll figures, often referred to as "small nonfarm," have fallen short of expectations for the fourth consecutive month. With the U.S. labor market losing significant momentum last month, the gold market has found new buying impetus. Gold prices rose by 0.30%. Despite mixed economic data from the United States and a slight decline in U.S. Treasury yields, gold prices briefly rebounded in the Asian market, only to resume their downward trend. This indicates that bearish pressure on gold still exists. In the early Asian session on Wednesday, gold lost momentum as demand for the U.S. dollar rebounded, putting downward pressure on gold. Additionally, dim prospects for the Chinese economy have dampened optimism in the entire commodities market, providing resistance to gold. On Tuesday, rating agency Moody's downgraded China's sovereign credit outlook to "negative," citing increasing risks to China's economic growth and a crisis in the real estate sector. As China is a major consumer of gold globally, this may limit the upside for gold prices. Meanwhile, the 10-year U.S. Treasury yield fell to 4.16%, reaching its lowest level since early September. At the same time, the U.S. Dollar Index touched above 104.00 for several days. The short-term bullish momentum of the U.S. dollar remains, implying a less optimistic outlook for gold. Gold traders will closely monitor economic data released in the latter part of this week, with China's trade balance for November scheduled for Thursday. The market will also focus on U.S. employment data on Friday, including nonfarm payrolls, average hourly earnings, and the unemployment rate.
Gold broke through previous records on Monday, briefly reaching a new all-time high of 2149 before rapidly reversing course and plummeting to a low of 1910 at the beginning of the week. The possibility of a long-awaited bullish breakthrough cannot be ruled out, even though bears temporarily control the situation. Despite the short-term control by bears, gold maintains a constructive technical outlook. This implies that the path of least resistance remains upward. In other words, if gold resumes its upward trajectory, the first significant obstacle to watch is 2050 (lower bound of the upward channel), and a breakout beyond this level could bring attention to 2066 (38.2% Fibonacci retracement from 1931.80 to 2149.00). Beyond this area, focus turns to 2075.50 (December 1st high). On the other hand, if the downward momentum intensifies in the short term, initial support is around 2010 (Tuesday's low) and 2000 (psychological level). A break below this area may signal a deeper correction, with the next downside targets near 1993 (30-day moving average) and 1987.50 (September 20th high).
Consider going long on gold before 2022 today, with a stop loss at 2018 and targets at 2035 and 2037.
AUDUSD
Data released by the Australian Bureau of Statistics (ABS) on Wednesday showed that Australia's Gross Domestic Product (GDP) grew by 0.2% in the third quarter of 2023, compared to the previous value of 0.4%. This data was below the expected 0.4%. The year-on-year GDP for the third quarter was 2.1%, compared to 2.1% in the second quarter, surpassing the expected 1.8%. Following the announcement of Australia's economic growth data, the AUD/USD rose on the same day. In the early Asian session, the AUD/USD rebounded slightly to around 0.6570. The recovery in demand for the U.S. dollar pushed the AUD/USD lower. U.S. bond yields retreated, and U.S. economic data was mixed, but the U.S. dollar briefly rose above 104.00, reaching the highest daily closing level in two weeks. The U.S. Job Openings and Labor Turnover Survey (JOLTS) showed a decrease of 617,000 job vacancies in October, dropping to 8.733 million. In addition, the U.S. ISM Non-Manufacturing Purchasing Managers' Index (PMI) exceeded expectations. On Tuesday, the Reserve Bank of Australia (RBA) decided to keep interest rates steady at 4.35% during the December monetary policy meeting. After the meeting, the Australian dollar declined against other currencies. RBA Governor Lowe stated that the decision to further tighten monetary policy to ensure inflation returns to target will be determined by data and evolving risk assessments. Looking ahead, market participants will closely monitor the U.S. non-farm payroll data scheduled for release on Friday, as it will provide a clear direction for the AUD/USD.
The AUD/USD has declined for the third consecutive day, breaking below 0.6600 and also falling below the 200-day moving average to a low of 0.6544. Technical indicators still suggest that the short-term AUD/USD may see further declines. The next strong support levels are near 0.6500 (psychological level), and if this support is breached, it may indicate a further deterioration on the daily chart to 0.6479 (23.6% Fibonacci retracement level from 0.6895 to 0.6270). The short-term chart shows that the relative strength index is in oversold territory, but there are no clear signs of a rebound. Currently, the path of least resistance is still downward, and the AUD/USD consolidation may face strong resistance around 0.6600. On the contrary, if the bulls regain decisive control of the market and manage to push the exchange rate above 0.6600, upward momentum may strengthen, opening the door to a rebound to 0.6670 (upper boundary of the weekly downward channel) and 0.6700 (psychological level), paving the way for a retest of the 0.6800 (psychological level) level.
Consider going long on the AUD near 0.6525 today, with a stop loss at 0.6510 and targets at 0.6580 and 0.6585.

GBPUSD
On Wednesday, GBP/USD closed lower for the third consecutive day, oscillating just below 1.2600. The U.S. ADP employment report for November recorded an increase of 103,000 jobs, marking the fourth consecutive month below expectations. Despite the weaker-than-expected non-farm payroll performance, as the market speculates that the European Central Bank may cut interest rates as early as March next year, the U.S. dollar index rose, reaching a two-month high. U.S. employment data this week will be a focal point as it may provide signals for the further tightening path of the Federal Reserve. However, the market expects the Federal Reserve to remain unchanged at its December meeting next week. On the British pound side, there is an increased speculation in the market about the Bank of England starting to cut interest rates earlier. Currently, financial markets almost entirely anticipate the Bank of England to make its first interest rate cut before June 2024. Traders will look for more clues from the UK's November Markit/CIPS Construction Purchasing Managers' Index and the Monthly Financial Stability Report. Additionally, U.S. employment data will be released later on Friday, providing direction for the GBP/USD currency pair.
After being deeply entrenched in negative territory earlier this week, GBP/USD approached 1.2600 in the early stages. The technical outlook for the currency pair points to a short-term bearish trend as investors await the release of significant macroeconomic data from the United States. Meanwhile, the relative strength index (RSI) has retraced slightly from near the previous week's high of 72 to the level of 58, indicating that buyers have not yet committed to a steady rebound. On the downside, if GBP/USD fails to hold above 1.2600 (psychological level), the first support area is at 1.2524 (38.2% Fibonacci retracement level from 1.2187 to 1.2733) and 1.2500 (integer level). A break below could target the 100-day moving average at 1.2468. If GBP/USD stabilizes above 1.2600 and 1.2604 (23.6% Fibonacci retracement level), the next resistance levels are at 1.2700 (psychological level) and 1.2733 (previous high).
It is advised to consider going long on the British pound near 1.2540 today, with a stop loss at 1.2520 and targets at 1.2600 and 1.2610.

USDJPY
In the early Asian session on Wednesday, USD/JPY strengthened, breaking above the 147.00 level, supported by a slight rise in U.S. bond yields and dovish comments from the Deputy Governor of the Bank of Japan, Naoaki Iwasa. Iwasa stated, "The Bank of Japan will patiently maintain its accommodative policy until the stable achievement of the price target." Additionally, with a slight rebound in U.S. bond yields, the overall U.S. dollar rebounded, and USD/JPY remained in a range. The U.S. dollar did not benefit from a cautious market environment, as investors weighed the prospect of the earliest Fed rate cut in March 2024. Meanwhile, the market is focused on Japan's latest inflation data. Data released by the Japan Statistics Bureau on Tuesday showed a 2.3% increase in the Tokyo core consumer price index in November. Due to the warming expectations that the Bank of Japan will end its negative interest rate policy early next year, USD/JPY fell to multi-month lows. The key risk event of the week remains the non-farm payroll data to be released on Friday.
From a technical perspective, the U.S. dollar continues to receive support from short-covering trades in the market. However, the recent atmosphere of increasing expectations of a decline in U.S. interest rates next year has gradually benefited the yen, and the yen's trend is moving away from the year's low of 151.91. In terms of technical patterns, the upside potential for USD/JPY is still limited, with initial resistance extending from 147.56 (23.6% Fibonacci retracement level from 151.91 to 146.22) to 148.00 (psychological level). If it further strengthens, the focus turns to 149.45 (50-day moving average) and 149.73 (61.8% Fibonacci retracement level), followed by 150.00 (psychological level). Currently, a death cross formation is evident as the 20-day (149.26) moves below the 50-day (149.50) moving average, suggesting a bearish trend. The relative strength index (RSI) is in oversold territory, but there are no clear signs of a rebound, reinforcing the overall bearish sentiment. In the event of a bearish reversal, technical support is at 146.22 (Monday's low) and around 146.00. If it continues to decline, market attention may shift to 144.57 (50% Fibonacci retracement level from 137.24 to 151.91).
It is suggested to consider going short on the U.S. dollar near 147.60 today, with a stop loss at 147.90 and targets at 146.80 and 146.70.

EURUSD
On Wednesday, the Euro/US Dollar continued to face selling pressure below the psychological level of 1.0800. Despite a better-than-expected November Purchasing Managers' Index (PMI) for the Eurozone, the Euro could not find support amid persistently weak demand in the Eurozone. At the time of reporting, the Euro/US Dollar was trading near 1.0760. The HCOB Eurozone Composite PMI for November, which measures both manufacturing and services sectors, remained below the critical threshold of 50.0, indicating a continued decline in output levels for the entire private sector in the Eurozone. The November Eurozone Composite PMI was 47.6, up from the previous value of 47.1 but still below the expected 47.1. Meanwhile, the HCOB Services PMI rose from the previous value of 48.2 to 48.7. Additionally, business activities in the major economies of the Eurozone, including France, Germany, and Italy, showed a decline, with their economies being the weakest. This has added pressure on the Euro and become a headwind for the Euro/US Dollar. On the U.S. side, despite a decline in U.S. Treasury yields, the U.S. dollar continued to rise to levels above 104.00.
The daily chart shows that the Euro/US Dollar is currently finding support just below the 100-day moving average at 1.0769. The pair is testing this level after breaking below the 20-day (1.0860) and 200-day (1.0820) moving averages. Technical indicators continue to favor a downward trend. If the Euro/US Dollar convincingly breaks below the 100-day moving average at 1.0769 and the 1.0763 area (38.2% Fibonacci retracement from 1.3143 to 1.0448), the next key support levels are at 1.0700 (psychological level) and 1.0692 (November 14th low). To reverse the negative bearish trend, the Euro must rise and maintain levels above 1.0800. It's noteworthy that the close at the beginning of the week formed a bullish pattern with the 30-day (1.0785) and 100-day (1.0770) moving averages, suggesting that the bearish momentum may temporarily pause. The initial resistance is at 1.0861 (50% Fibonacci retracement), and further resistance levels include 1.0893 (10-day moving average) and 1.0900 (psychological level).
Today's recommendation is to go long on the Euro before 1.0750, with a stop loss at 1.0730 and targets at 1.0805 and 1.0815.

Disclaimer:
The information contained herein (1) is proprietary to BCR and/or its content providers; (2) may not be copied or distributed; (3) is not warranted to be accurate, complete or timely; and, (4) does not constitute advice or a recommendation by BCR or its content providers in respect of the investment in financial instruments. Neither BCR or its content providers are responsible for any damages or losses arising from any use of this information. Past performance is no guarantee of future results.
More Coverage


Risk Disclosure:Derivatives are traded over-the-counter on margin, which means they carry a high level of risk and there is a possibility you could lose all of your investment. These products are not suitable for all investors. Please ensure you fully understand the risks and carefully consider your financial situation and trading experience before trading. Seek independent financial advice if necessary before opening an account with BCR.

 English
 简体中文
简体中文
 繁體中文
繁體中文
 Bahasa
Melayu
Bahasa
Melayu
 Tiếng
Việt
Tiếng
Việt
 ไทย
ไทย
 日本語
日本語
 한국어
한국어
 ភាសាខ្មែរ
 español