


0
USD
On Thursday, December 7th, the US dollar softened by approximately 0.50% ahead of the release of non-farm employment data in the United States, a figure that could reveal the policy trajectory of the Federal Reserve. The US dollar index maintained a slight decline, and amid cooling inflation and a softening labor market, the market is closely monitoring signals from the Federal Reserve regarding its next steps. The US dollar, measured by the dollar index, rose for the third consecutive day. Despite the decline in US yields, the interest rate differentials with other countries and their currencies are widening, as markets begin to digest the fact that other countries are cutting interest rates faster and by larger magnitudes than anticipated by the Federal Reserve. On the Federal Reserve front, the upcoming week will mark the quiet period before the December policy meeting, during which Federal Reserve officials are not allowed to make speeches or attend events in the ten days leading up to the announcement. While most opinions suggest that Federal Reserve officials are maintaining a tough stance in their rhetoric, actions suggest a more dovish approach, with expectations leaning towards no further interest rate hikes and the possibility of an imminent rate cut. US Treasury Secretary Janet Yellen, in a recent speech, expressed her disagreement with the current market expectations for a Federal Reserve interest rate cut, stating that markets sometimes misinterpret the actions of policymakers. She added that "the Federal Reserve will take any action they deem appropriate, and market conditions are one of the factors that contribute to such actions."
The daily chart indicates an overall upward trend in the US dollar index price this week. The weekly performance of the US dollar index remained predominantly volatile at higher levels in the early part of the week. The index continued to trade above the 200-day moving average support level of 103.56 and successfully breached the 104.00 level (psychological barrier) to the upside. If the US dollar index continues to hold above the 104.00 support, a bullish outlook is expected to persist, with further challenges towards the levels around 104.21 (weekly high on November 22) and 104.23 (38.2% Fibonacci retracement level of the range from 107.11 to 102.46). A breakthrough could then target the 104.83 level (89-day moving average). Currently, ahead of the release of non-farm employment data and the Federal Reserve meeting, the index may hover around the 103.60 to 104.00 range. A softening of the US dollar is anticipated to continue, and traders should wait for a bearish move towards 103.55 (23.6% Fibonacci retracement level) and 103.56 (200-day moving average) levels. If bearish momentum successfully breaks below the 103.55 and 103.56 areas this week, the next target could be around 103.00 (psychological barrier).
For today, it may be considered to short the US dollar index near 103.82, with a stop-loss at 104.00 and targets at 103.30 and 103.25.

WTIUSD
Midweek, WTI crude oil prices experienced a sharp decline, marking the fourth consecutive trading day of losses and reaching the lowest level since late June at $69.27. Considering the significant midweek drop (about 4%), the value of WTI for December has fallen by nearly 9%, breaking below the psychological level of $70.00. From a technical perspective, this indicates a bearish development. The recent sell-off in the energy market is not driven by a single catalyst but rather the combined impact of various factors.
Firstly, investors were disappointed with the announced OPEC+ production cut at the end of November, as the cuts were voluntary rather than mandatory. This voluntary approach may allow member countries to avoid commitments to individual production reductions. China's disappointing economic growth, coupled with record-breaking U.S. crude oil production amid a slowing economic activity, has created an unfavorable environment for this commodity. In recent weeks, the increase in U.S. fuel inventories beyond normal seasonal levels has reinforced investors' belief that demand is being adversely affected, further dampening market sentiment.
The trajectory of oil prices may depend on the health of the U.S. economy. If incoming information confirms the view that an economic recession may occur soon, oil prices could continue to languish or even decline further, with the next bearish target being the triple-bottom formed in June around $66.9-$67.10. A breach would test the subsequent support at $64.35 (March 10th low). In the event of a bullish reversal, considering some disconnection between the physical and paper markets, initial resistance is around $70.00. A successful breakthrough and sustained upward momentum could reignite bullish interest, laying the groundwork for a rebound to $72.72 (Wednesday's high) and $73.60 (midline of the downward channel). Further upside progress would shift the focus to the $75.00 level.
For today, it may be considered to go long on crude oil near $69.10, with a stop-loss at $68.85 and targets at $70.50 and $71.00.

Spot Gold
The initial jobless claims data released by the United States came in slightly below expectations, causing gold to experience a sharp short-term rise and fall in the first half of this week. The economic data announced by the United States in the early part of the week fell short of expectations, leading to a temporary decline in U.S. bond yields. Gold took this opportunity to stabilize at a crucial level. From a fundamental and anticipatory perspective, the downward movement of U.S. bond yields and the upward movement of gold prices are expected to remain the main narrative in 2024. However, on the one hand, the current upward momentum in gold prices has been substantial, partially reflecting the positive factors mentioned above and has already shown signs of a pullback. On the other hand, it is anticipated that the Federal Reserve still does not wish to see market expectations get detached. There is a risk of the Fed correcting market expectations again through forward guidance. It cannot be ruled out that there might be a short-term, slight rebound in the 2-year and 10-year U.S. bond yields after the rapid decline in this round. Therefore, it is expected that gold will still face the test of range-bound consolidation.
The next key event is the non-farm employment data on Friday, with the market hoping for clear clues on the Fed's interest rate path from the data. Therefore, the volatility of gold prices may still be limited before the release of the U.S. non-farm employment data on Friday.
Observing the daily chart, gold prices rebounded midweek and stabilized around the level of 2014.70 (61.8% Fibonacci retracement of the range from 1931.70 to 2149.00). However, it is still facing resistance below the 2040.30 (50% Fibonacci retracement) and 2042 (lower boundary of the upward channel) levels, indicating the risk of a retreat. Nevertheless, considering that the trend still leans towards upward development, this suggests that the current outlook for strengthening consolidation has not fundamentally changed. However, if the rebound fails to reclaim and stabilize above $2066 (38.2% Fibonacci retracement), there is still a risk of oscillating back down to test lower levels. Recent support levels to watch below include $2014.70 and $2002 (20-day moving average). A breach would shift focus to the psychologically significant $2000 level.
For today, it may be considered to go long on gold before $2025, with a stop-loss at $2022 and targets at $2036 and $2038.

AUDUSD
According to the latest Australian foreign trade data released by the Australian Bureau of Statistics on Thursday, Australia's trade surplus narrowed to 712.9 million Australian dollars in October, below the expected 7500 million Australian dollars and the previous value of 6786 million Australian dollars. Further data indicates that Australia's October monthly rate of export of goods and services was 0.4%, compared to the previous value of -1.0%. The October monthly rate of import of goods and services in Australia was -1.9%, compared to the previous value of 8.0%. After a significant decline over the past two days, the Australian Dollar/US Dollar (AUD/USD) experienced a slight rebound. On Wednesday, AUD/USD reached a high of 0.6599 but later retraced, narrowing the gains, indicating that bearish pressure still persists. Despite the decline in U.S. bond yields and weak labor market data, the U.S. dollar remains strong. With weak economic data in Australia and inflation moving in the right direction, the market expects the Reserve Bank of Australia (RBA) not to raise interest rates further. Price expectations are beginning to reflect the possibility of rate cuts by mid-2024. The ADP employment change in the United States was lower than expected, and overall data continues to show easing inflation pressures. U.S. bond yields continue to decline, with the 10-year yield reaching multi-month lows. However, the U.S. dollar remains resilient. The non-farm employment report to be released on Friday may challenge the strength of the U.S. dollar.
AUD/USD hit a low of 0.6544 on Tuesday, above the 30-day moving average of 0.6500, and then rebounded to near 0.6600. However, AUD/USD lost momentum and retreated to 0.6550. The bearish momentum has eased somewhat, indicating that there may be consolidation in the future. The exchange rate is inclined to downside risks as AUD/USD is still below the bearish 20-day moving average of 0.6546 and the upward trendline. Initially, technical indicators are inclined to the downside, with momentum and relative strength indicators pointing downward, while the MACD indicator remains in the negative zone. If AUD/USD consolidates below 0.6546-0.6544, it may pave the way for further decline to 0.6500 (psychological barrier) and then to the 100-day moving average of 0.6465. On the upside, since closing above the 30-day (0.65) and 100-day moving averages of 0.6465, if AUD/USD recovers the 200-day moving average of 0.6576, it will dispel short-term bearish tendencies and further target 0.6000 (psychological barrier). Rebounding to 0.6670 (upper line of the weekly downtrend channel) and above 0.6700 (market integer level) opens the door to higher levels.
For today, it may be considered to go long on the Australian Dollar before 0.6578, with a stop-loss at 0.6560 and targets at 0.6640 and 0.6655.

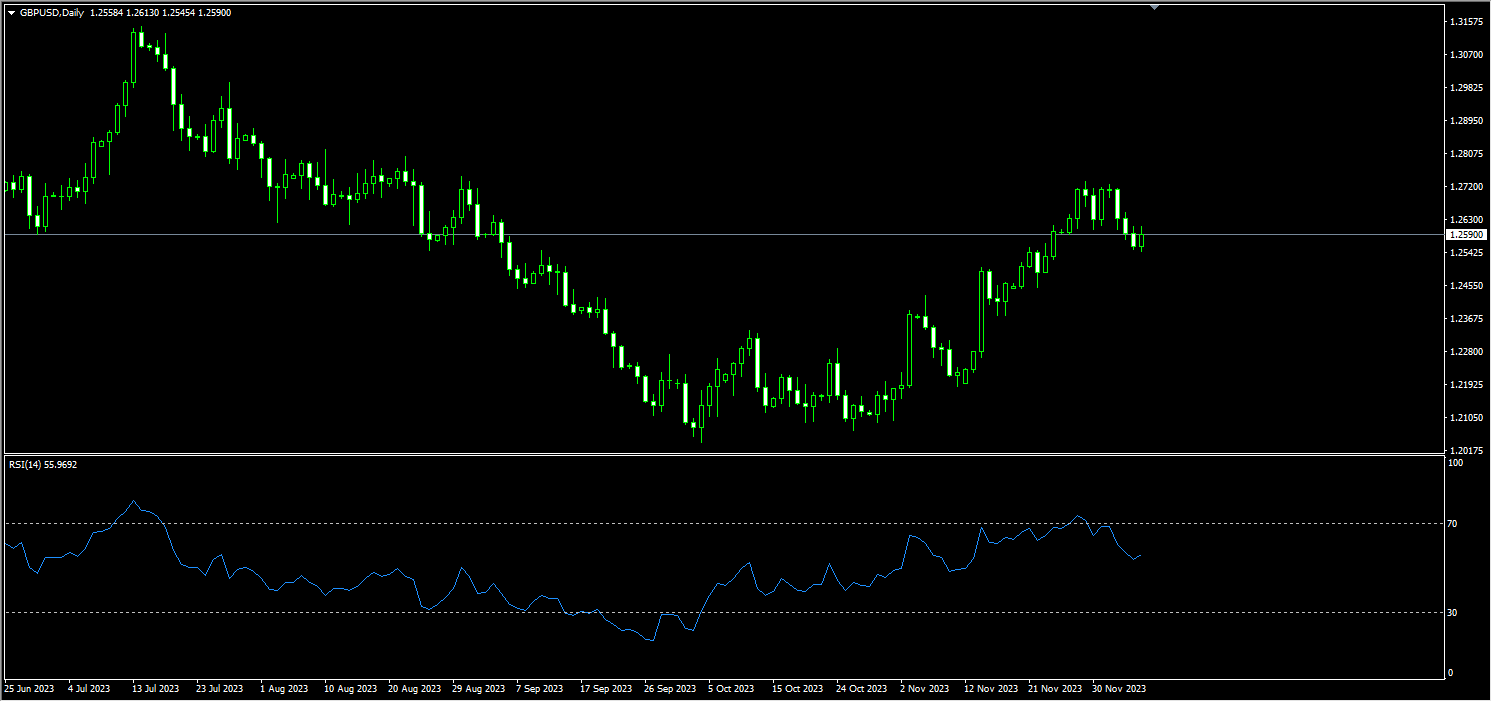
GBPUSD
In the early Asian session on Thursday (December 7th), the British Pound/US Dollar (GBP/USD) extended its decline above 1.2500, but later retraced and was recently trading near 1.2590. The drop in this currency pair is supported by the overall strength of the US dollar. As there are no economic data releases from the UK later in the week, the currency pair continues to be influenced by the dynamics of the US dollar. GBP/USD fell below 1.2600 yesterday after closing in negative territory on the first trading day of the week. On Tuesday, it continued to decline slightly to 1.2600. Although investors are awaiting important macroeconomic data from the United States, the technical outlook for this currency pair suggests a short-term bearish bias. October JOLTS job openings data and the November ISM Non-Manufacturing PMI survey will be the new drivers for the US market. A significant decline in job openings to below 9 million could put pressure on the US dollar and help GBP/USD recover some recent losses. On the other hand, better-than-expected ISM Non-Manufacturing PMI data could keep the US dollar on a firm footing.
From a technical perspective, the initial resistance for the upward trend of the British Pound is at 1.2590 (50% Fibonacci retracement of the rebound from 1.3143 to 1.2037) and 1.2600 (psychological level), with further resistance at 1.2721 (61.8% Fibonacci retracement) and 1.2724 (high point earlier this week). The key resistance level is at 1.2800 (psychological level). On the downside, the first support area is aligned at 1.2481 (200-day moving average) and 1.2460 (38.2% Fibonacci retracement). The next level to watch is around 1.2400.
Today, it is suggested to go long on the British Pound before 1.2580, with a stop-loss at 1.2560 and targets at 1.2640 and 1.2650.
USDJPY
On Thursday, the Japanese Yen attracted some safe-haven inflows and regained most of its recent decline against the US Dollar over the past three days. The initial jobless claims in the United States were lower than economists' expectations, and continued claims for unemployment benefits declined, indicating that the pace of layoffs did not accelerate. The three major US stock indices maintained an upward trend, and the US Dollar Index accelerated its decline. USD/JPY experienced volatile movements throughout the day, plummeting more than 550 points at one point. Earlier in the week, disappointing US economic data heightened market concerns about an economic slowdown, reducing investor preference for risk assets and boosting demand for traditional safe-haven assets. The upcoming US labor market data once again confirmed the market's bet on the Federal Reserve cutting interest rates early next year, pushing the 10-year US Treasury yield close to a three-month low. This, in turn, created headwinds for the US Dollar, suppressing USD/JPY. However, recent comments from members of the Bank of Japan's board downplayed speculation about an imminent policy shift, which may restrain aggressive bets on a stronger Yen and provide some support for the USD/JPY currency pair ahead of Friday's crucial US monthly employment data.
From a technical perspective, USD/JPY has struggled to reclaim the support breakout point of the 100-day moving average several times this week (now turned into a resistance level, currently near 147.46), favoring a bearish outlook. Additionally, the daily chart's oscillation indicator remains deeply in the negative zone, far from the oversold area, suggesting that the path of least resistance for USD/JPY is downwards, supporting the prospect of further declines. Meanwhile, if USD/JPY falls below the 100-day moving average, it may retreat to the 146.00 (psychological level) level. If USD/JPY breaks below the 146.00 level, it may pressure the currency pair to fall to the support level of 144.57 (50% Fibonacci retracement of the range from 137.24 to 151.91) and towards 142.84 (61.8% Fibonacci retracement). On the other hand, the 100-day moving average may continue to act as a strong short-term resistance level. If a clear breakthrough occurs, it could trigger short-covering rebounds, reclaiming the 148.00 level. However, the upward movement of USD/JPY may encounter strong resistance around the 148.30-148.40 area. If USD/JPY continues to strengthen and breaks through the 148.30-148.40 area, it would indicate that the recent pullback from around 151.91 has ended and could signal a reversal of the bullish outlook.
For today, it is suggested to short the US Dollar at 144.50, with a stop-loss at 144.80 and targets at 143.30 and 143.10.

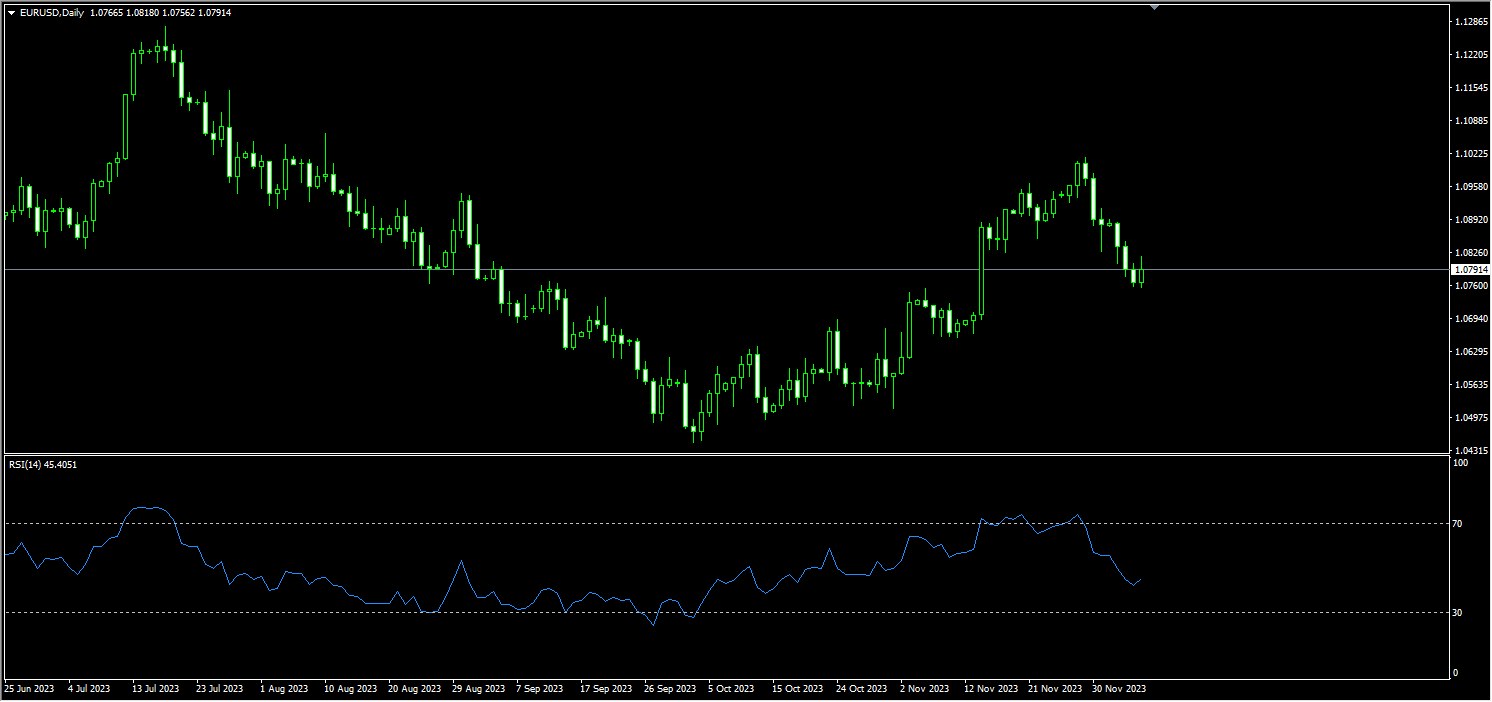
EURUSD
In the early Asian session on Thursday, the Euro/US Dollar (EUR/USD) showed a slight uptrend. However, renewed demand for the US Dollar and weaker-than-expected Eurozone data may limit the upside potential for EUR/USD. Currently, EUR/USD is trading near 1.0790. The US Dollar Index has been climbing for three consecutive days, exerting continuous pressure on the Euro's rebound. Weak retail sales in the Eurozone have somewhat suppressed the Euro. Retail sales in the Eurozone for October increased by 0.1%, compared to -0.1% in September, falling below the expected value of 0.2%. The year-on-year retail sales rate in the Eurozone for October decreased from -2.9% to -1.2%, weaker than the expected -1.1%. High interest rates, weak consumer confidence, and diminishing optimism in the labor market have collectively hindered private consumption. Isabel Schnabel, a member of the European Central Bank's board, stated last month that raising interest rates is still an option as the final stage of curbing inflation may be the most challenging. However, after three consecutive unexpected low inflation readings, Isabel Schnabel has changed her stance. The market's expectation for the European Central Bank to cut interest rates by 142 basis points next year is intense, and it appears that the earliest the ECB might cut rates is in March 2024.
EUR/USD has fallen for the sixth consecutive day, reaching below 1.0770, marking the lowest level since mid-November. The Euro's weakness and the Dollar's strength continue to weigh on EUR/USD. The market will be attentive to US employment data. The downtrend in EUR/USD may persist, as the daily chart indicates a potential continuation of the bearish momentum. The relative strength index is moving downward, the momentum indicator has just crossed the midpoint, and two days ago, EUR/USD fell below the 200-day moving average (1.0821). Currently, EUR/USD is testing the levels below 1.0692 (November 14th low) and the 65-day moving average at 1.0688, indicating a bearish outlook. If EUR/USD manages to rise above 1.0800 and the 200-day moving average at 1.0821, the exchange rate may find initial resistance at 1.0861 (50% Fibonacci retracement of the rebound from 1.3143 to 1.0448). The next levels to watch would be around 1.0893 (10-day moving average) and 1.0900 (psychological level).
For today, it is suggested to go long on the Euro before 1.0770, with a stop-loss at 1.0750 and targets at 1.0845 and 1.0855.
Disclaimer:
The information contained herein (1) is proprietary to BCR and/or its content providers; (2) may not be copied or distributed; (3) is not warranted to be accurate, complete or timely; and, (4) does not constitute advice or a recommendation by BCR or its content providers in respect of the investment in financial instruments. Neither BCR or its content providers are responsible for any damages or losses arising from any use of this information. Past performance is no guarantee of future results.
More Coverage


Risk Disclosure:Derivatives are traded over-the-counter on margin, which means they carry a high level of risk and there is a possibility you could lose all of your investment. These products are not suitable for all investors. Please ensure you fully understand the risks and carefully consider your financial situation and trading experience before trading. Seek independent financial advice if necessary before opening an account with BCR.

 English
 简体中文
简体中文
 繁體中文
繁體中文
 Bahasa
Melayu
Bahasa
Melayu
 Tiếng
Việt
Tiếng
Việt
 ไทย
ไทย
 日本語
日本語
 한국어
한국어
 ភាសាខ្មែរ
 español