0
US Dollar Index
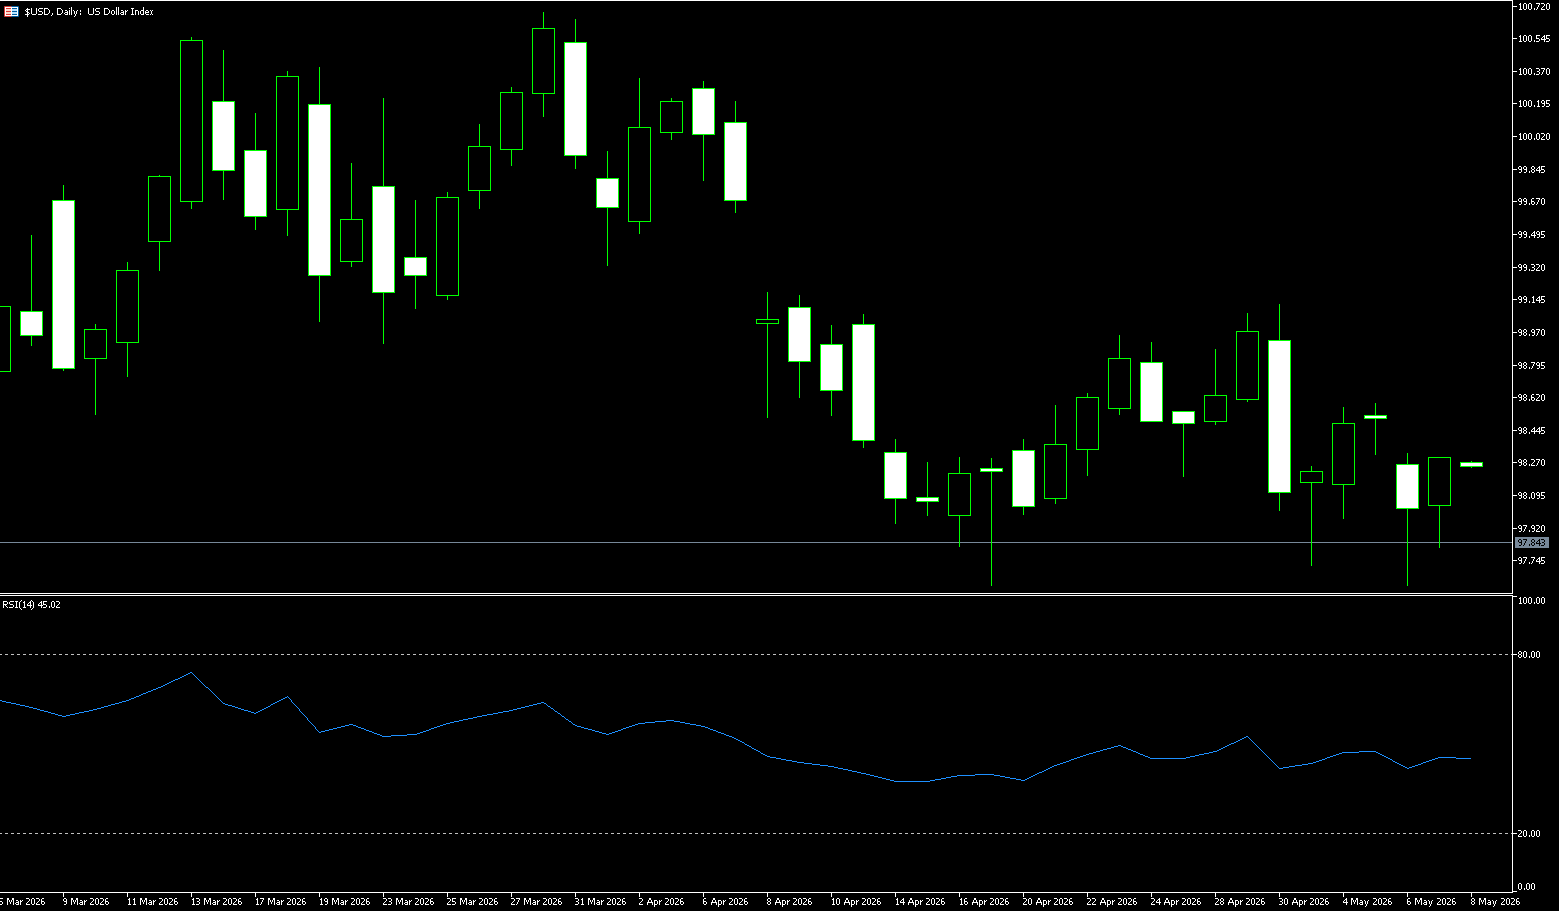
The US dollar index fell to 99 on Monday, retreating from a more than one-month high reached last Friday, as new developments in US-Iran negotiations improved investor sentiment. Iranian media reported that Washington proposed a temporary waiver of oil sanctions pending a final agreement, while other reports suggested Tehran might accept a long-term freeze on its nuclear program. However, the situation in the Middle East remains highly fragile and uncertain, with the Strait of Hormuz remaining closed most of the time. Therefore, oil prices continue to rise and are expected to remain high, increasing global inflationary pressures and limiting the scope for central banks to ease monetary policy. The market currently expects the Federal Reserve to keep the federal funds rate unchanged until the end of the year, although the probability of an additional 25 basis point rate hike has risen to about 40%. The dollar generally weakened, with the largest decline against the pound.
The US dollar index tested key resistance in an uptrend, putting pressure on non-US currencies, but with significant divergence among different currencies: the yen showed resilience and rebounded, the Canadian dollar fluctuated neutrally due to oil price influences, and the euro and pound saw significant declines. Overall, the strong dollar trend is unlikely to change in the short term, but profit-taking and event-driven reversals should be watched out for at higher levels. Technically, the price has effectively broken above the Bollinger Band midline at 98.50, and the MACD indicator shows a continued increase in the red bars, indicating a clear short-term bullish trend. The RSI (14) has risen from the weak zone of 41.90 to 60.30, breaking through the 50 level (a key support/resistance level) and remaining above overbought territory, indicating ample upside potential. Resistance lies between the 70-week moving average (99.79) and the psychological level (100.00), while support is found at the round number 99.00 and the 200-day simple moving average (98.54). Investors should remain flexible and pay attention to key technical levels and marginal changes in fundamentals.
Today, consider shorting the US Dollar Index at 99.10, with a stop-loss at 99.20 and targets at 98.70 and 98.60.
WTI Crude Oil
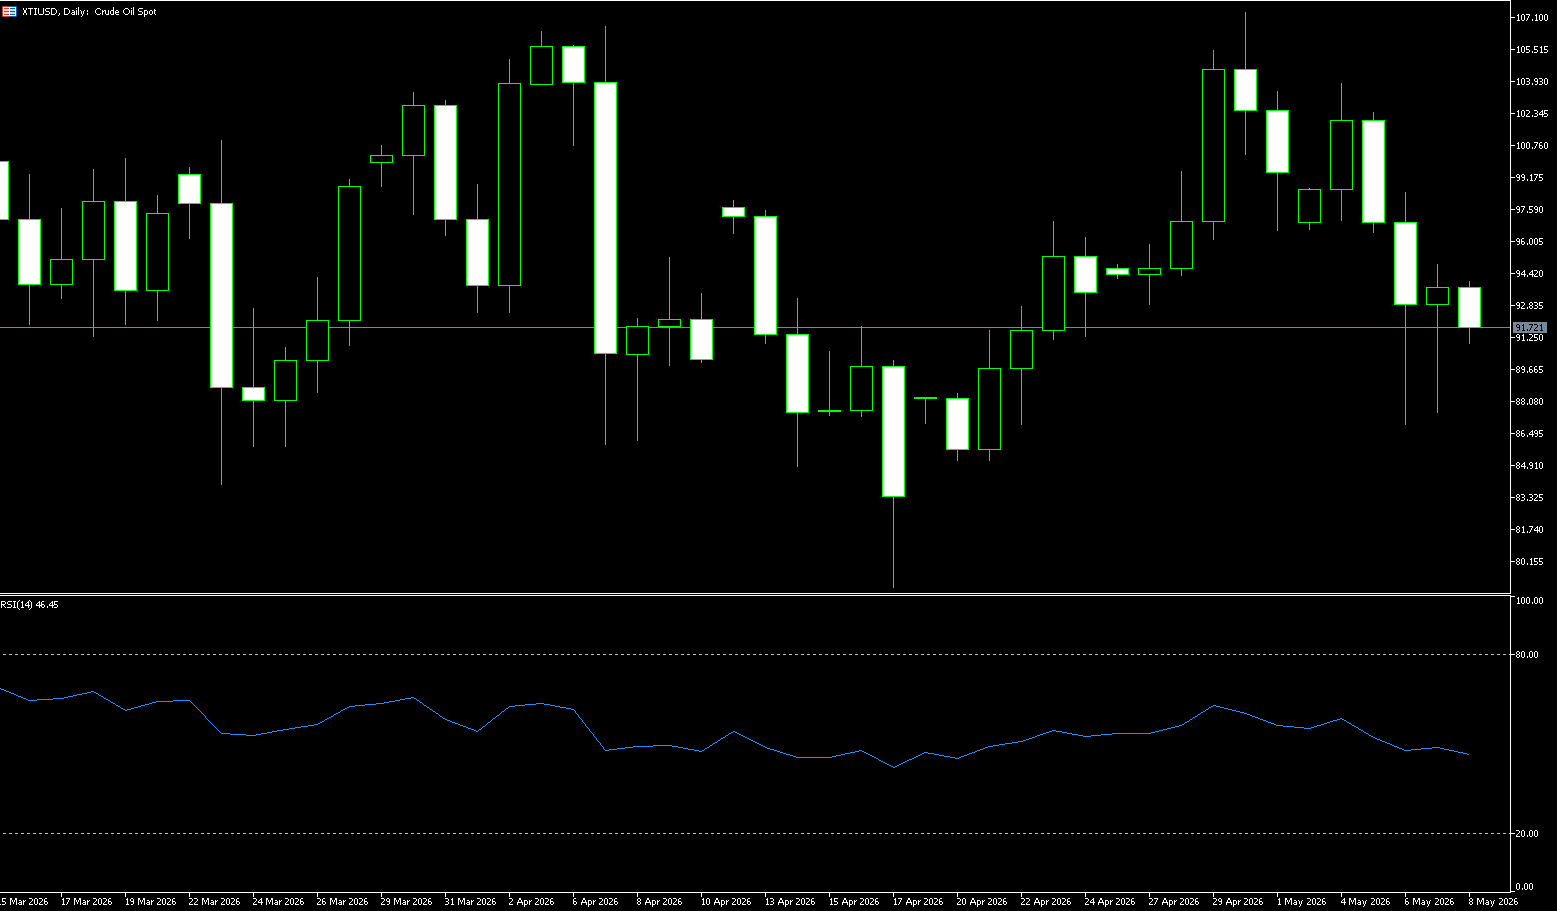
At the beginning of the week, US crude oil rose by over 1%, trading around $102.00 per barrel. Tensions between the US and Iran persisted. Although Trump believes Iran is willing to reach an agreement, Iran warned of an "offensive response" if the US launches another military action. Last week, the oil market rebounded significantly against the backdrop of tense US-Iran relations. Navigation dynamics in the Strait of Hormuz and high-level statements became the core variables for price fluctuations. Driven by supply concerns, the upward trend in oil prices was confirmed, but the fragile ceasefire agreement also means that any diplomatic developments could quickly change market sentiment. This week, the oil market will continue to revolve around the evolution of the situation in the region. Participants need to continuously monitor subsequent statements from both sides and changes in actual navigation data to grasp potential volatility. Overall, under the current circumstances, oil prices are likely to maintain a slightly bullish trend, but uncertainties remain prominent.
At the start of the week, WTI crude oil prices continued their strong upward trend, rising for the third consecutive trading day and hitting a two-week high. Currently trading around $102.60, the daily increase is approximately 1.7%. Increased market concerns about escalating geopolitical risks in the Middle East have become a key factor driving the continued rebound in international oil prices. From a technical perspective, WTI crude oil has returned to a strong uptrend on the daily chart. After breaking through the $100 and $101 levels, bullish momentum has clearly strengthened. In the short term, a new battleground between bulls and bears is forming around $105. If this level can be effectively held, the market may further test the $108 to $112 range. Observing the 4-hour chart, WTI crude oil maintains a short-term upward trend. The MACD indicator remains above the zero line, indicating that short-term market sentiment remains bullish, while the RSI indicator is gradually approaching high levels, suggesting that the market may experience technical consolidation after the rapid rise. Therefore, the $100 level (a psychological level) and the $97.24 area are worth watching on the downside.
Today, consider going long on crude oil at 101.85, with a stop-loss at 101.70 and targets at 103.50 and 104.00.
Spot Gold
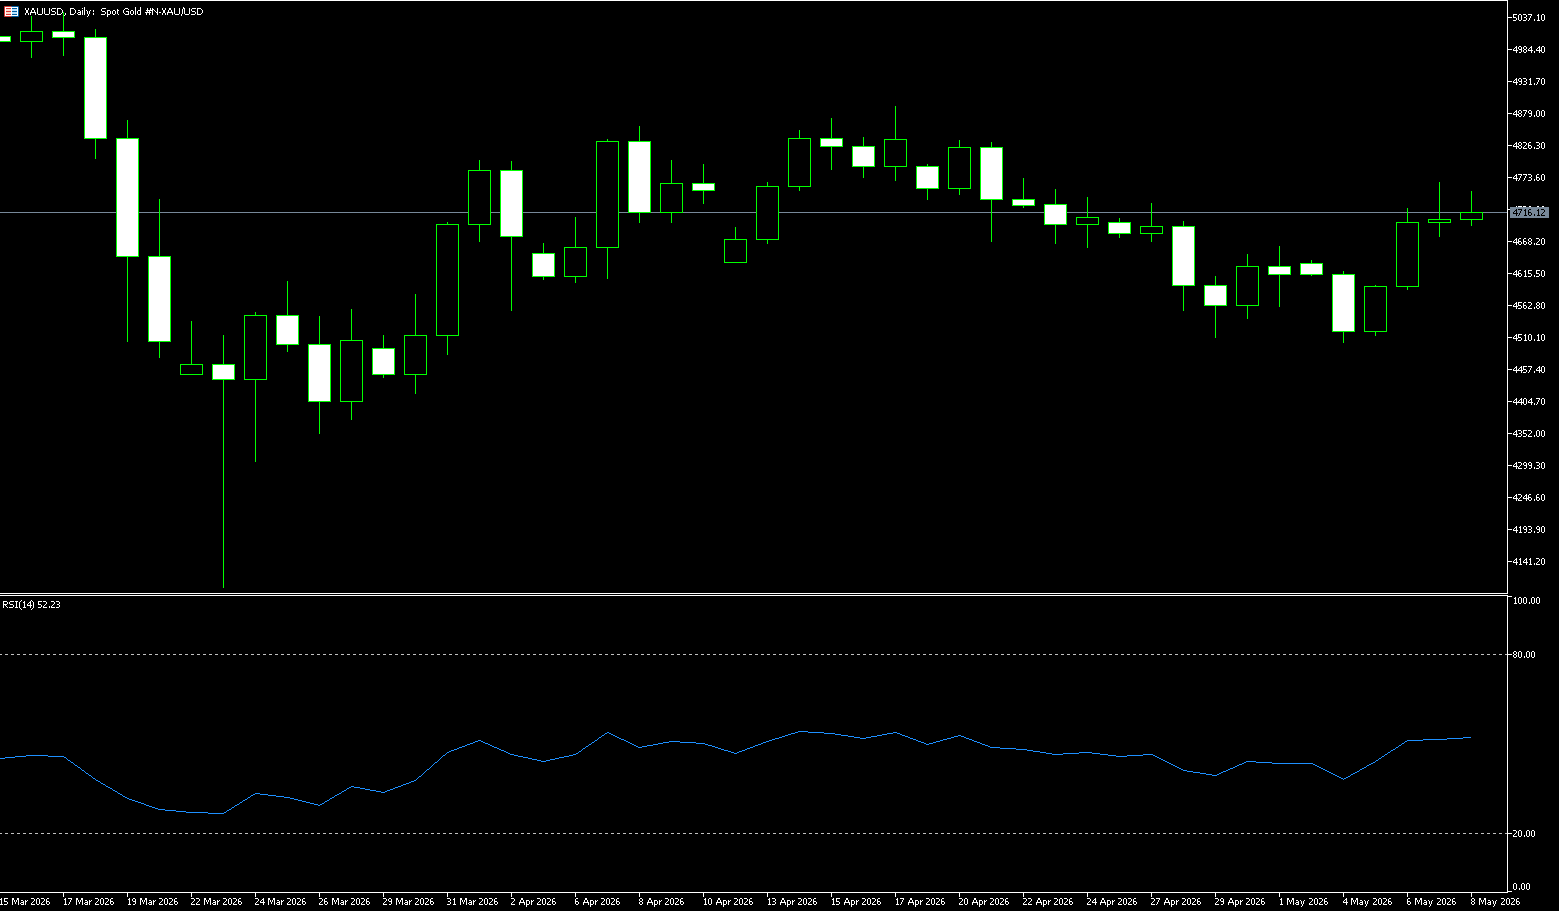
On Monday morning in Asian trading, spot gold briefly fell below $4,500/oz, after previously rebounding to $4,570/oz. A stronger dollar dragged down gold prices, while US-Israeli military action against Iran exacerbated inflation concerns, further reinforcing market expectations of interest rate hikes. There is a long-term, stable negative correlation between gold and the US dollar index and US Treasury yields. This is widely accepted in financial theory: a stronger dollar increases the cost of dollar-denominated gold for non-US investors, while rising US Treasury yields increase the opportunity cost of holding non-interest-bearing gold, leading to a shift of funds from gold to higher-yielding fixed-income assets. This week, the 10-year US Treasury yield rose to its highest level in nearly a year, and the dollar index also rebounded to above 99, reaching a new high since April 8th. This trend is closely related to expectations of Federal Reserve policy. In a high-inflation environment, market expectations that the Federal Reserve will maintain high interest rates or even raise them have intensified, pushing up the dollar and yields. The "holding cost" of gold has consequently increased, leading many institutional investors to reduce their gold positions and shift towards short-term US Treasury bonds or money market funds.
From a daily chart perspective, gold prices are currently below the 20-day moving average (approximately $4,646), with a 14-day Relative Strength Index (RSI) of 37.53 and an Average Directional Movement Index (ADX) close to 17, indicating weak trend momentum and a downward trend in the market. Downside support levels are at $4,480 (Monday's low). If gold prices break below $4,480 again, it could open up further downside potential to $4,400 (the psychological level). On the upside, $4,555 (early week high) is a key resistance level. Only a recovery and sustained hold above this level for several days can be considered a short-term stabilization signal. The next target is the $4,600 level; the MACD indicator also shows a continued death cross, and trading volume has increased during the decline, indicating that the bears are in control. Technical and fundamental factors are converging, making a short-term rebound difficult. However, gold has historically experienced technical rebounds in oversold areas multiple times; investors can pay attention to whether the RSI enters the oversold zone below 30 as a potential entry reference.
Today, consider going long on gold at 4,562, with a stop loss at 4,557 and targets at 4,590 and 4,600.
AUD/USD
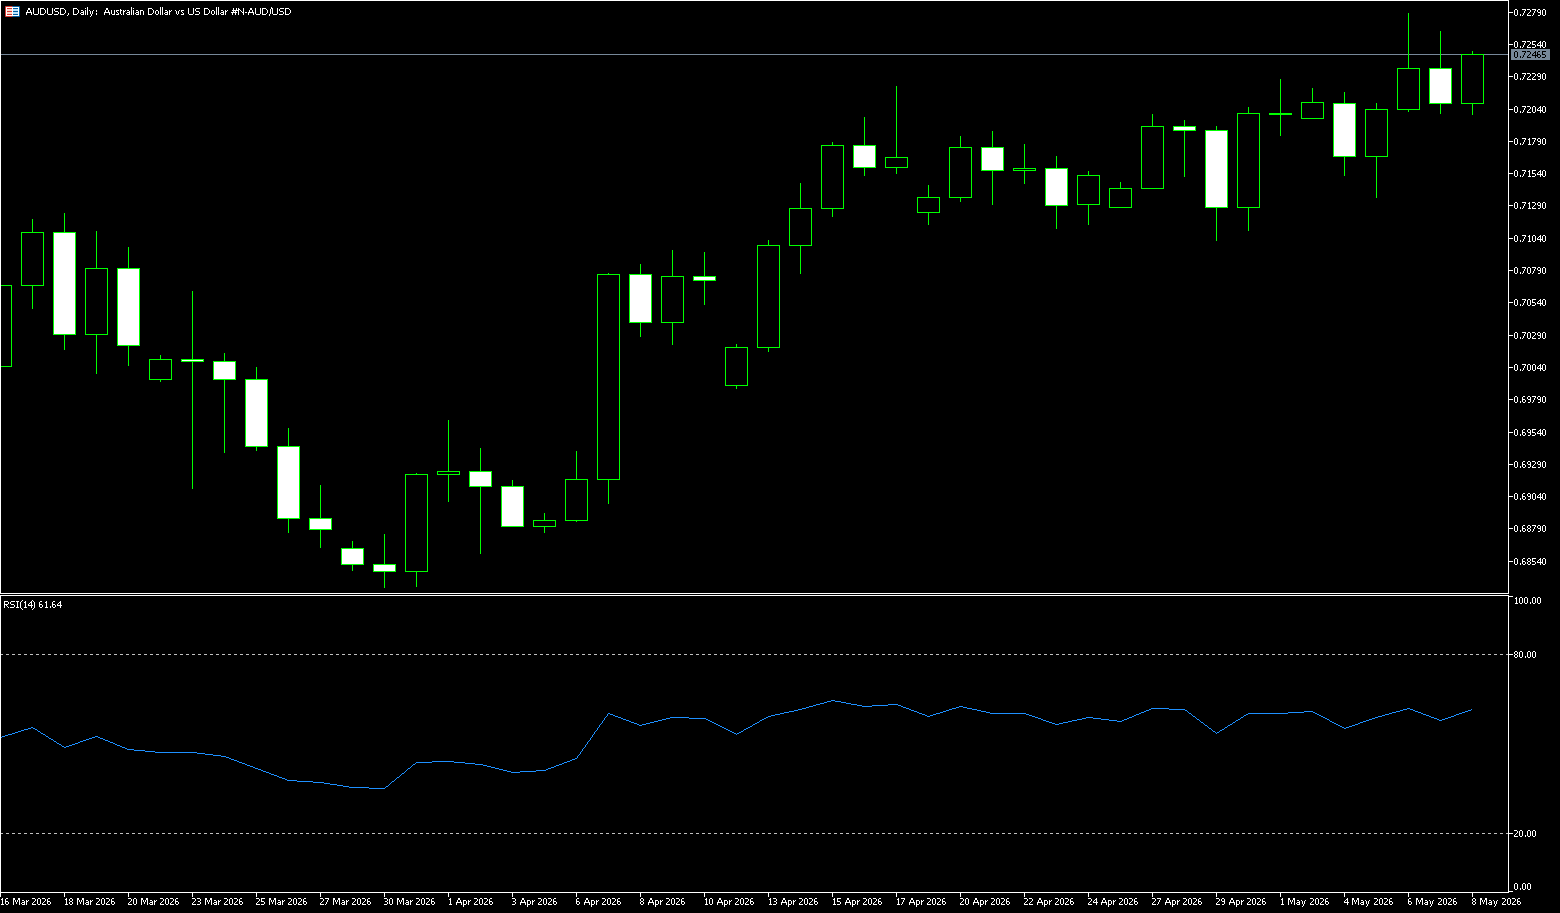
The Australian dollar marked its third consecutive day of decline and hit its lowest level in nearly three weeks before depreciating to around US$0.7150 on Monday, as investors continued to favor the safe-haven US dollar amid uncertainty surrounding US-Iran peace talks. President Trump warned that "time is running out" and that Iran must reach an agreement, while Iran's Mehr news agency stated that Washington had not offered "any substantial concessions" and continued to demand unacceptable conditions. Domestically, market focus shifts to the Reserve Bank of Australia's meeting minutes later this week for further clues about the policy outlook, following the central bank's 25 basis point increase in the cash rate to 4.35% in May. Investors are also watching Sarah Hunt's speech, which is expected to maintain a cautiously hawkish stance and keep the option of rate hikes open given high inflation. Meanwhile, the April labor market report will be closely watched for signs of the impact of higher interest rates and fuel costs on demand and economic activity.
On the daily chart, AUD/USD retreated to the 0.7100 level but remains structurally bullish, with prices continuing above short- and medium-term simple moving averages. The 50-day simple moving average is around 0.7091, and the 100-day is near 0.7007, indicating a mature uptrend supported by multiple layers of support. The Relative Strength Index (RSI) (14) hovers around 46, suggesting stable positive momentum. Below, near-term support lies around the 0.7100 level, reinforced by the nearby 89-day simple moving average at 0.7045, and deeper support is provided by the 0.7000 level. Above, initial resistance is at 0.7188 (the 20-day simple moving average), a break above which would expose the next key high of 0.7200 (the psychological level), where a broader bullish rally would face a more severe test.
Consider going long on the Australian dollar today at 0.7155, with a stop-loss at 0.7145 and targets at 0.7200 and 0.7210.
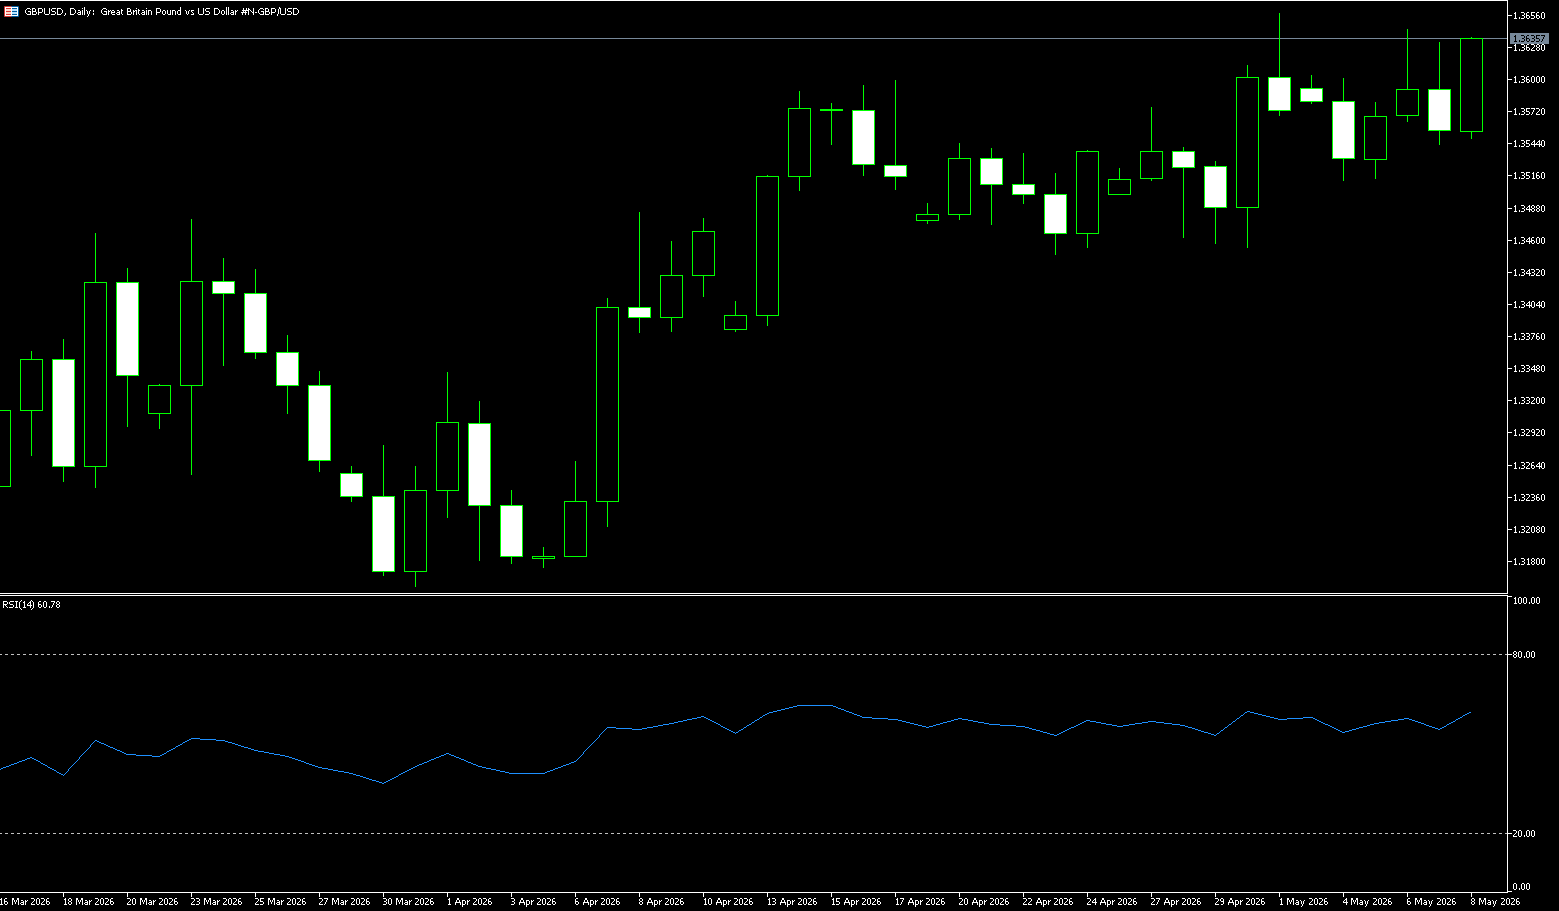
GBP/USD
The pound rebounded to $1.34 on Monday, recovering after a week of volatility during which it fell more than 2%, its biggest weekly drop since November 2024. This occurred after reports that the US had proposed temporary waivers for Iranian oil sanctions, with Tehran willing to accept a long-term nuclear freeze but unwilling to completely dismantle its nuclear program. Despite some recovery, the pound remains under pressure due to political uncertainty as investors assess the possibility of Andy Burnham leading the election to challenge Prime Minister Keir Starmer, who is considered the least favorable candidate for bond investors. The market expects the Bank of England to raise interest rates nearly three times this year. Technically, the pound/dollar pair has a short-term need for correction, but remains in a highly volatile and volatile phase. The market will focus on UK fiscal policy, changes in Federal Reserve policy, and global energy price trends.
Overall, while there are temporary signs of stability in UK politics, market concerns about UK economic growth, fiscal pressure, and the high-interest-rate environment persist. Therefore, the pound's short-term movement is likely to continue to be driven by global risk sentiment and changes in the US dollar. Technically, the pound/dollar pair has maintained a range-bound pattern on the daily chart recently. The exchange rate previously fell below 1.3300 but rebounded to around 1.3400 as the dollar corrected. The 1.3450 area has now become a key short-term resistance level; a successful break above this level could open up further upside potential and test the 1.3480-1.350 area. The MACD indicator is gradually rising towards the zero line, while the RSI indicator has returned to around 50, indicating that short-term bearish pressure in the market has eased somewhat. However, the exchange rate has not yet completely broken free from its previous downward structure. If it subsequently falls below 1.3300 again, it may retest the support area around 1.3250. The short-term trend of the US dollar remains the core variable affecting the direction of the pound.
Today, consider going long on the pound at 1.3420, with a stop loss at 1.3410 and targets at 1.3485 and 1.3475.
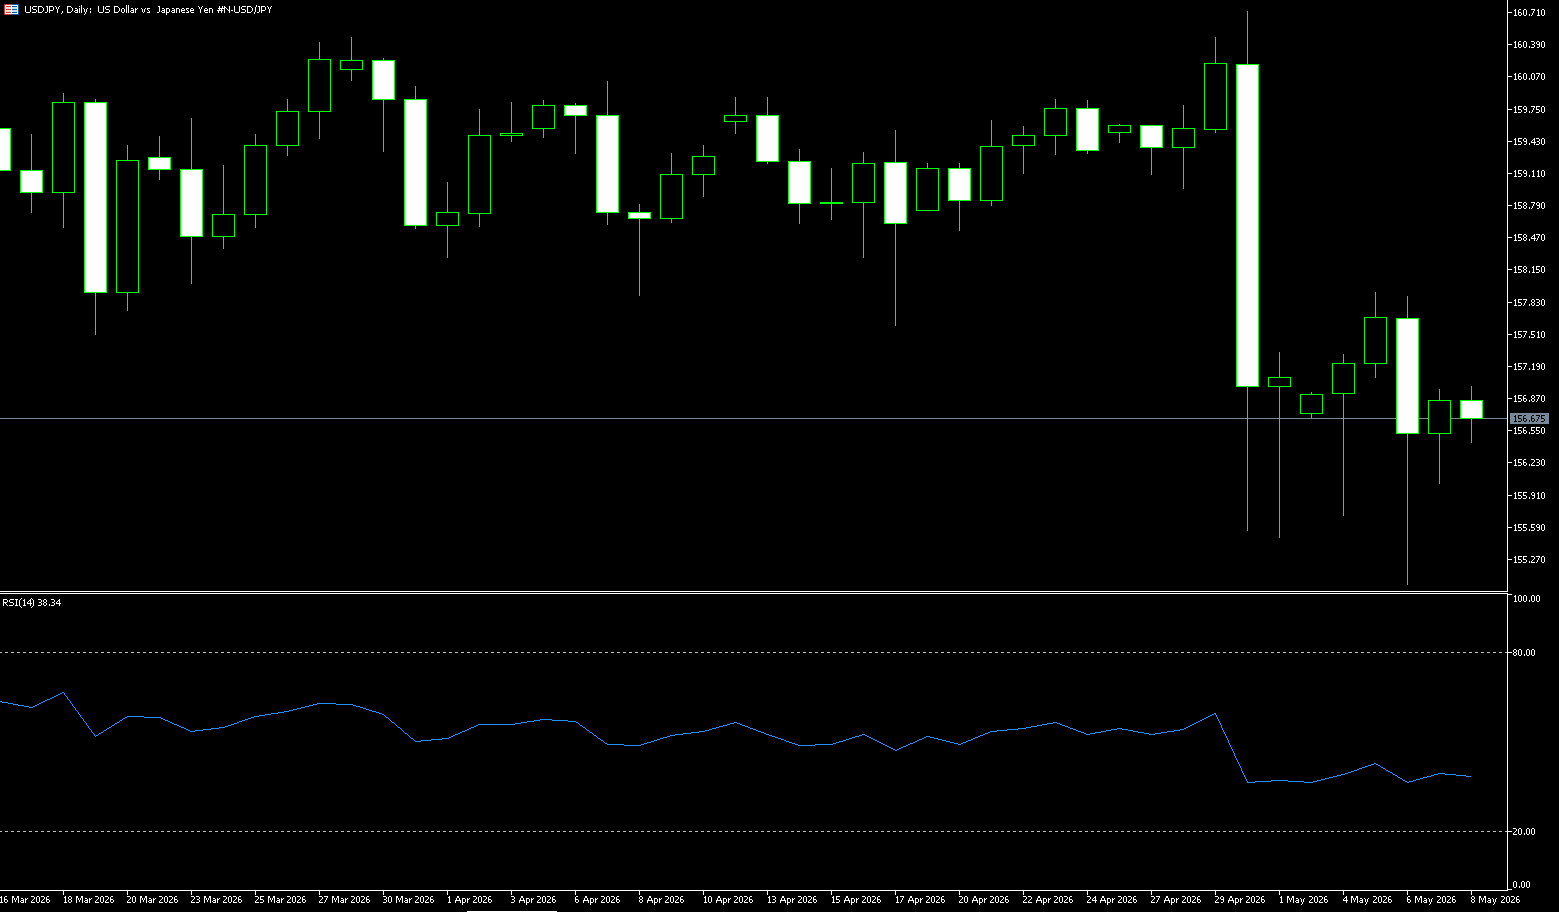
USD/JPY
The yen fell to 159 against the dollar on Monday, marking its sixth consecutive day of decline, as the dollar continued to strengthen amid rising expectations that the Federal Reserve may need to raise interest rates this year to curb inflation. US inflation accelerated due to the energy price shock triggered by the Middle East conflict, while the US and Iran have yet to reach a peace agreement or make progress on reopening the Strait of Hormuz. The yen is also approaching the key 160-dollar threshold after Tokyo intervened in late April to support the currency. Market participants remain wary of potential further intervention, especially after some Japanese officials hinted at no limit to the frequency of government intervention in the foreign exchange market. Notably, US Treasury Secretary Scott Bessant expressed support for Japan's recent efforts to stabilize the yen.
The weak yen and imported inflationary pressures from high oil prices pose challenges; however, weak consumption, supply chain disruptions, and Prime Minister Sanae Takaichi's dovish stance present potential obstacles. With inflation threats outweighing concerns about slowing demand, the Bank of Japan faces a difficult balancing act: raising interest rates to curb yen depreciation while avoiding a hard landing for the economy. The June meeting will be a key window to verify this policy shift. From a technical perspective, although the US dollar index has risen above 99, supported by US economic data, the USD/JPY pair has encountered significant resistance above 159.00 (a psychological level) and 159.50 (the high of April 17th), indicating market caution regarding the "dual threat" of BOJ intervention and interest rate hikes. The USD/JPY daily chart currently shows a high-level consolidation pattern with unclear direction, with the exchange rate trading within a range of multiple moving averages. The current exchange rate is trading around 158.90, within a narrow range just above the 20-day moving average and below the 50-day moving average. An upward break above 159.00 is needed to challenge the previous high of 159.50 and even the psychological level of 160.00. On the downside, consider the 158.00 (psychological level) and the 157.47 (100-day moving average) area.
Today, consider shorting the US dollar at 159.00, with a stop loss at 159.15 and targets at 158.20 and 158.00.
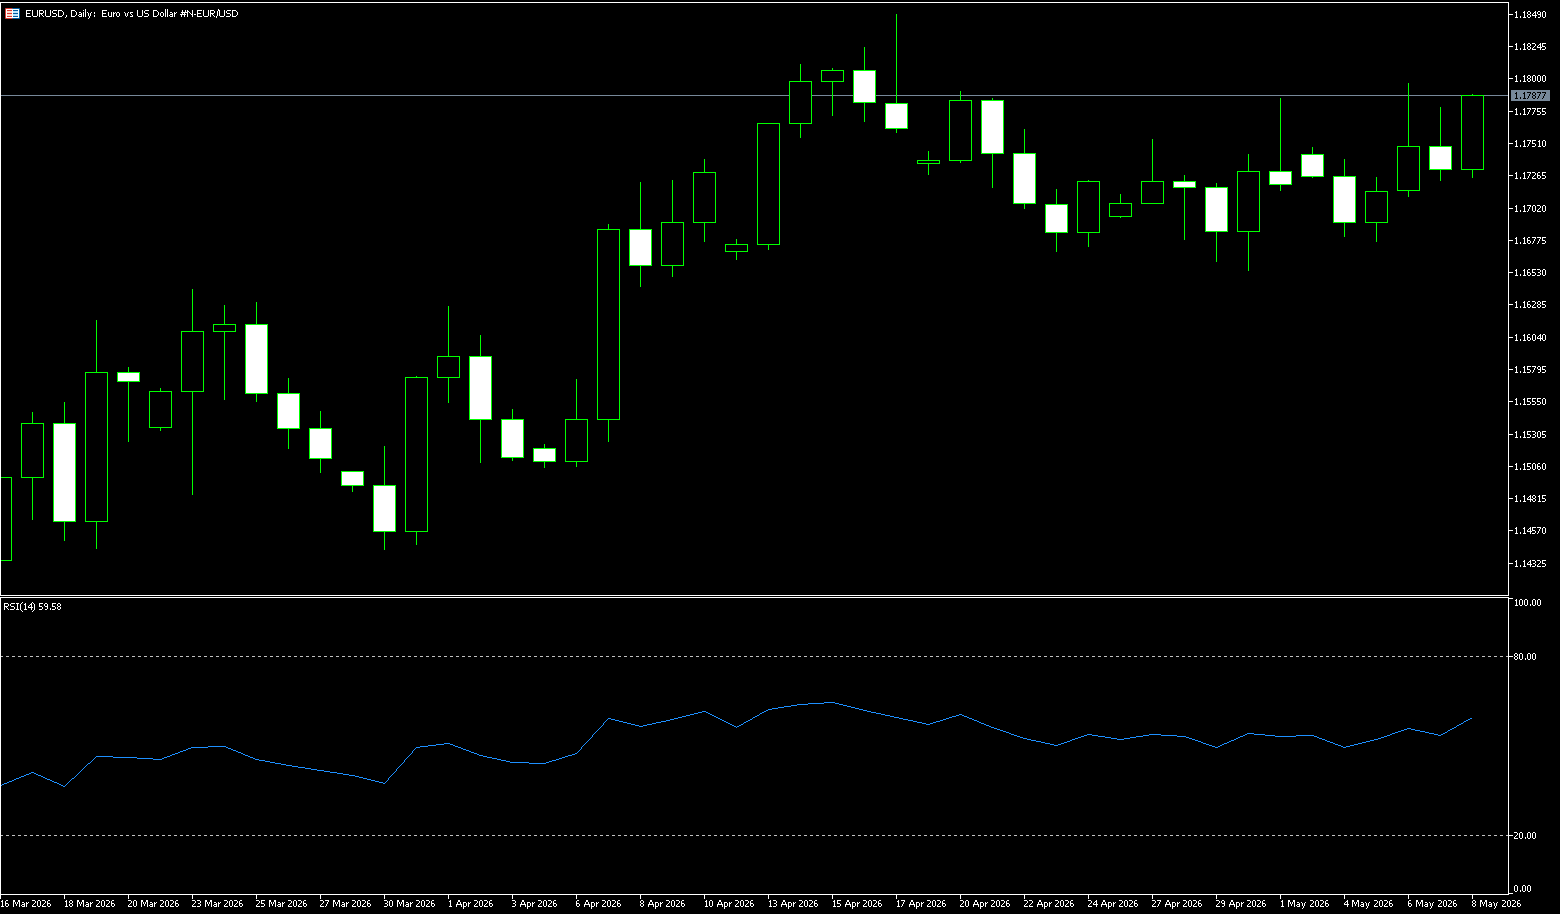
EUR/USD
The EUR/USD traded in negative territory around 1.1640 on Monday. The euro continued its decline as the ongoing US-Iran conflict pressured risk assets. Traders await preliminary Eurozone and US Purchasing Managers' Index (PMI) data to be released on Thursday. Iranian media reported on Sunday that the US had failed to make any substantial concessions in response to Tehran's latest proposal to end the conflict. US President Donald Trump threatened Iran on Sunday to "take action" or face further consequences. The ongoing tensions between the US and Iran are likely to continue boosting safe-haven currencies such as the dollar and putting downward pressure on the major currency pair. On the other hand, European Central Bank policymakers hinted at interest rate hikes to curb stubborn inflation expectations. This, in turn, could help limit the euro's decline.
The daily chart shows that the EUR/USD pair currently exhibits a clear bearish trend, with the price having broken below several key moving averages, and the downward trend is accelerating. Specifically, the 20-day moving average (MA20) is at 1.1717, the 50-day moving average (MA50) is at 1.1646, the 100-day moving average (MA100) is at 1.1705, and the 200-day moving average (MA200) is at 1.1681. The current price is trading around 1.1624 (with an intraday low of 1.1576), significantly below the MA20, MA100, MA200, and MA50. Furthermore, the MA50 has crossed below the MA100 and MA200, forming a typical "death cross" bearish signal. Observing recent price action, the EUR/USD pair has been declining since peaking around 1.2081, breaking through multiple support levels including 1.1960, 1.1848, and 1.1759, forming a clear downward channel structure with lower highs and lower lows. Currently, the price is testing short-term support near the 1.1600 level. A decisive break below this level would target 1.1576 and even the 1.1500 area. On the upside, watch the 1.1673 (5-day moving average) and the 1.1600 level.
Today, consider going long on the Euro at 1.1635, with a stop-loss at 1.1625 and targets at 1.1680 and 1.1690.
Disclaimer: The information contained herein (1) is proprietary to BCR and/or its content providers; (2) may not be copied or distributed; (3) is not warranted to be accurate, complete or timely; and, (4) does not constitute advice or a recommendation by BCR or its content providers in respect of the investment in financial instruments. Neither BCR or its content providers are responsible for any damages or losses arising from any use of this information. Past performance is no guarantee of future results.
More Coverage


Risk Disclosure:Derivatives are traded over-the-counter on margin, which means they carry a high level of risk and there is a possibility you could lose all of your investment. These products are not suitable for all investors. Please ensure you fully understand the risks and carefully consider your financial situation and trading experience before trading. Seek independent financial advice if necessary before opening an account with BCR.
BCR Co Pty Ltd (Company No. 1975046) is a company incorporated under the laws of the British Virgin Islands, with its registered office at Trident Chambers, Wickham’s Cay 1, Road Town, Tortola, British Virgin Islands, and is licensed and regulated by the British Virgin Islands Financial Services Commission under License No. SIBA/L/19/1122.
Open Bridge Limited (Company No. 16701394) is a company incorporated under the Companies Act 2006 and registered in England and Wales, with its registered address at Kemp House, 160 City Road, London, City Road, London, England, EC1V 2NX. This entity acts solely as a payment processor and does not provide any trading or investment services.

 English
 简体中文
简体中文
 繁體中文
繁體中文
 Bahasa
Melayu
Bahasa
Melayu
 Tiếng
Việt
Tiếng
Việt
 ไทย
ไทย
 日本語
日本語
 한국어
한국어
 ភាសាខ្មែរ
 español