


0
Currency & Commodity Analysis:
US Dollar Index
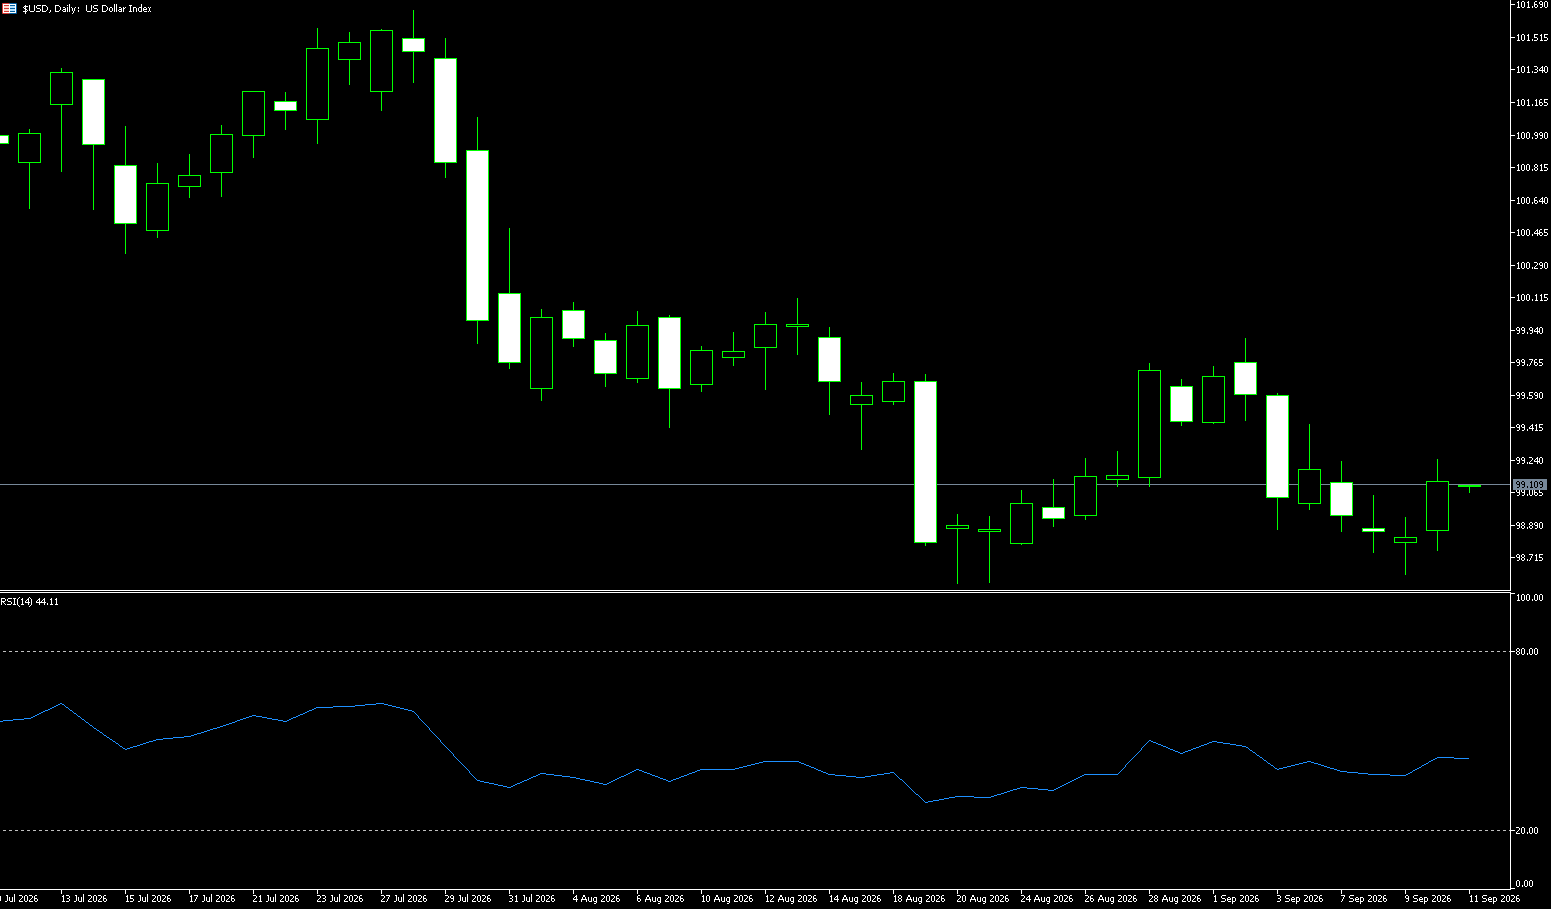
The US Dollar Index maintained its strength early in the week, trading near the 100.46 high, and continued to fluctuate at elevated levels on Tuesday, regaining buying support after two consecutive days of decline. Market repricing of the US interest rate trajectory has been the primary driver keeping the dollar at these highs. On September 16, the Federal Reserve raised the target range for the federal funds rate by 25 basis points to 3.75%–4.00%—the first rate hike in over three years—while the policy statement continued to emphasize that inflation remains elevated. Regarding policy expectations, the impact of this rate-hike cycle did not end with the decision itself. The Fed's latest projections indicate that most officials anticipate room for further rate hikes this year, and market pricing for another hike at the October meeting has intensified significantly. The market currently estimates the probability of another hike in October at approximately 56.5%, up from around 42.5% a week ago. This implies that the dollar is currently supported not merely by the short-term interest rate spread resulting from a single hike, but by the expectation that higher interest rates may persist for a longer period.
The US Dollar Index is consolidating at high levels near the 100 mark, remaining above both the psychological 100 level and the 100-day simple moving average (SMA) at 99.90. Short-term moving averages remain above long-term ones and are trending upward, indicating a continued bullish bias in the short-term structure. The 14-day RSI stands at approximately 63.37—firmly in positive territory but not yet in the typical overbought zone—suggesting that bulls retain the initiative, supported by short-term expectations of a hawkish Federal Reserve. If the price breaks back above 100.56 (the September 18 high), the short-term rally could extend toward the 101 mark; conversely, repeated failed attempts to break higher could trigger profit-taking. Immediate short-term support lies at the 100 psychological level and the 100-day SMA (99.90), while 99.51 represents a more critical structural support level; a drop below this could see the price seeking new buying interest near the 200-day SMA at 99.18.
Consider shorting the US Dollar Index today at 100.63; Stop Loss: 100.73; Targets: 100.20, 100.30.
WTI Spot Crude Oil
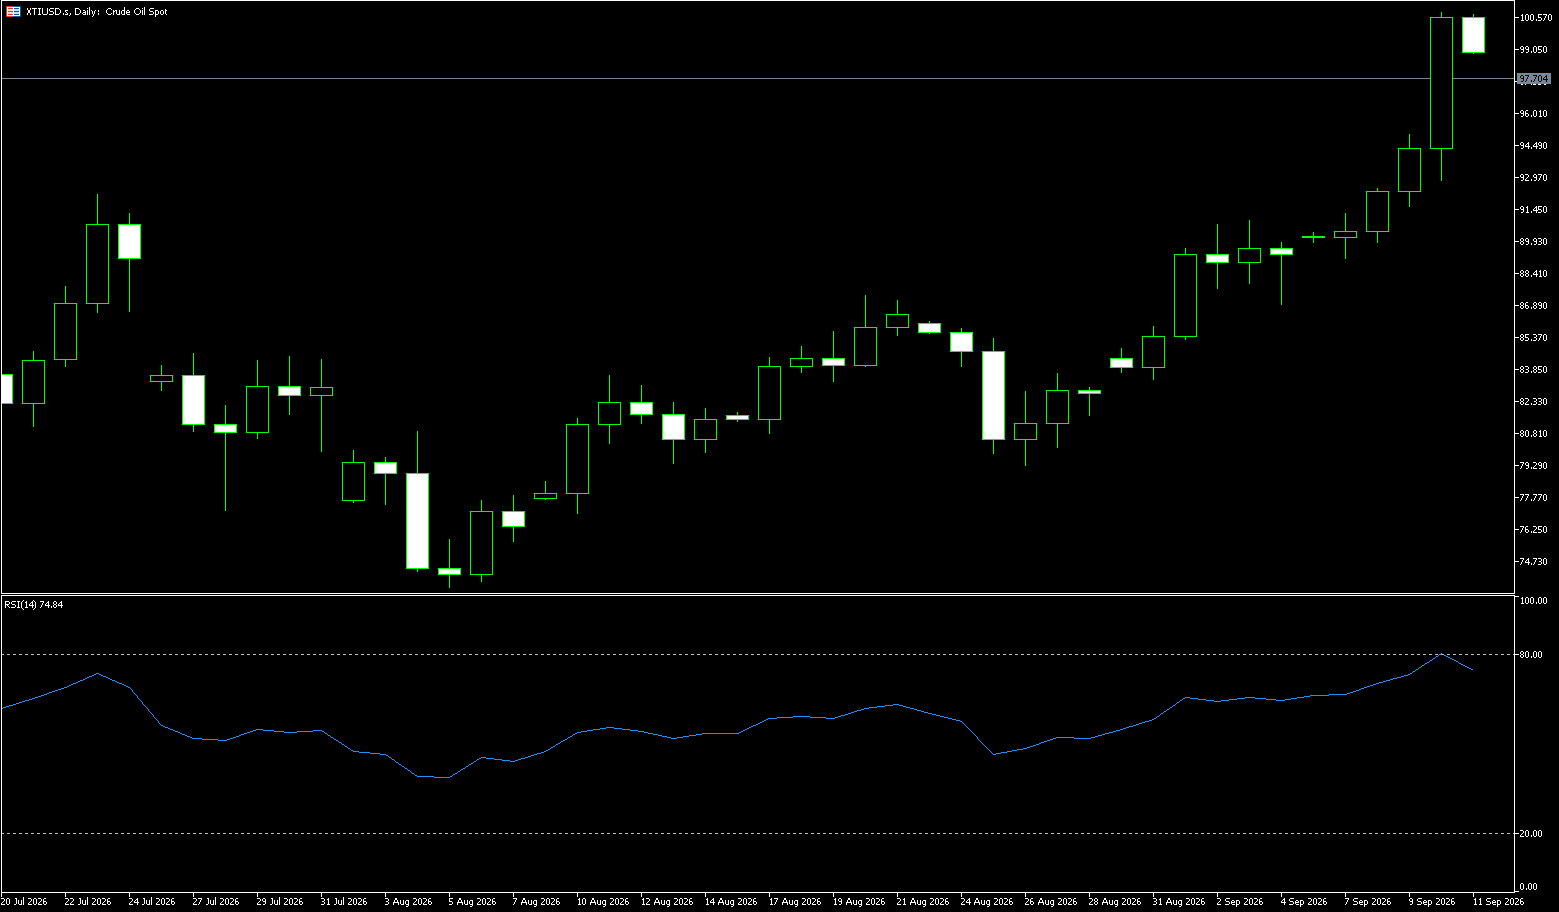
On Tuesday, crude oil prices fell below $90 per barrel—marking a fifth consecutive day of declines—after President Trump stated that U.S. officials had held "very good" meetings with Iranian envoys and that momentum for a deal was strong. In his UN address, Trump noted he faced a "major decision" regarding whether to seek a negotiated agreement with Iran or "destroy the Islamic Republic," adding his belief that a deal would be reached after the election. According to a senior Iranian government official, a proposal has been conveyed to the U.S.; it includes resuming negotiations aimed at permanently ending hostilities. The official stated that if the U.S. takes steps to end the blockade severely impacting Iranian oil exports, Iran is prepared to reopen the Strait of Hormuz within seven days. Meanwhile, Saudi Arabia is reportedly preparing to restart its key East-West Pipeline, aiming to restore significant flow by Saturday; the pipeline is reportedly already operating at a low rate.
From a daily chart perspective, WTI has undergone a sustained pullback after forming a local high above the $90 mark. Prices have dropped below several recent short-term moving averages, significantly increasing short-term downward pressure. However, the technical structure has not yet fully shifted into a medium-to-long-term bearish trend. Previous analysis indicates that the 38.2% Fibonacci retracement level near $91.13 serves as a key support, while the 100-day moving average—located around $85.14—remains a critical line of defense for the medium-term trend. The current price level near $92.30 is approaching the $91.13–$92.00 support zone; if this zone holds, there is room for a technical rebound in oil prices. However, if the daily price decisively breaks below the $90 mark, the next phase could see a test of levels near $87.80 or even a move toward the $84.50–$85.00 range. Regarding upside resistance, the initial focus is on the $95 area—a key price level that was previously breached to the downside; if WTI manages to stabilize above $95, the $97.50–$100 range becomes the next area to watch. Only by reclaiming the $100 level can the short-term bearish structure be significantly repaired.
Consider going long on crude oil today at $89.15; stop-loss: $89.00; targets: $91.00, $92.00.
Spot Gold
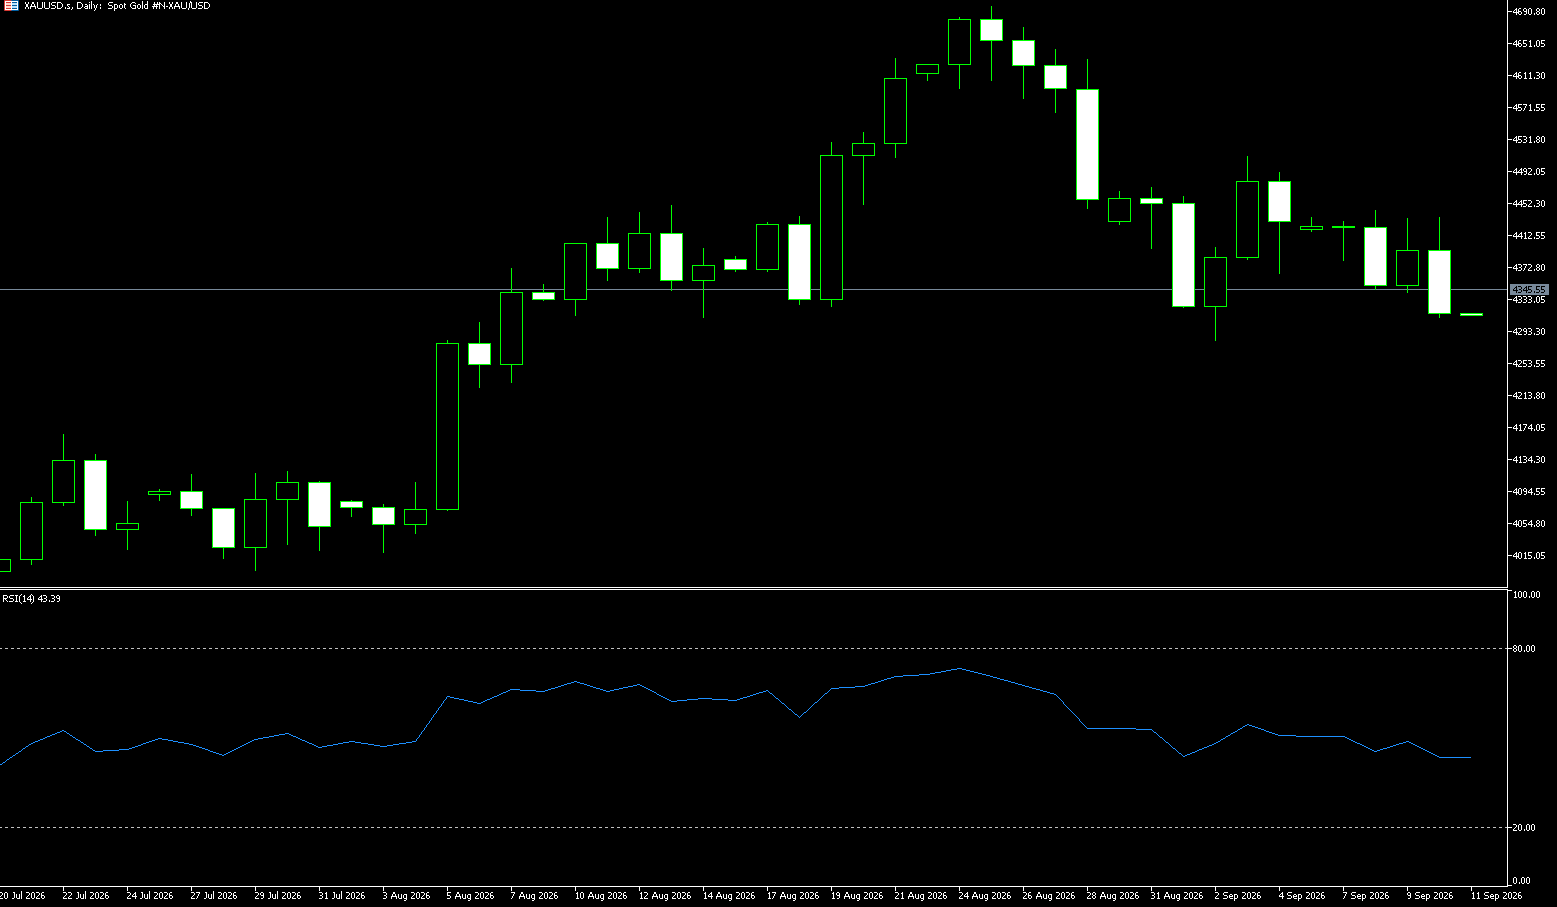
In early trading on Tuesday, spot gold traded near $4,360 per ounce. Prices faced pressure as market expectations for progress in US-Iran relations during the UN General Assembly session eased inflation concerns. The US dollar rose slightly against a basket of six major currencies, extending gains of over 1% seen after last week's Federal Reserve rate hike; this increased the cost of gold for holders of other currencies. Bullish sentiment remains dampened by concerns over US monetary tightening—factors that pushed the US Dollar Index to a more than two-month high last Friday—creating headwinds for the precious metals market. Traders currently price in an 88% probability of a Fed rate hike in December; while gold is traditionally viewed as an inflation hedge, its appeal diminishes relative to interest-bearing assets in a high-interest-rate environment. Any short-term weakness in the precious metals market is expected to be limited—driven primarily by moderate selling from Commodity Trading Advisors (CTAs)—and will increasingly be viewed as a buying opportunity.
The gold market is currently characterized by a clear tug-of-war between bulls and bears. On one hand, hawkish signals from the Fed, a strengthening dollar, and rising real interest rate expectations are weighing on prices; on the other, central bank gold purchases, ETF inflows, and potential safe-haven demand continue to provide a floor of support. Moving forward, key factors to watch include statements from Federal Reserve officials, the US Dollar Index, US Treasury yields, and developments in the Middle East; these elements could determine whether gold can reclaim the $4,400 mark. On the daily chart, gold has pulled back to the vicinity of $4,350—slightly below the middle Bollinger Band—but remains well above the 100-day simple moving average (SMA) at $4,317, meaning the medium-term bullish structure remains intact. The RSI stands at approximately 48.95 (neutral zone), indicating that the market is currently undergoing consolidation at elevated levels rather than facing extreme oversold conditions. For the short term, the primary support level to watch is the 100-day SMA at $4,317; if this level holds, gold retains the potential to maintain a medium-term structure characterized by a bullish bias within a range. Further downside levels to monitor include the $4,300 round-number mark and the $4,257 low from September 17. On the upside, the initial focus is the $4,390 level (20-day SMA); a breakout above this point could lead to a test of the $4,434 high recorded on September 10.
Consider going long on gold at $4,360 today; stop-loss at $4,355; targets: $4,400 and $4,390.
AUD/USD
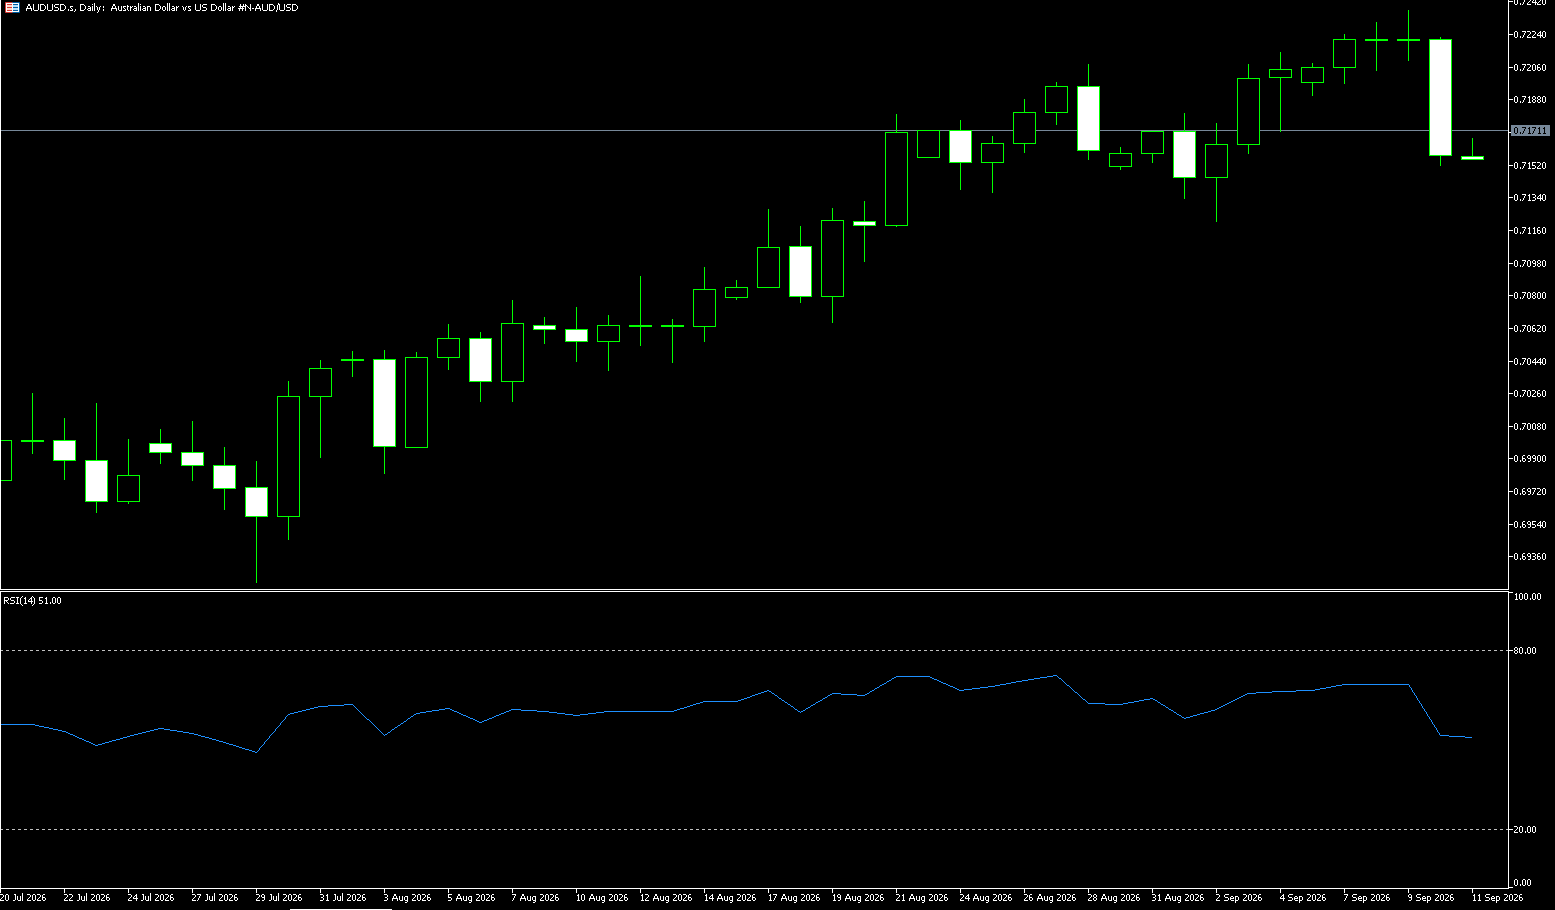
During Tuesday's session (September 22), the AUD/USD pair traded within a narrow range, currently hovering near 0.7120. Market attention is focused on the Australian dollar's outlook following recent hawkish remarks from Reserve Bank of Australia (RBA) officials. RBA Chief Economist Sarah Hunter stated that the central bank might need to raise interest rates for the fourth time this year, citing rising oil prices driven by the Middle East situation and domestic demand outstripping supply. Markets have priced in a 95% probability of a rate hike to 4.60% at the September 29 meeting and anticipate rates peaking at 4.85% early next year. Hunter's comments have reinforced, rather than challenged, these hawkish market expectations. The market has fully priced in an expectation of a rate hike to 4.60% on September 29, with the peak rate projected to reach 4.85% early next year. The Australian dollar and interest-rate-sensitive assets are expected to closely monitor RBA Governor Bullock's remarks at the post-decision press conference for confirmation of this hawkish stance.
On the daily chart, AUD/USD trades at 0.7120, holding above the 55-day, 100-day, and 200-day simple moving averages (SMAs) clustered between 0.7074 and 0.7015; this reinforces a short-term bullish bias. The 14-day Relative Strength Index (RSI) sits around 63, while the Average Directional Index (ADX) is subdued near 22, indicating a consolidation phase rather than a strong trend and suggesting that bulls may need a fresh catalyst to challenge upper resistance levels. On the downside, initial support lies at the recent low of 0.7079, with the nearby 100-day and 55-day SMAs providing further support at 0.7078 and 0.7074, respectively; deeper demand is seen at 0.7015. On the upside, immediate resistance is found at 0.7161 (20-day SMA) and the 0.7200 psychological level; a breakout above these would pave the way for a broader bullish extension.
Consider going long on the AUD at 0.7108 today; stop-loss: 0.7100; targets: 0.7150, 0.7160.
GBP/USD
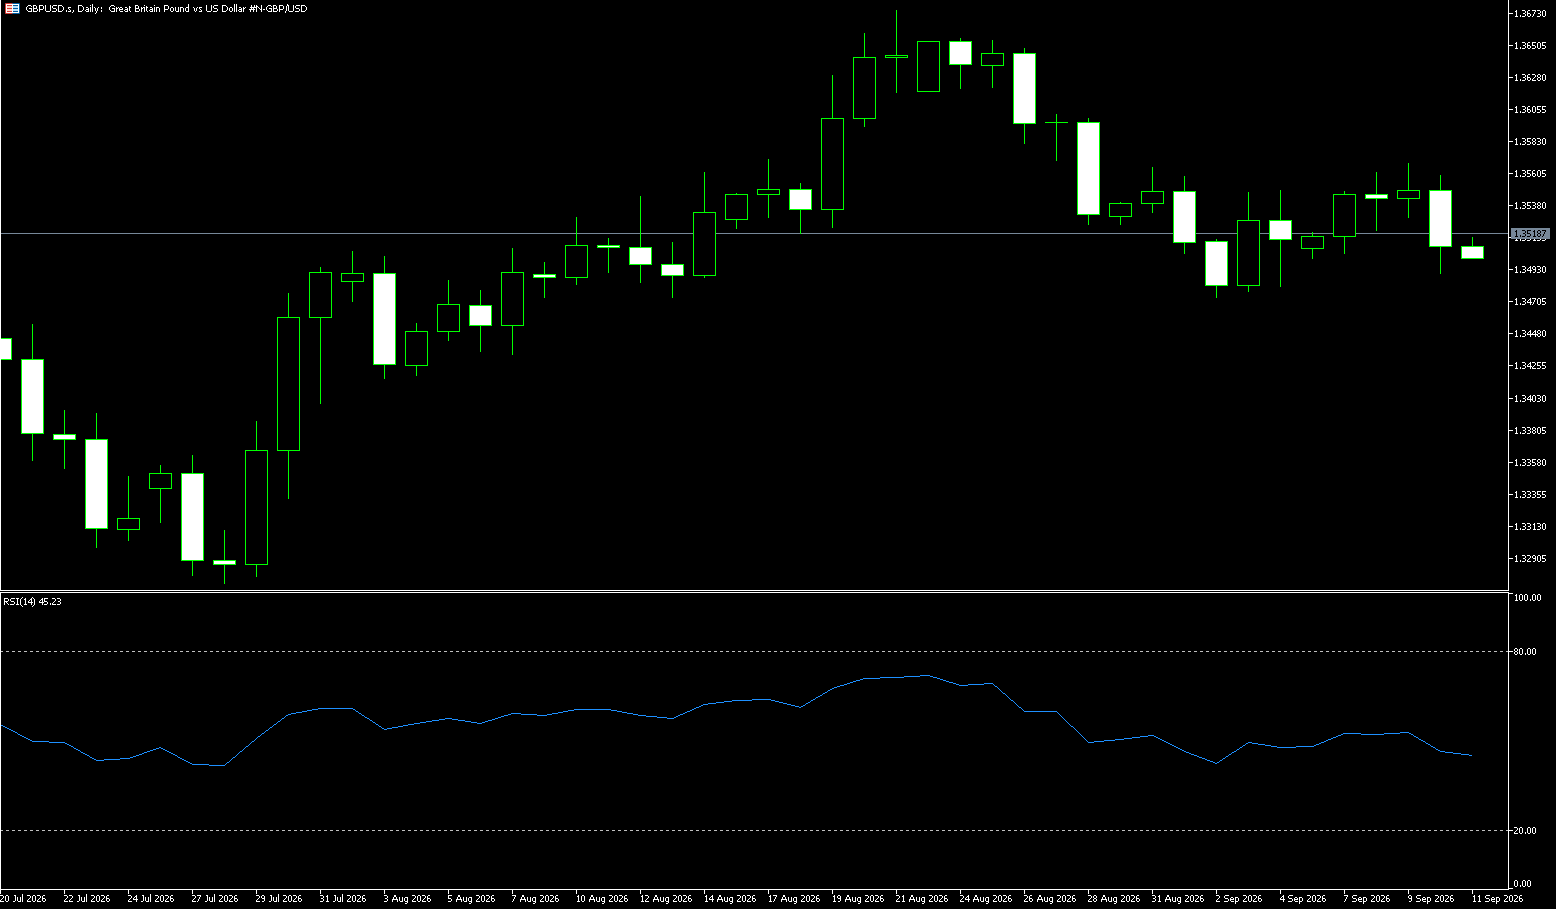
On Tuesday, GBP/USD surrendered earlier gains after UK data showed public sector borrowing in August exceeded expectations, reigniting market concerns regarding the government's fiscal position. The pair has retreated from an intraday high in the 1.3390 area to below 1.3350, though it remains within the trading range established over the past few days. Data released by the UK Office for National Statistics (ONS) shows that net borrowing surged to £18.26 billion in August, a sharp increase from the upwardly revised £2.04 billion in July and well above the £15.70 billion expected by market analysts. The ONS report added that borrowing rose by approximately one-fifth compared to August of last year, exceeding government revenue from taxes and other sources—partly due to inflationary pressures stemming from the conflict in the Middle East. The report noted that government debt remains below the £3 trillion threshold, although it represents a smaller share of the economy than it did a year ago.
The GBP/USD pair maintains a mildly bearish short-term bias, trading below the 100-day simple moving average (SMA) at 1.3434 and the 50.0% Fibonacci retracement level at 1.3407. Technical indicators show the 14-day Relative Strength Index (RSI) hovering near 32; while this suggests weak momentum and indicates the pair is not yet deeply oversold, it aligns with the current selling pressure. On the downside, initial support lies at the 61.8% Fibonacci retracement level of 1.3344, followed by the 78.6% level at 1.3254 and a structural anchor near 1.3139. On the upside, a daily close above the 50.0% retracement level of 1.3407 would shift the focus toward the 100-day SMA at 1.3434, with subsequent resistance found at the 38.2% Fibonacci retracement level of 1.3471 and the 23.6% level of 1.3549.
Consider going long on GBP at 1.3330 today; stop-loss: 1.3320; Targets: 1.3370; 1.3380
USD/JPY
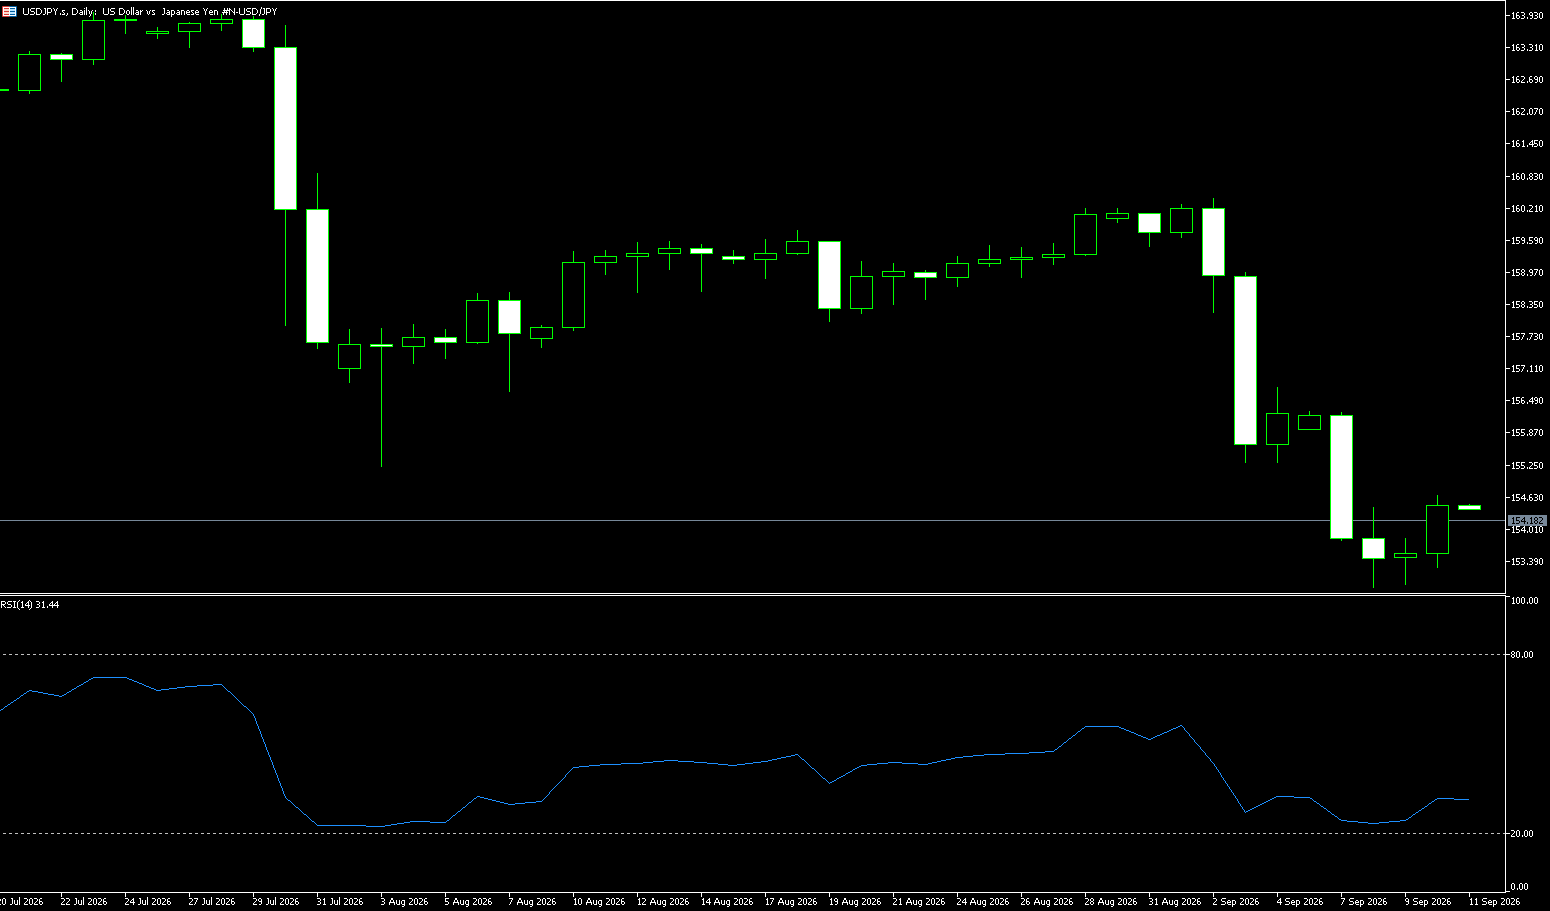
The yen depreciated to around 157.40 per dollar on Tuesday, marking its third consecutive day of decline and putting traders on alert for possible intervention, particularly as Japan is currently in the midst of an extended holiday period. Tokyo has previously intervened in the foreign exchange market during periods of low liquidity associated with holidays, and concerns have intensified following reports late Friday that the Bank of Japan conducted a rate check with market participants. The yen is also under pressure from a strong US dollar, as hawkish comments from Federal Reserve officials have bolstered expectations for further US rate hikes. Last week, the yen fell sharply following a widely anticipated rate hike by the Bank of Japan—a decision that saw dissent from two policymakers. Governor Kazuo Ueda stated that the Bank of Japan remains committed to raising interest rates and adjusting the degree of monetary easing based on changing economic conditions, while noting that accommodative financial conditions are expected to persist to support economic growth.
In terms of capital flows, the recent rise in USD/JPY does not necessarily imply that the market has completely abandoned the yen. Japanese financial authorities are keeping a close watch on the yen's rapid depreciation, and discussions regarding the risk of currency intervention have begun to circulate. Market reports from September 21 indicate that speculation about potential measures by Japanese authorities to stabilize the exchange rate heated up after the yen experienced a significant drop the previous week. Consequently, as USD/JPY approaches previous highs, investors need to pay close attention to potential policy responses. From a daily chart perspective, USD/JPY remains elevated, with the overall trend currently leaning bullish; however, the zone between the 158.00 round-number mark and the 158.44 level (200-day moving average) has increasingly become a significant resistance area. If the exchange rate can firmly establish itself above the 158.00–158.44 range, the next level to watch is the previous swing high of 160.36. Conversely, if the 158.00–158.44 zone continues to cap the price and USD/JPY falls back below 156.65 (20-day moving average), short-term downward pressure could intensify, potentially pushing the pair toward the 156.00 level.
Consider shorting the US dollar at 157.55 today; stop-loss: 157.70; targets: 156.50, 156.60.
EUR/USD
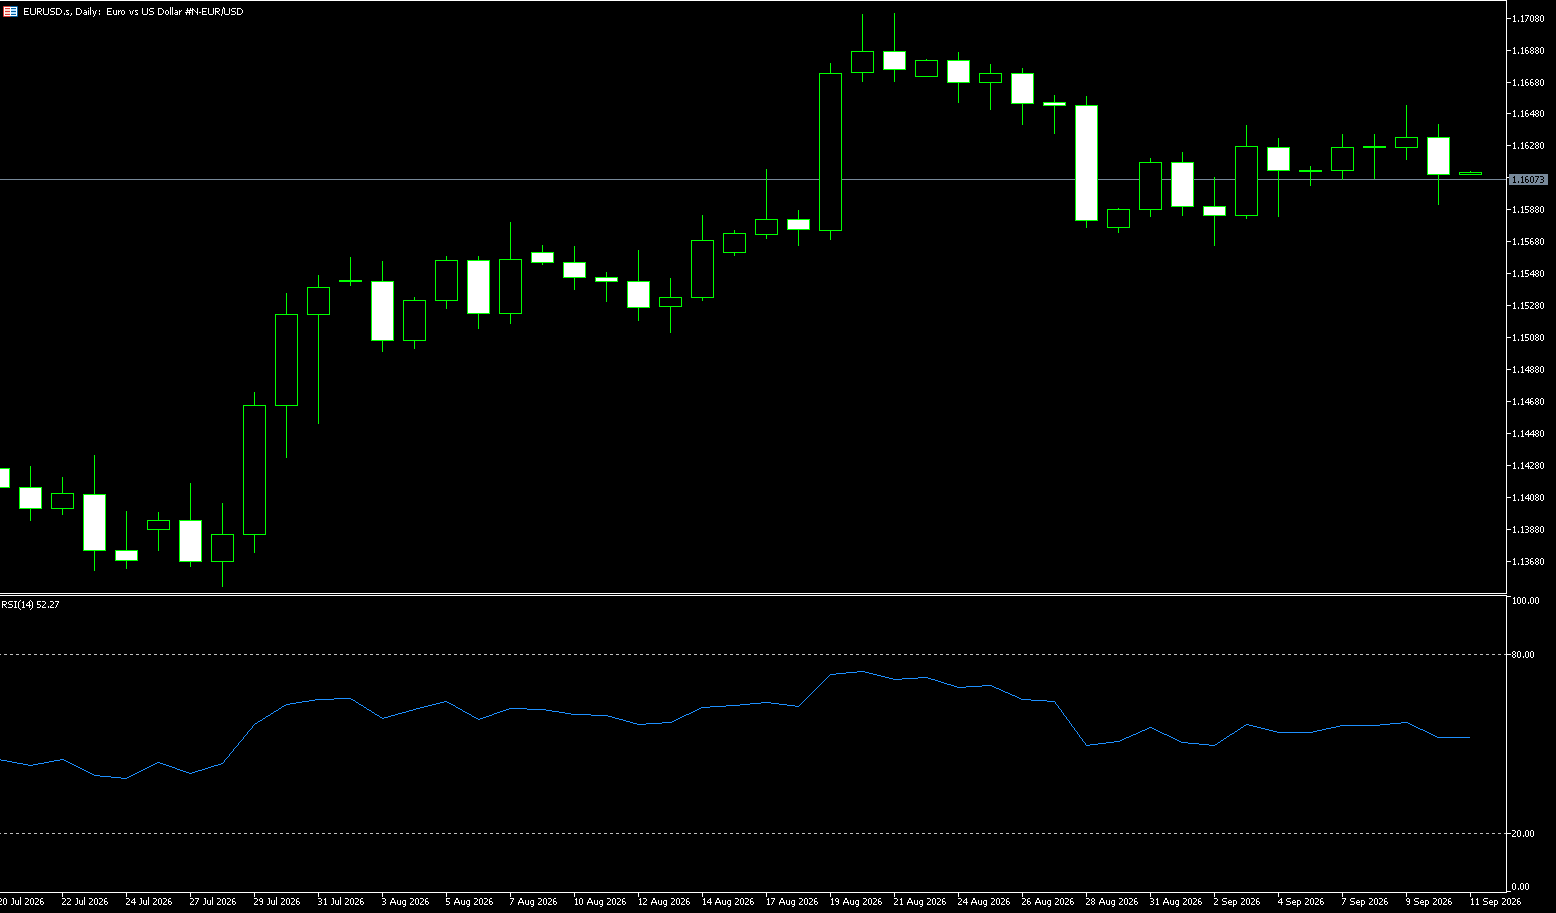
During the European session on Tuesday, EUR/USD remained subdued for the second consecutive trading day, trading near 1.1450. The pair faced headwinds as the US dollar recovered its intraday losses, driven by dominant hawkish sentiment regarding the Federal Reserve's policy stance. Fed official Musalem delivered a notably hawkish speech—scoring 8/10 on the FXS Speechtracker (above the historical average of 7.4/10)—indicating a stronger inclination toward policy tightening compared to the established baseline. This dynamic favors the US dollar while weighing on risk-sensitive currencies. The FXS Fed Sentiment Index rose 0.42 points to 149.96, remaining firmly in hawkish territory and aligning with the above-baseline tone captured by the FXS Speechtracker. A reading well above 100 underscores that the broader context of Fed communications remains clearly tilted toward further tightening; such a pattern typically supports the US dollar while pressuring the euro, Japanese yen, and other major currencies.
The euro is under pressure due to escalating political instability in Germany. Following elections in a northeastern German state on Sunday, the far-right Alternative for Germany (AfD) party secured first place, while the conservative party—led by Friedrich Merz—suffered its worst regional defeat in post-war history, leaving his position increasingly precarious. On the daily chart, EUR/USD is trading at 1.1450, extending a pullback that saw it break below short- and medium-term exponential moving averages (EMAs), thereby reinforcing a near-term bearish bias. The 9-period EMA (1.1509) and 50-period EMA (1.1548) sit above the current price, suggesting limited upside potential as long as the pair remains below these levels. Meanwhile, the 14-day Relative Strength Index (RSI) has slipped to a low near 30, signaling emerging oversold conditions; this may slow the descent toward the 1.1400 (round number) and 1.1374 (July 30 low) levels, rather than immediately triggering a reversal.
Consider going long on the Euro at 1.1440 today; stop-loss: 1.1430; targets: 1.1490.
Stock Analysis:
Australia ASX 200 Index
Market Overview:
The ASX 200 index rose 26 points, or 0.3%, to close at 8,758 on Tuesday, breaking a spell of lackluster trading. Modest gains in US futures drove a rally in Wall Street chip stocks on Monday, bolstered by optimism surrounding Meta's new AI agent. Prospects for UN-led Middle East negotiations and an upcoming US-China bilateral summit also boosted risk appetite. Investors gravitated toward the technology, consumer durables, manufacturing, and services sectors; however, gains were capped by the Reserve Bank of Australia's warning of potential upside risks to inflation—driven by persistently high energy costs and strong domestic demand—which reinforced expectations of a rate hike next week. Market caution is also mounting ahead of the release of preliminary Australian PMI data for September and August labor figures later this week.
Tech stocks led the gains, with Nextdc rising 3.6%, Technology One up 2.9%, and Wisetech Global up 2.8%. Other notable performers included Lynas Rare Earths (up 3.8%), ASX Ltd (up 2.8%), and Qantas (up 1.8%), highlighting selective strength across the market. Sector Performance:
Top Gainers: Information Technology (+2.67%), Consumer Discretionary, and REITs. Tech stocks strengthened, driven by the AI rally in US markets; WiseTech and Xero posted notable gains. The resources sector (iron ore and copper-related) saw modest gains, with BHP and Rio Tinto closing slightly higher.
Top Decliners: Utilities (-2.03%) and Energy (-1.16%). Woodside Energy and Santos fell; a pullback in crude oil prices weighed on energy stock performance.
Technical Analysis:
ASX 200 Index Tuesday Close: 8,757.3 points (+0.29%, up 25.4 points). Intraday Structure: The index opened higher, driven by the overnight strength of US tech stocks, and surged toward the 8,800 level before bullish momentum waned. It gradually gave back some gains during the session, closing in the lower-middle range of the day's movement. The resulting candlestick—a small bullish candle with an upper shadow—indicates a "rally-then-pullback" oscillation pattern; bullish momentum was relatively weak, and selling pressure emerged at higher levels. Technical Indicators: RSI is in the neutral zone (around 55), showing no overbought conditions and no clear directional dominance between bulls and bears. Moving Averages: The index holds above short-term moving averages but faces resistance near the key 8,800 level. Volume: Trading volume was moderate with no significant breakout, characterizing a range-bound market driven by existing capital.
Wednesday (09-23) Technical Outlook: Overnight gains in the Nasdaq AI sector boosted risk appetite; however, the RBA Governor's warning regarding upside inflation risks—and the market beginning to price in a potential rate hike next week—capped the index's upside potential. The market is awaiting Wednesday's release of Australia's preliminary September PMI and August employment data. Wednesday Scenario Forecast—Bullish Scenario: If US markets remain strong overnight and Australian PMI/employment data come in moderate, and the index stabilizes above 8,775 before effectively breaking through 8,800, the short-term outlook would shift to bullish, with a target of 8,875. A breakout must be accompanied by high volume; otherwise, there is a risk of a "false breakout" and subsequent pullback. Base-case scenario (highest probability): Neutral data leads to continued oscillation within the 8700–8800 range—characterized by back-and-forth movement, pullbacks after facing resistance at highs, and rebounds after testing support levels. Bearish scenario: Hot employment data and higher-than-expected PMI inflation figures fuel expectations for interest rate hikes; the index breaks below the 8700 support level to test 8675; if it breaks through 8675 on high volume, the downside target is 8600.
Trading Strategy (Short-term perspective)
Suitable for SPI futures and ASX200 index CFDs/options; not suitable for heavy, long-term positions.
1. Bullish Strategy
• Long on Pullback: Look to go long if the price stabilizes in the 8700–8710 range and forms a reversal candlestick (indicating a halt to the decline); place stop-loss below 8670; target 8775, then 8800 upon breakout; take profits in stages near 8800.
• Long on Breakout: Wait for the price to hold above 8800 on high volume before entering a long position; stop-loss below 8770, target 8875; do not place long orders in anticipation of a breakout, as the risk of a false breakout is high.
2. Bearish Strategy
• Short on Resistance: Look to go short if the price rebounds to the 8770–8790 range but faces resistance and fails to hold above 8800, forming a stalling candlestick; place stop-loss above 8815; first target 8700, with a secondary target of 8675 if the level breaks.
Key Risk Warnings:
1. Fundamental Risk: Australian PMI and employment data released on Wednesday are key catalysts; data significantly stronger than expected would boost RBA rate-hike expectations, directly pressuring the ASX200, whereas weak data would be bullish for the index.
2. External Market Correlation Risk: Overnight US stock volatility, as well as fluctuations in crude oil, iron ore, and the AUD/USD exchange rate, will impact the ASX200; a strengthening Australian dollar is unfavorable for resource stocks. 3. Technical Risk: The market is currently in a range-bound phase. False breakouts frequently occur in such markets, so stop-loss levels should not be set too wide. If the 8,800 level fails to break through after multiple attempts, beware of a shift from range-bound trading to a downward trend.
Shanghai Composite Index
Market Overview:
On Tuesday, the Shanghai Composite Index closed almost flat at approximately 3,952.1 points, while the Shenzhen Component Index edged down to around 13,723.7 points as investors assessed high-level talks between China and the U.S. Officials from both nations concluded a second day of discussions—covering artificial intelligence, investment, and trade—in preparation for the upcoming Trump-Xi summit in the United States. The highly anticipated meeting is scheduled for September 23–25 and is expected to focus on artificial intelligence, the conflict involving Iran, export controls, and rare-earth supplies. Investors are also watching to see if Beijing and Washington can extend the trade truce before it expires in November. U.S. Trade Representative Jamieson Greer stated that the two sides have not yet agreed on extension terms, while hinting that Washington might support an extension of three to six months.
Notable gainers included PetroChina (+1.12%), China Shenhua Energy (+1.52%), and Haiguang Information Technology (+3.88%). In contrast, underperformers included Zhongji Innolight (-1.41%) and Suzhou TFC Optical Communication (-1.22%).
Sector Performance:
Top-performing sectors: Media, AI applications, semiconductor chips, pharmaceutical CROs, and coal; the media sector showed the strongest performance, with multiple stocks hitting daily limit-up.
Worst-performing sectors: Port and shipping, tourism and hotels, precious metals, and MLCCs. Technical Analysis:
Shanghai Composite Index (SSEC) closed at 3,952.13 (+0.06%) on Tuesday (September 22). It opened at 3,963.81, with a high of 3,967.68 and a low of 3,945.42. Total turnover across both exchanges was 2.1537 trillion yuan, an increase of 105.5 billion yuan from the previous day. Market breadth showed 2,374 stocks rising and 3,029 falling, reflecting a divergent market where major indices remained strong while individual stocks were weak. K-line structure: The index opened high and rallied in the morning session but faced resistance near 3,967 and pulled back; it found support near 3,945 in the afternoon and recovered slightly towards the close, forming a small "pseudo-bullish" candle with an upper shadow. The upper shadow indicates heavy selling pressure in the 3,965–3,970 range, while the lower shadow suggests buying support; bulls and bears are now engaged in a tug-of-war within a trading range. The index closed slightly below the 60-day moving average, placing it at a critical juncture between bullish and bearish forces. In the short term, the 5-day and 10-day moving averages continue to provide support, and the 20-day moving average is trending upward; the 60-day moving average (at 3,954) serves as the day's watershed for strength versus weakness, with the index hovering tightly around it. The medium-term upward trend of the moving averages remains intact, though short-term bullish momentum has clearly waned. Technical indicators: On the daily chart, the MACD red histogram continues to shorten, and the DIF line has flattened; the KDJ indicator has turned downward from a high level, signaling a correction phase; the 60-minute MACD shows a bearish divergence, suggesting a potential short-term pullback. RSI (14) stands at 55.42; while not in overbought territory, upward momentum is sluggish.
Trading Strategy:
Conditions for Long Entry
Enter with a small position ("buy the dip") if the index pulls back to the 3,940 area, stabilizes on the intraday chart with strong buying support, and capital flows back into key sectors. Conditions for adding to the position: Increase holdings only after the index stands firmly above 3,964 on high volume; do not chase highs prematurely at resistance levels. Conditions for Taking Profits and Reducing Positions
When the index rallies to the resistance zone of 3964–3970 but trading volume fails to keep pace, realize profits on a portion of holdings; for individual stocks that stall after a rally or sectors where multiple stocks fail to hold their daily limit-up positions, prioritize cashing out high-flying thematic stocks.
Key Risk Warnings:
1. Technical Risk: The market is currently in a window of volatility and potential trend reversal. The 60-day moving average serves as a critical dividing line between strength and weakness; a breakdown below this level on high volume would widen the scope for short-term correction. There is significant divergence between the index and individual stocks; even if the index does not fall, many individual stocks remain at risk of pulling back.
2. Capital Risk: The market is driven by a fixed pool of capital; sector rotation is extremely rapid, and the sustainability of main market themes is weak, creating a scenario where the index rises but investors fail to make a profit.
3. External Disturbance Risk: Volatility in overseas stock markets, exchange rate fluctuations, and changes in expectations regarding overseas policies can trigger significant abnormal movements at the A-share market opening.
4. Sentiment Risk: High-flying thematic stocks have accumulated substantial unrealized gains; should market sentiment cool, the magnitude of short-term pullbacks could rapidly intensify.
Disclaimer: The information contained herein (1) is proprietary to BCR and/or its content providers; (2) may not be copied or distributed; (3) is not warranted to be accurate, complete or timely; and, (4) does not constitute advice or a recommendation by BCR or its content providers in respect of the investment in financial instruments. Neither BCR or its content providers are responsible for any damages or losses arising from any use of this information. Past performance is no guarantee of future results.
More Coverage







2026 © - All Rights Reserved by BCR Co Pty Ltd
Risk Disclosure:Derivatives are traded over-the-counter on margin, which means they carry a high level of risk and there is a possibility you could lose all of your investment. These products are not suitable for all investors. Please ensure you fully understand the risks and carefully consider your financial situation and trading experience before trading. Seek independent financial advice if necessary before opening an account with BCR.
BCR Co Pty Ltd (Company No. 1975046) is a company incorporated under the laws of the British Virgin Islands, with its registered office at Trident Chambers, Wickham’s Cay 1, Road Town, Tortola, British Virgin Islands, and is licensed and regulated by the British Virgin Islands Financial Services Commission under License No. SIBA/L/19/1122.
Open Bridge Limited (Company No. 16701394) is a company incorporated under the Companies Act 2006 and registered in England and Wales, with its registered address at Kemp House, 160 City Road, London, England, EC1V 2NX. Open Bridge Limited acts solely as a payment processor for BCR Co Pty Ltd and does not provide any financial, trading, or investment services on its behalf. Open Bridge Limited's role is limited to payment processing.


 English
 简体中文
简体中文
 繁體中文
繁體中文
 Bahasa
Melayu
Bahasa
Melayu
 Tiếng
Việt
Tiếng
Việt
 ไทย
ไทย
 日本語
日本語
 한국어
한국어
 ភាសាខ្មែរ
 español