


0
US Dollar Index
The latest Producer Price Index (PPI) report showed the biggest drop in producer prices in five years, mainly due to falling profit margins, easing inflationary pressures and supporting the case for policy easing. Retail sales data also disappointed, suggesting weakening consumer momentum. The dollar has been under pressure against a number of Asian currencies this week, trading around 100.80 during Thursday's trading session. Despite the recent easing of tensions, the dollar remains under pressure as investors assess ongoing trade-related uncertainty. Speculation is growing that Washington may favor a weaker dollar to support its trade agenda. The Trump administration has argued that a strong dollar puts U.S. exporters at a disadvantage compared to weaker regional currencies. Improved global trade sentiment has eased recession concerns, prompting markets to reduce expectations for a rate cut by the Federal Reserve. This has provided some support for the dollar. The recent dollar rally driven by hopes of an easing of U.S.-China tariffs is losing momentum as traders refocus on the broader impact of U.S. trade policy.
Headlines about possible currency adjustments appear to be enough to trigger a depreciation in the dollar. It is expected that the US Dollar Index may return to below 100. On the upside, the 101.98{early week high}, and 102.00{round mark} area is the first big resistance to face again, as it has served as a key level during December 2023 and as the basis of the inverted head and shoulders (H&S) pattern in the summer of 2024. If the US dollar bulls push the US dollar index higher, the 60-day simple moving average at 102.45 will come into play. On the other hand, the previous resistance at 100.52{9-day moving average} now acts as a solid support level, followed by 100.00{market psychological mark}. Further down, technical support is at 99.17 (May 6 low).
Today, consider shorting the US dollar index around 100.95, stop loss: 101.10, target: 100.50, 100.40

WTI spot crude oil
WTI crude oil fell nearly 2.0% in Asian markets on Thursday after falling nearly 1.2% in China and the United States last week, trading around $61.20 per barrel. The unexpected increase in US crude oil inventories has raised investors' concerns about oversupply. Iran is ready to sign a conditional nuclear agreement with Trump to abandon highly enriched uranium. Earlier government data showed that US crude oil inventories unexpectedly increased last week, raising investors' concerns about oversupply. Market sources said that API industry data also showed a sharp increase of 4.3 million barrels in crude oil inventories last week. There is no doubt that the increase in crude oil inventories in the API data did not help. On the other hand, OPEC+, an alliance of oil-producing countries including the Organization of the Petroleum Exporting Countries (OPEC) and its allies, has been increasing supply to the market. However, OPEC on Wednesday lowered its forecast for oil supply growth this year from the United States and other producers outside the OPEC+ alliance. A rebound in the U.S. dollar also dragged down oil prices on Wednesday.
From a technical perspective, the daily chart shows that the market is about to fall into a repeating channel, which means the target is $60.00 {market psychological level}. The series of upward trend forecast levels starting from $55.14 {May 5 low} are still valid. Once it breaks through $62.12 {34-day simple moving average}, it may rise further to The range is from $63.48 (the high point on the 13th of this month) to $64.00 (the round number mark). The 14-day relative strength index (RSI) of the technical indicator is now around 48.80, indicating that the short-term trend is unclear. If the WTI crude oil price falls below the 20-day simple moving average of $60.82, the short-term rise may face the risk of a correction to $60.00 (the market psychological mark). A breakout will point directly to the $59.57 (the low point on May 9).
Today, you can consider going long on crude oil around 61.00, stop loss: 60.80; target: 63.00; 63.20

Spot gold
Gold briefly fell on Thursday but then rose to nearly $3,240 an ounce, up nearly 2.0%. As investors appeared to turn to safe-haven assets again due to weak U.S. data and setbacks in negotiations between Ukraine and Russia. U.S. retail sales barely grew in April as consumers cut spending on cars, sporting goods and other imported goods, worried about rising prices due to tariffs. Meanwhile, producer price index prices unexpectedly fell, mainly due to a 1.6% drop in profits earned by wholesalers and retailers, suggesting that businesses may be absorbing some of the impact of increased tariffs. Meanwhile, Ukraine's president said the diplomats Moscow sent to Istanbul for peace talks were of low level, indicating a lack of serious intent, while Trump asserted that Ukraine's question was made before his meeting with Putin. No progress will be made on the issue.
In the short term, trade optimism and a stronger dollar may continue to suppress gold prices, and the technical side also shows that downside risks have not yet been fully released. Although the long-term trend remains bullish, the market will not be surprised if this round of bearish momentum continues for a few days. Three key downside target prices in the short term: $3,136, $3,073 and the $3,000 mark. It is worth noting that gold just hit a record high of $3,500.10 last month, and the cumulative increase this year is still 21.7%. This round of correction can be regarded as a technical correction to the previous rapid rise. From the technical indicators, the 14-day relative strength index (RSI) currently remains below the midline, close to 43, indicating more downside potential. However, if buyers can hold the 55-day moving average support at $3,131 and move towards $3,300 {market psychological barrier}, A rebound to the 9-day moving average of $3,296 is possible. Before $3,300-3,295, $3,253 {30-day moving average} is the first resistance level.
Consider going long gold before $3,235 today, stop loss: 3,230; target: 3,260; 3,265

AUD/USD
The Australian dollar retreated slightly to around $0.6410 on Thursday after stronger-than-expected employment data supported a more hawkish outlook for monetary policy. Official data showed that the Australian economy added 89,000 net jobs in April, lifting total employment to a record 14.64 million, far exceeding expectations of 20,000. The unemployment rate remained at 4.1%, in line with expectations. Although the Reserve Bank of Australia is widely expected to cut the cash rate by 25 basis points to 3.85% at its meeting next week, traders have lowered expectations for further easing. The market now expects 76 basis points of rate cuts for the full year, compared with 1 a few weeks ago. 00 basis points have declined. On the external front, investors continue to monitor the development of US-China trade relations, with the focus shifting to the long-term impact of global growth and trade dynamics.
AUD/USD hovered around 0.6400 on Thursday. Daily chart analysis suggests a bullish bias, with the pair holding around the 20-day simple moving average of 0.6414. The pair's rebound is supported by the 14-day relative strength index (RSI) of the technical indicator being above 50. On the upside, the pair could retest above the 200-day simple moving average of 0.6454. A sustained break above this level could be a move towards the mid-week high of 0.6501, and 0.6500{market psychological barrier} to lay the foundation for an uptick. Initial support is in the 0.6400{round mark} area. A firm break below these levels could weaken the short- to medium-term outlook and open the way for a deeper decline towards the 30-day simple moving average near 0.6345.
Today it is recommended to go long on the Australian dollar before 0.6395, stop loss: 0.6380, target: 0.6450, 0.6460

GBP/USD
GBP/USD rebounded from recent losses and traded above 1.3300 on Thursday. The pair was supported by a weaker dollar as investors weighed ongoing trade-related uncertainties despite a slight easing of tensions. Market speculation is that Washington may prefer a weaker dollar to strengthen its trade position. The Trump administration has argued that a strong dollar puts U.S. exporters at a disadvantage relative to weaker regional currencies. However, downward pressure on the dollar may be limited. Improved global trade sentiment has eased recession concerns and reduced expectations for aggressive rate cuts by the Federal Reserve. Meanwhile, the pound remained stable, Traders are reassessing the outlook for Bank of England policy ahead of the release of labor market data for the three months to March on Tuesday.
GBP/USD bids continued to enter a new congestion phase on Thursday, with the pair engaging in a protracted battle around the 1.3300 mark. Price action has been volatile since the pullback from the recent high of 1.3445, but bearish momentum has struggled to drag bids back to 1.3107 near the 50-day simple moving average. From a technical perspective, GBP/USD has a neutral to upside bias, but buyers must keep the exchange rate above 1.33. If bulls do this, they will need to push the exchange rate above 1.3356 {May 8 high}, Next up is 1.3400. And challenge the year high of 1.3445. Conversely, a daily close below 1.3300 paves the way for a pullback, with the next key support at 1.3200. A break of the latter would expose this week's low of 1.3139.
Today it is recommended to go long on GBP before 1.3290, stop loss: 1.3280, target: 1.3340, 1.3350

USD/JPY
The yen appreciated to around 145.60 per dollar on Thursday, marking its third straight session of gains as global trade uncertainty continued to weigh on the greenback while boosting other currencies. The yen also benefited from a broad rally in Asian currencies on rumors that Washington is advocating for a weaker dollar as part of ongoing trade talks. The Trump administration believes that the relative weakness of Asian currencies gives Asian exporters an unfair trade advantage over U.S. competitors. Meanwhile, investors are closely watching the progress of U.S.-Japan trade talks, with Tokyo aiming to finalize a deal by June. Prime Minister Shigeru Ishiba stressed that Japan would not agree to a preliminary deal that lacked provisions on automobiles, urging Washington to remove its 25% tariff on Japanese cars.
From a technical perspective, the prospect of USD/JPY attempting a breakout to the 146.00 mark is to retest the 145.40 area or the weekly low set on Wednesday. Next up is a drop to the 145.00 psychological level, which in turn approaches the 144.32 {30-day simple moving average} area, Should be used as a key turning point. If it is effectively broken, it will indicate that the rebound from the lows since the beginning of the year has lost momentum and pave the way for a deeper 142.42 {May 7 low}. On the other hand, the 146.60 area (23.6% Fibonacci rebound level) may provide immediate resistance before the 147.000 round mark. If the latter is continuously broken through strongly, it may trigger a short-term intraday rebound, pushing USD/JPY to the intermediate resistance of 147.70, and then approaching the 148.00 round mark.
Today, it is recommended to short the US dollar before 145.85, stop loss: 146.00; target: 144.70, 144.50

EUR/USD
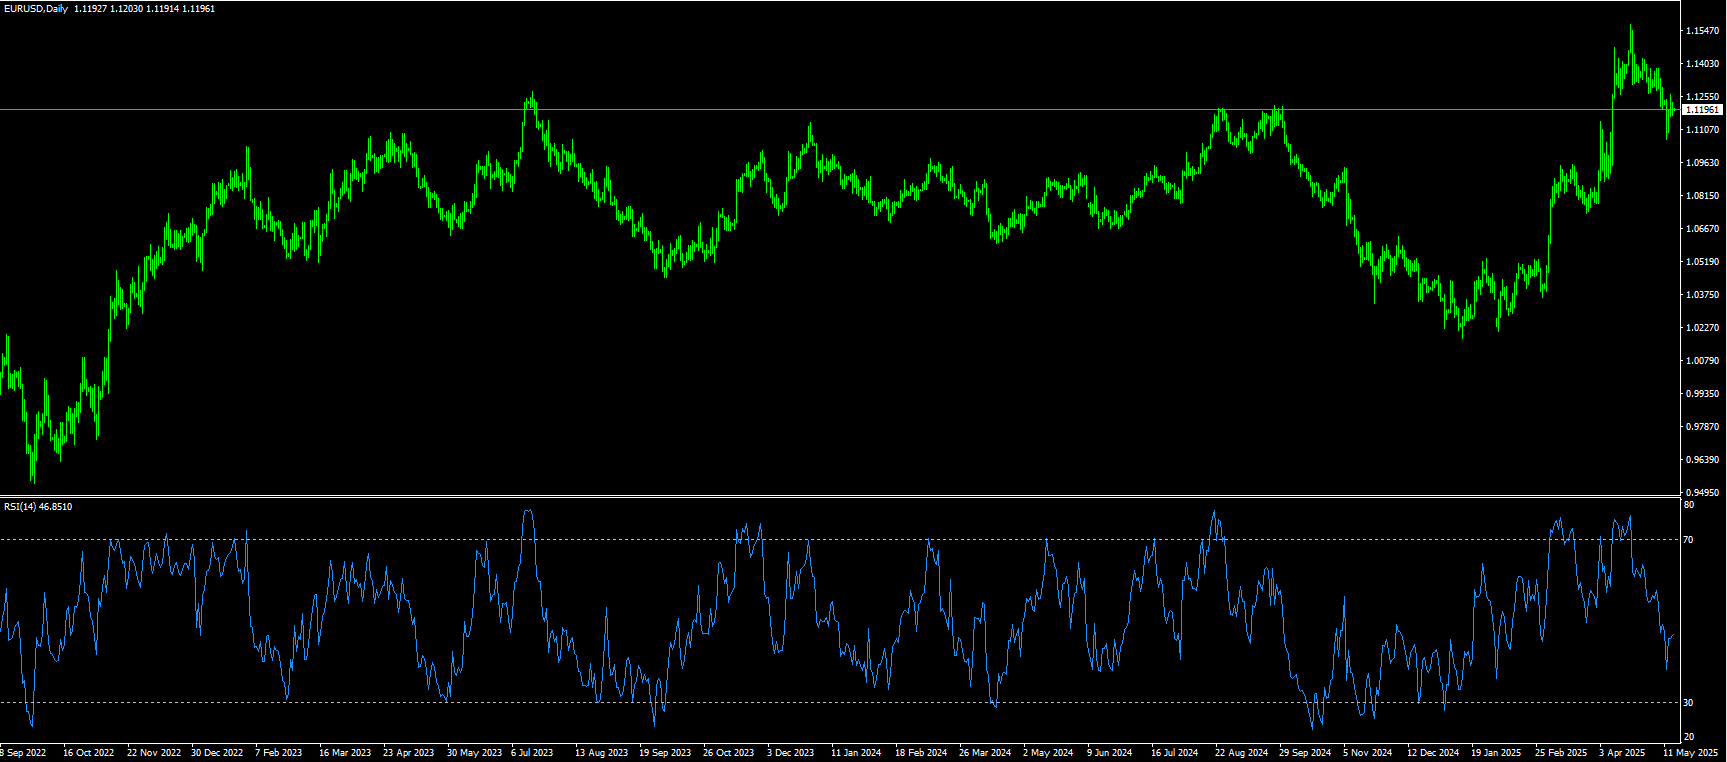
EUR/USD held just below 1.1200 during Thursday’s trading session, with the euro’s strength supported by rising confidence in its role as a reserve currency. Analysts at Capital Economics noted that the single currency is currently enjoying its strongest position in years to close the gap with the U.S. dollar in global reserves. The change is partly due to the policies of U.S. President Donald Trump, which are seen as undermining the traditional safe-haven appeal of the dollar. In addition, Germany’s moves to ease fiscal constraints to increase defense and public spending have further boosted demand for the euro. EUR/USD was also supported by a weaker U.S. dollar as markets remained cautious amid ongoing – albeit slightly easing – trade uncertainty. Attention now turns to upcoming U.S. data, including retail sales and producer price indexes. (PPI).
On Thursday, buyers have temporarily failed to push EUR/USD back above the 1.1200 mark, trading just below this key technical level this week. However, despite limited upside, the euro remains above the 50-day simple moving average near 1.1088. From a technical perspective, the pair presents a mixed picture. The 14-day relative strength index, a technical indicator on the daily chart, hovers around 50, reflecting a neutral state with no clear directional momentum. However, the moving average convergence/divergence indicator signals selling momentum, in line with the cautious tone of the short-term moving averages. The bull-short power indicator further supports the buying sentiment, suggesting a potentially strong base. Support levels are 1.1150, 1.1128 and 1.1092. Resistance levels are 1.1238, 1.1242 and 1.1242.
Today, it is recommended to go long on the euro before 1.1175, with a stop loss of 1.1160 and a target of 1.1240 and 1.1250.
Disclaimer: The information contained herein (1) is proprietary to BCR and/or its content providers; (2) may not be copied or distributed; (3) is not warranted to be accurate, complete or timely; and, (4) does not constitute advice or a recommendation by BCR or its content providers in respect of the investment in financial instruments. Neither BCR or its content providers are responsible for any damages or losses arising from any use of this information. Past performance is no guarantee of future results.
Lebih Liputan


Pendedahan Risiko:Instrumen derivatif diniagakan di luar bursa dengan margin, yang bermakna ia membawa tahap risiko yang tinggi dan terdapat kemungkinan anda boleh kehilangan seluruh pelaburan anda. Produk-produk ini tidak sesuai untuk semua pelabur. Pastikan anda memahami sepenuhnya risiko dan pertimbangkan dengan teliti keadaan kewangan dan pengalaman dagangan anda sebelum berdagang. Cari nasihat kewangan bebas jika perlu sebelum membuka akaun dengan BCR.

 English
 简体中文
简体中文
 繁體中文
繁體中文
 Bahasa
Melayu
Bahasa
Melayu
 Tiếng
Việt
Tiếng
Việt
 ไทย
ไทย
 日本語
日本語
 한국어
한국어
 ភាសាខ្មែរ
 español