


0
US Dollar Index
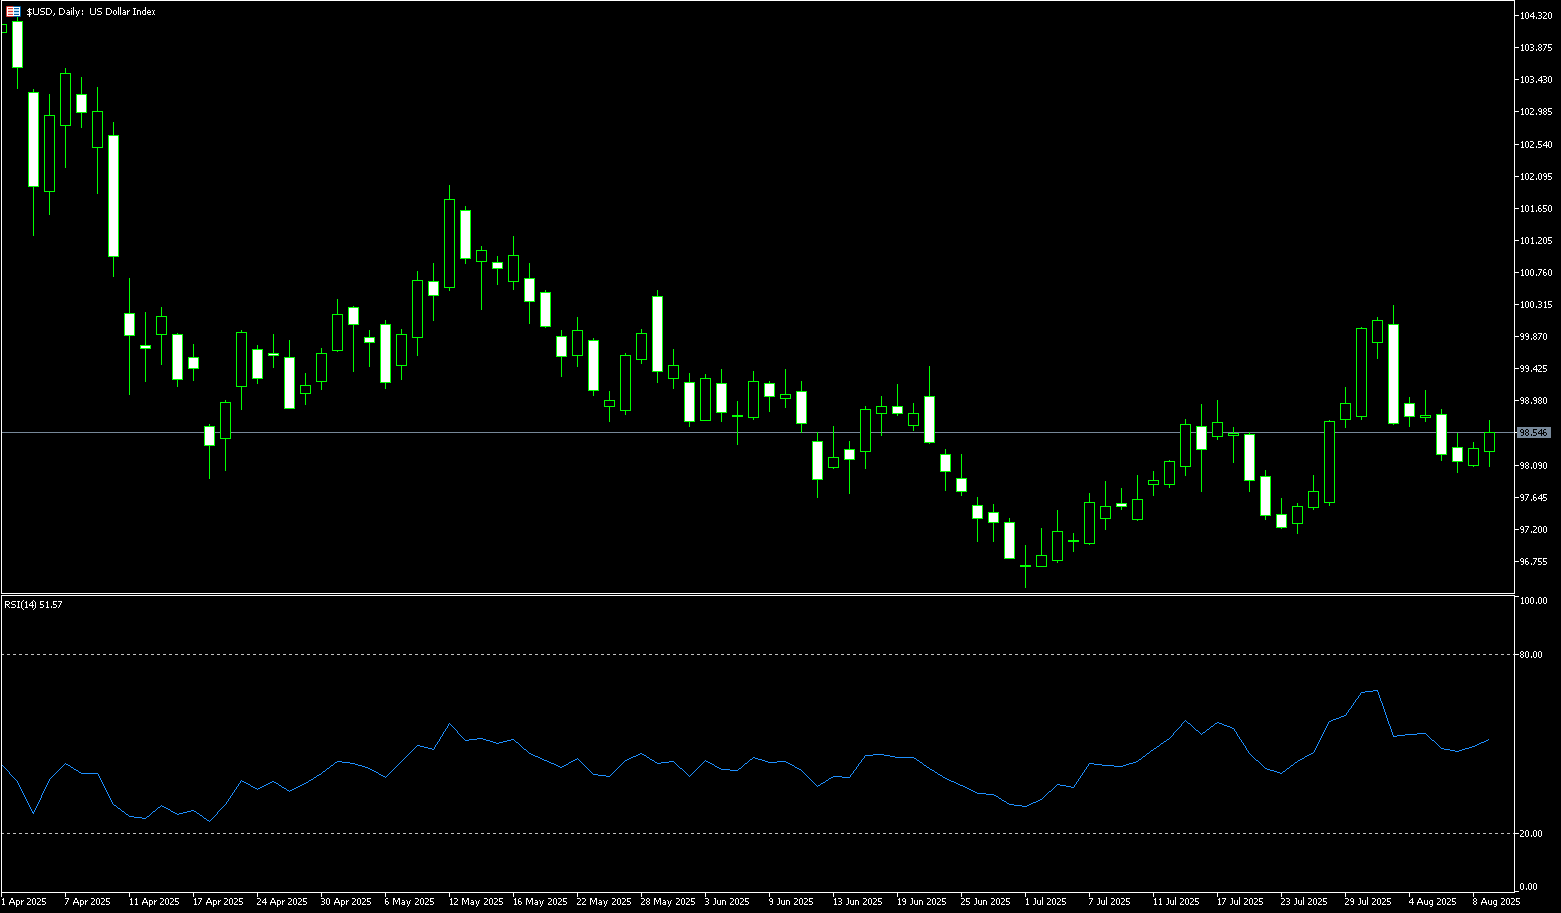
The US dollar index rose slightly to 98.49 on Monday, recovering from Friday's low as traders prepared for key inflation data due tomorrow. Inflation is expected to rise 0.2% in July, slightly lower than June's 0.3%, with the annual rate likely accelerating to 2.8% for the third consecutive month. Core CPI is also expected to accelerate to 0.3%. Despite persistent inflation, the market sees an 88% probability of a 25 basis point rate cut by the Federal Reserve next month, with another rate cut fully priced in throughout the year. Traders also await progress in US-China trade negotiations, with most expecting another 90-day extension for further talks. Meanwhile, attention turns to Friday's meeting between President Trump and President Putin, aimed at finding a solution to the conflict in Ukraine. Finally, a series of economic data releases, including producer price inflation (PPI), retail sales, and industrial production, will be closely watched, along with any changes to the Federal Reserve Board or political pressure from the US government.
Technical analysis on the daily chart shows that the US Dollar Index is currently trading at 98.00, below the 65-day simple moving average (98.59) and the 89-day simple moving average (98.94), indicating continued downward pressure. Price action suggests that repeated attempts to reclaim the 65-day simple moving average resistance level (98.59) have failed, and the short-term structure favors range-bound trading ahead of a potential decline to trendline support around 98.00-97.83. A decisive break below this level could open the way to 97.70 (the lower line of the ascending channel) and 97.11 (the July 24 low). Upside potential is limited unless the index sustains above the 65-day simple moving average (98.59) and the 99.00 round-figure mark.
Consider shorting the US Dollar Index at 98.60 today, with a stop loss at 98.70 and a target of 98.10; 98.00.
WTI Spot Crude Oil
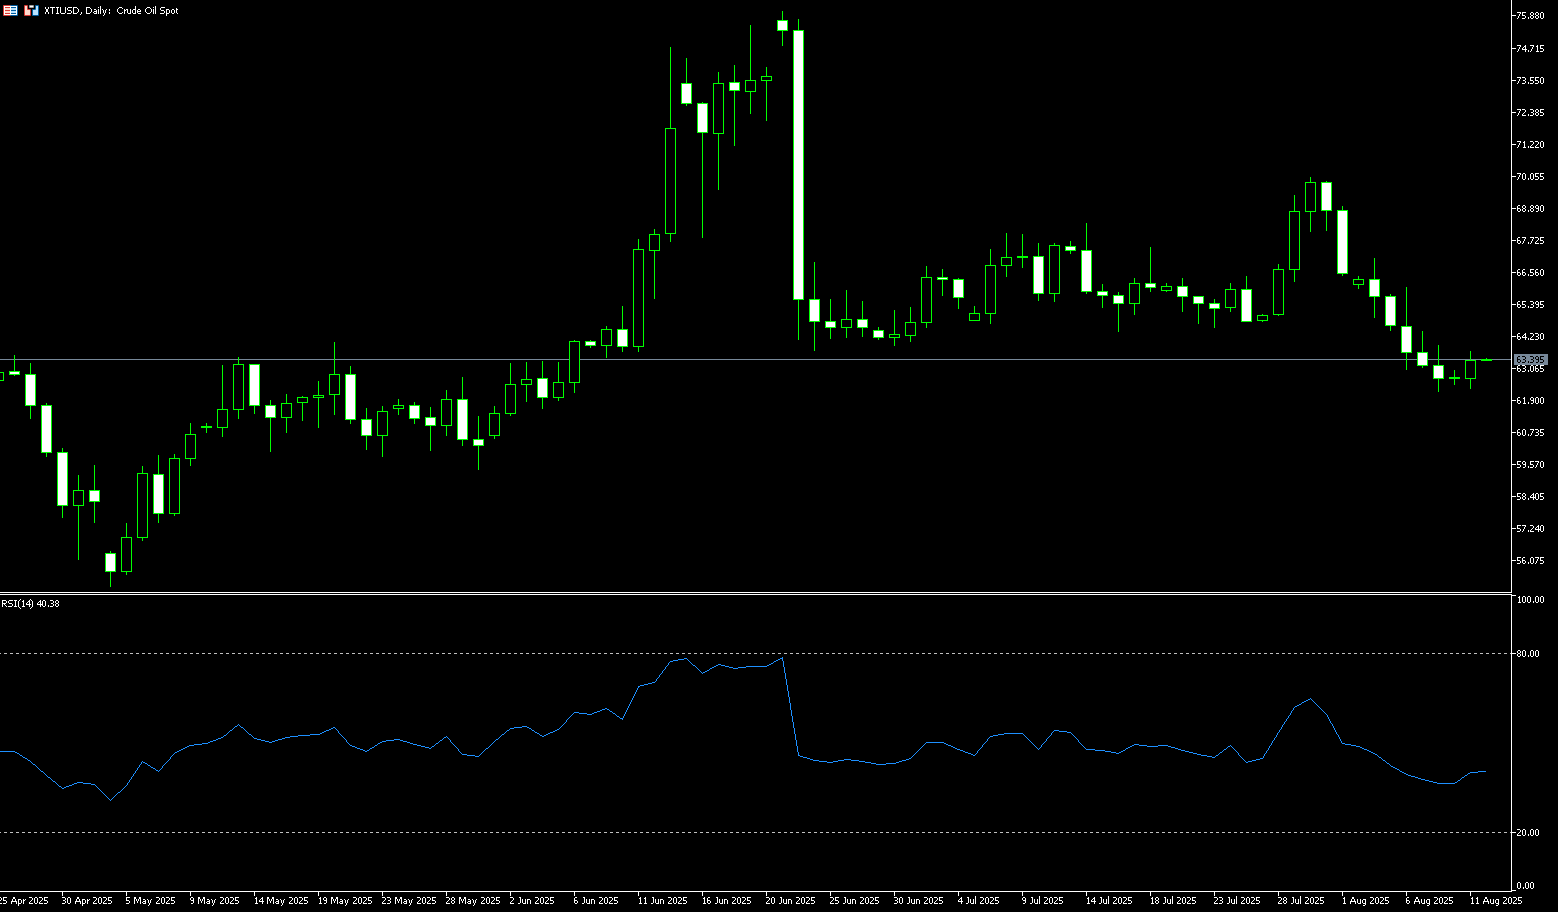
WTI crude oil is trading around $63.30 per barrel, but prices are on track for their biggest weekly drop since late June as the economic outlook is hit by tariffs. Russian President Vladimir Putin and US President Donald Trump will meet this Friday, and the market will be focused on the outcome of their meeting. The United States and Russia are seeking a deal to end the war in Ukraine and bring territories seized by Russia under its control. Reports indicate that officials from both sides are holding talks on territorial issues in preparation for a summit between Trump and Putin as early as this week. The potential meeting raises hopes for a diplomatic end to the Ukrainian war, potentially leading to an easing of sanctions on Russia. This comes amid escalating trade tensions between Trump and Russian oil buyers. The US dollar strengthened on Friday, but fell on a weekly basis. The stronger dollar is hurting foreign demand for dollar-denominated crude oil.
On a weekly basis, WTI crude oil's latest decline is currently stabilizing at the 61.8 Fibonacci retracement level of the May-June uptrend, coinciding with the neckline of the inverted head and shoulders pattern, around 62.60. A break of 62.60 could accelerate downside risk toward the middle of the channel, with key support levels at $62.00 and 62.19 (June 6 low). Next is support at $61.60 (June 4 low). A further test of $60.00 (a psychologically significant market level) is possible. If 62.60 holds and WTI rebounds to $63.16 (the 61.8% Fibonacci retracement of the 54.78 to 76.74 range), a break below that level could lead to $65.76 (the 50.0% Fibonacci retracement).
Consider going long on crude oil at 63.15 today. Stop-loss: 63.00, target: 64.60, 65.00.
Spot Gold
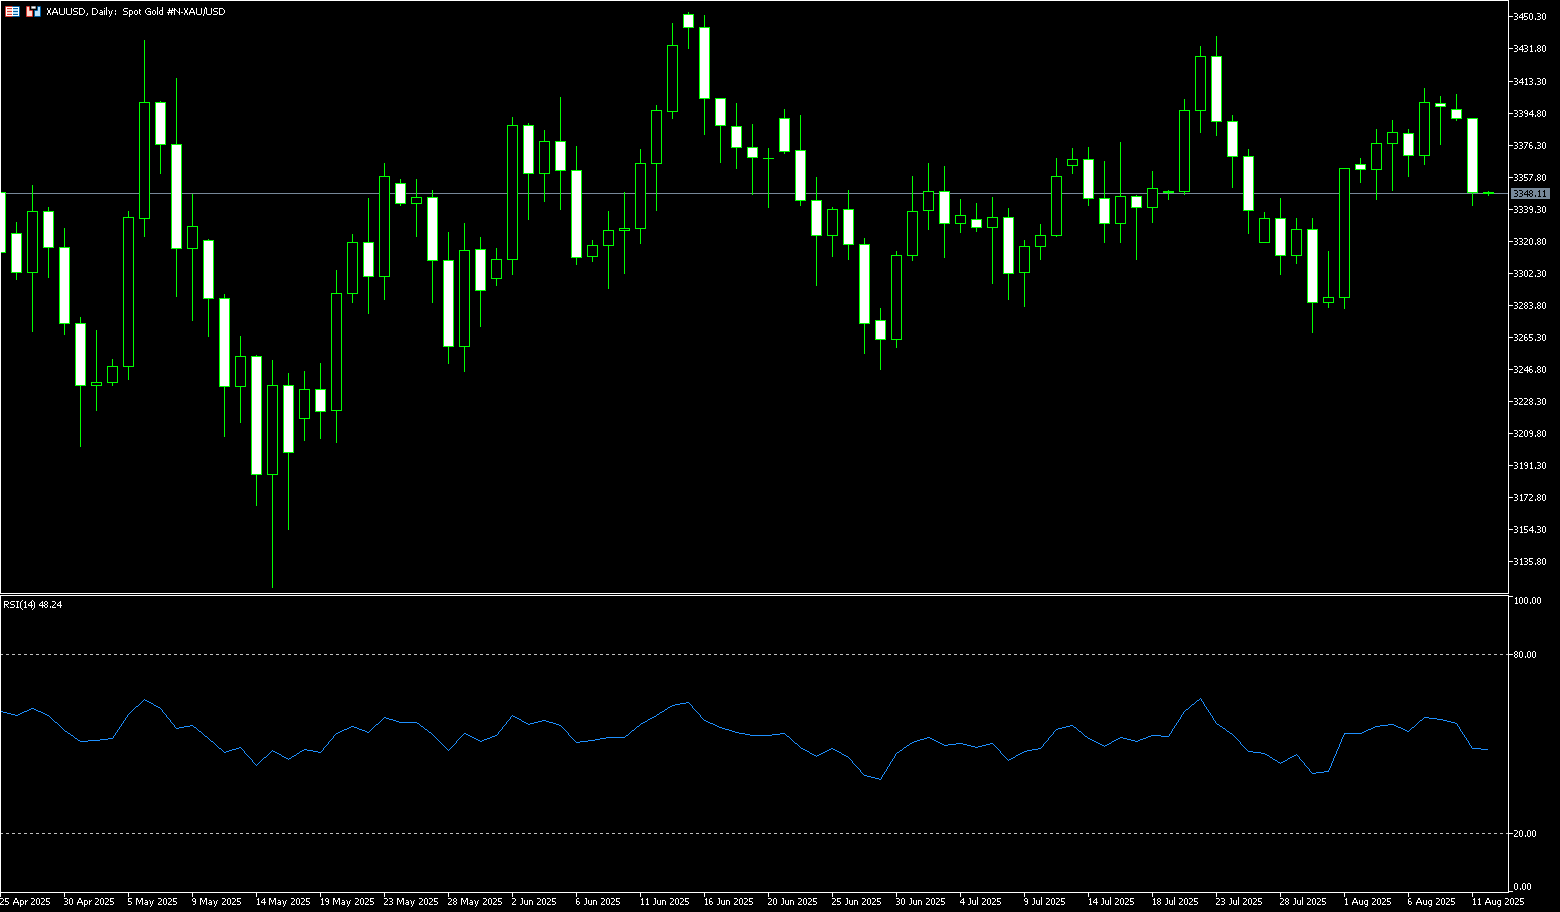
Gold prices fell to a low of $3,340 per ounce on Monday after President Trump announced that the metal would not face tariffs, easing concerns about a sharp increase in gold import costs. This followed a US Customs ruling that 1 kg and 100 ounce gold bars imported from Switzerland would be subject to a 39% tariff, which would also apply to gold bars from any other country at the current US tariff rate. Trump's reversal is part of his broad "reciprocal" tariff policy, which began imposing duties on dozens of US trading partners on August 7. Separately, the president signed an executive order extending the suspension of high US tariffs on Chinese goods for 90 days. This decision, anticipated following recent trade talks in Stockholm, came just hours before the suspension was due to expire at midnight. Investors now turn their attention to this week's key US economic data releases, including the Consumer Price Index (CPI), Producer Price Index (PPI), and retail sales, for clues on the Federal Reserve's interest rate trajectory.
Spot gold remains capped below the key resistance level of $3,400, with bears continuing to defend this psychological level. After hitting a low of $3,340 earlier this week, it rebounded slightly to around $3,350. Gold prices remain consistent with a broader ascending triangle pattern, although the pattern weakened slightly earlier this week after breaking below the rising trendline. However, the decline found strong buying support above the 50-day simple moving average at $3,350, helping bulls regain their footing and maintaining the overall bullish structure. The 14-day relative strength index (RSI) technical indicator is at 50, in neutral territory, indicating neutral to mildly bullish momentum. Meanwhile, the moving average convergence divergence (MACD) indicator remains positive, suggesting improving momentum. However, the Average Directional Index (ADX) remains low, suggesting a lack of strength in the current trend. A daily close above $3,400-3,410 is crucial for bulls, potentially opening the way for a move towards $3,450. On the downside, key support lies at $3,350, near the 50-day moving average, followed by the psychologically important $3,300 level.
Consider going long on gold at $3,345 today, with a stop-loss at $3,340 and targets at $3,370 or $3,375.
AUD/USD
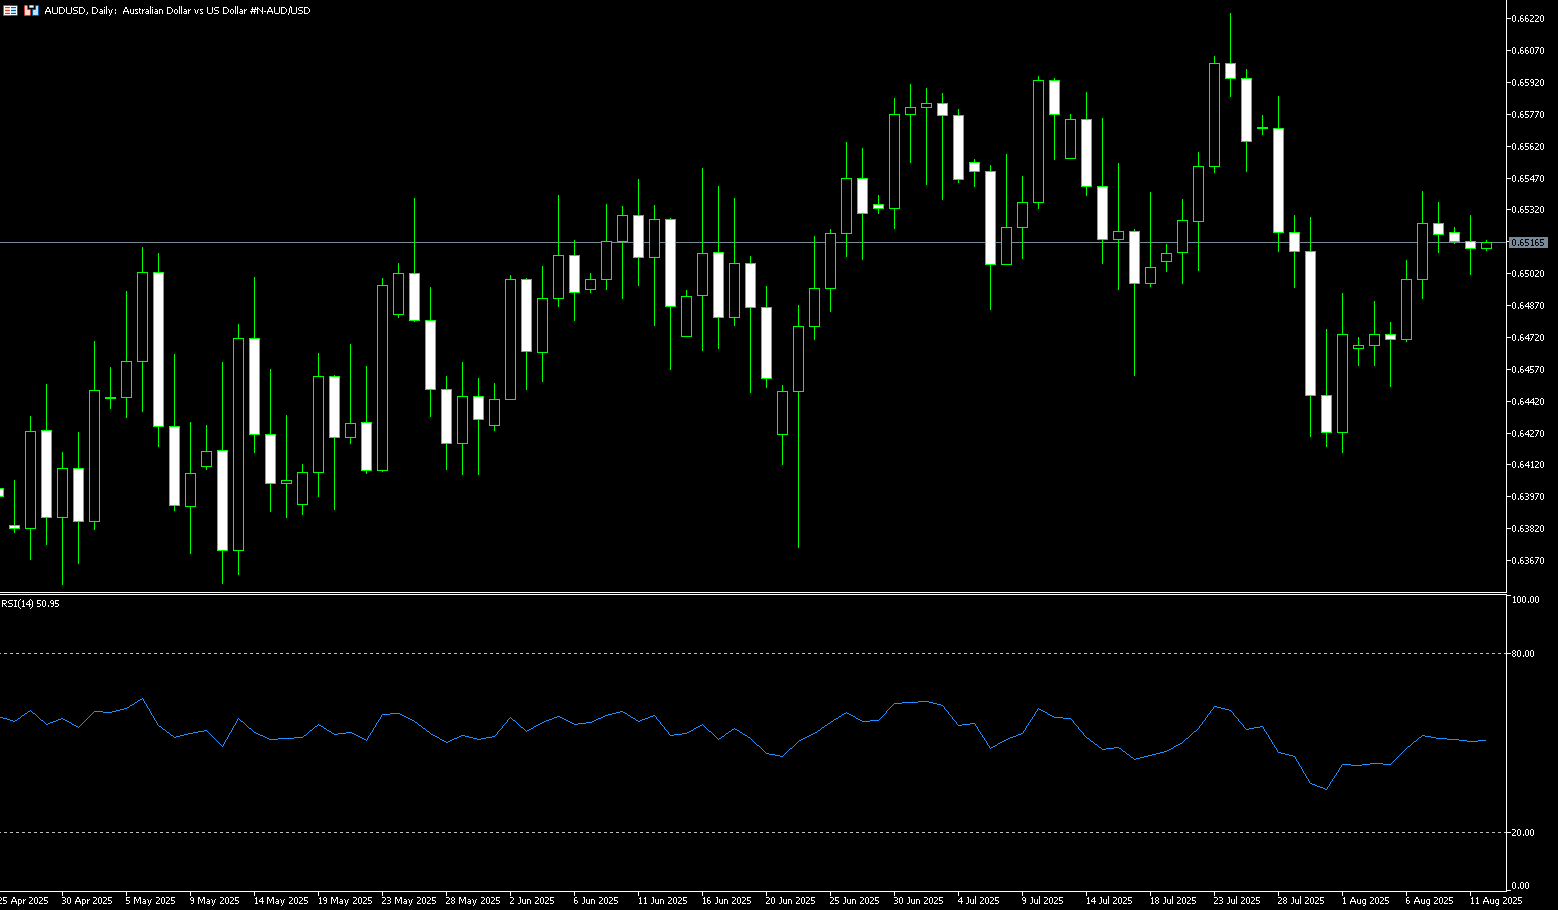
The Australian dollar stabilized around $0.6515 on Monday as investors cautiously awaited the Reserve Bank of Australia's monetary policy decision on Tuesday. Markets generally expect a 25 basis point interest rate cut to 3.60% at the August meeting, following lower-than-expected inflation in the second quarter and a rise in the unemployment rate to a three-and-a-half-year high. This follows the RBA's surprise decision in July to maintain the cash rate at 3.85%, citing a more balanced assessment of inflation risks and continued labor market resilience. However, uncertainty remains as Reserve Bank of Australia (RBA) Governor Michelle Bullock reiterated that the central bank will no longer provide forward guidance, emphasizing that interest rate decisions are entirely the responsibility of the board and cannot be predicted in advance. Externally, the Australian dollar drew some support from a weaker US dollar ahead of Tuesday's US inflation data and the upcoming August 12th deadline for the US-China tariff truce.
AUD/USD traded around 0.6515 on Monday. Technical analysis on the daily chart suggests bullish market sentiment. Furthermore, the 14-day relative strength index (RSI) is slightly above 50, reinforcing the bullish bias. The pair also remains above the nine-day simple moving average of 0.6481, indicating stronger short-term momentum. On the upside, the pair could target 0.6576, the 76.4% Fibonacci retracement level from 0.6625 to 0.6420. A successful break above this level could strengthen the bullish bias and support the pair's exploration of the psychological level of 0.6600, followed by the nine-month high of 0.6625 set on July 24. On the downside, the Australian dollar against the US dollar may find near-term support at the nine-day simple moving average at 0.6481. A break below this level would weaken short- and medium-term price momentum and exert downward pressure on the pair, potentially testing last week's low of 0.6449, followed by the 0.6400 level.
Consider a long AUD at 0.6500 today, with a stop-loss at 0.6490 and targets at 0.6560 and 0.6550.
GBP/USD
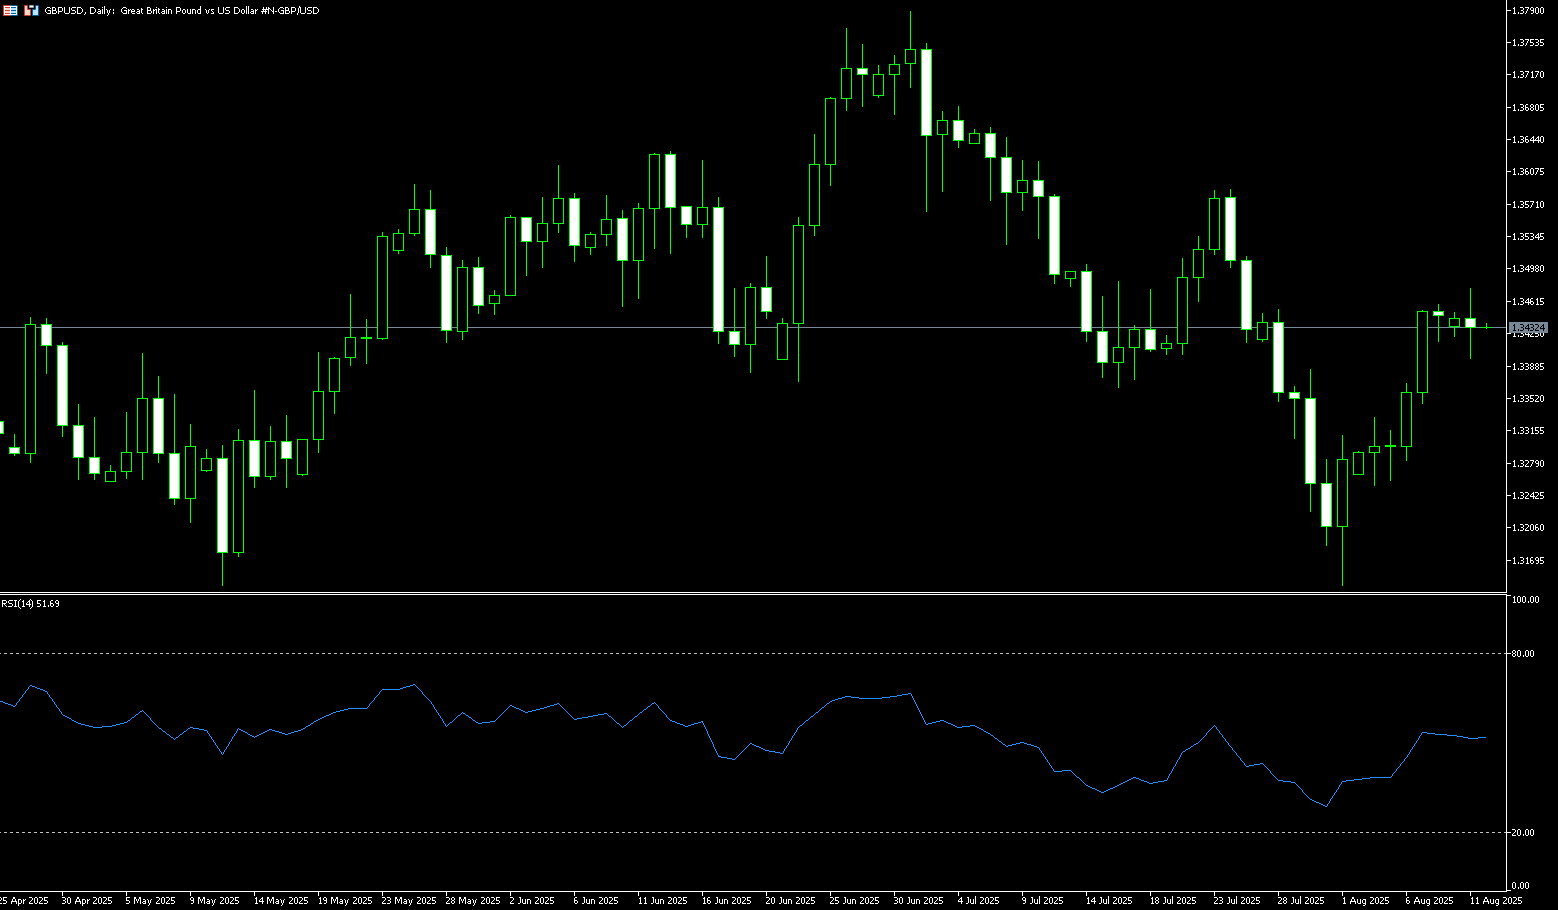
GBP/USD started the new week on a subdued note, consolidating its recent rebound from the 1.3130 area, the lowest level since April 14, reached earlier this month. Spot prices traded little changed around 1.3430, despite the fundamental backdrop seemingly favoring bullish traders. As widely expected, the Bank of England announced a 25 basis point interest rate cut last week, lowering its benchmark rate to 4%, the lowest level since 2023. However, the narrow 5-4 vote suggests greater resistance to a rate cut than the market expected, forcing traders to scale back bets on aggressive easing by the Bank of England. This is likely to continue supporting the British pound, while a weaker US dollar price action provides a tailwind for the GBP/USD pair. Furthermore, traders are pricing in the possibility of at least two rate cuts from the Federal Reserve before the end of the year. This should keep dollar bulls on the defensive and validate the GBP/USD pair's positive short-term outlook.
The daily chart shows that GBP/USD has a neutral to upside bias after five consecutive days of gains, reaching a two-week high of 1.3476. Currently, the 14-day relative strength index (RSI) on the daily chart has rebounded above 50.00 after fluctuating between 20.00 and 40.00 over the past few trading sessions, suggesting a bullish reversal attempt. The exchange rate appears capped below the 1.3500 (round number) and the 55-day simple moving average of 1.3502. If bulls break through, the next key resistance will be the July 23 high near 1.3585, and the psychologically important 1.3600 area. On the other hand, consolidation below 1.3400 could pave the way for a pullback towards the 20-day simple moving average at 1.3394 and the 1.3400 round-figure mark. A break below this level would target the 9-day simple moving average at 1.3332.
Consider a long position on the British pound at 1.3420 today, with a stop-loss at 1.3410 and targets at 1.3470 and 1.3480.
USD/JPY
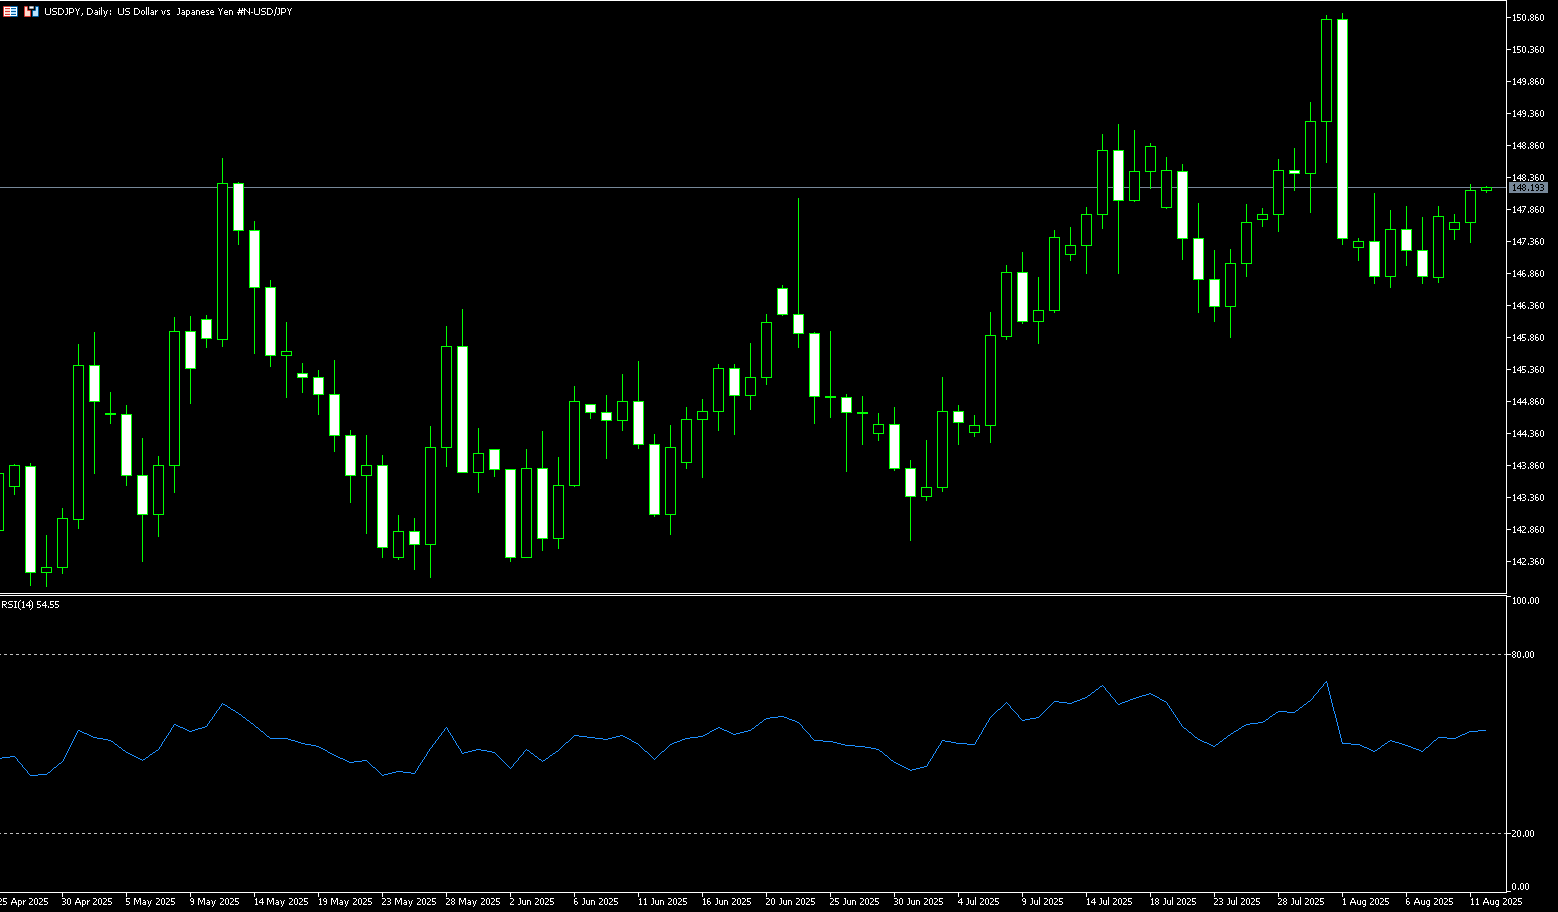
The yen traded around 148.10 per dollar on Monday, remaining within a narrow range as investors continued to assess the Bank of Japan's monetary policy outlook. Minutes from the Bank of Japan's July meeting showed that board members maintained their view that further rate hikes remained appropriate despite heightened uncertainty surrounding tariffs. The summary also indicated that economic growth in Japan is expected to slow, and any improvement in underlying inflation is likely to be temporary. However, some members preferred to maintain their current accommodative stance for now, citing significant uncertainty about whether the bank's economic forecasts will materialize. Looking ahead, investors await further guidance from key Japanese economic indicators, including second-quarter GDP, the Reuters Tankan survey, producer prices, and machine tool orders.
From a technical perspective, USD/JPY remains confined within the familiar range it has maintained over the past week or so, forming a rectangular pattern. Therefore, before placing any further upside bets, it would be prudent to await a sustained breakout and confirmation above the 147.75-147.80 resistance level, representing the 38.2% Fibonacci retracement of the July rally. Follow-through buying above the 148.00 level would be a key trigger for bulls and could propel USD/JPY towards the 148.45-148.50 area. Momentum could extend further towards the 23.6% Fibonacci retracement level, ahead of the 149.00 level. On the other hand, the 147.00 round number appears to be protecting near-term downside potential ahead of the 146.80-146.75 confluence zone—a region encompassing the 200-hour simple moving average and the 50% Fibonacci retracement level on the 4-hour chart. A break below this level would pave the way for deeper losses and drag USD/JPY below 146.00, or the 61.8% Fibonacci retracement level. Spot prices could decline further, ultimately reaching the psychological 145.00 level.
Consider shorting the USD at 148.35 today. Stop-loss: 148.55. Target: 147.40, 147.30.
EUR/USD
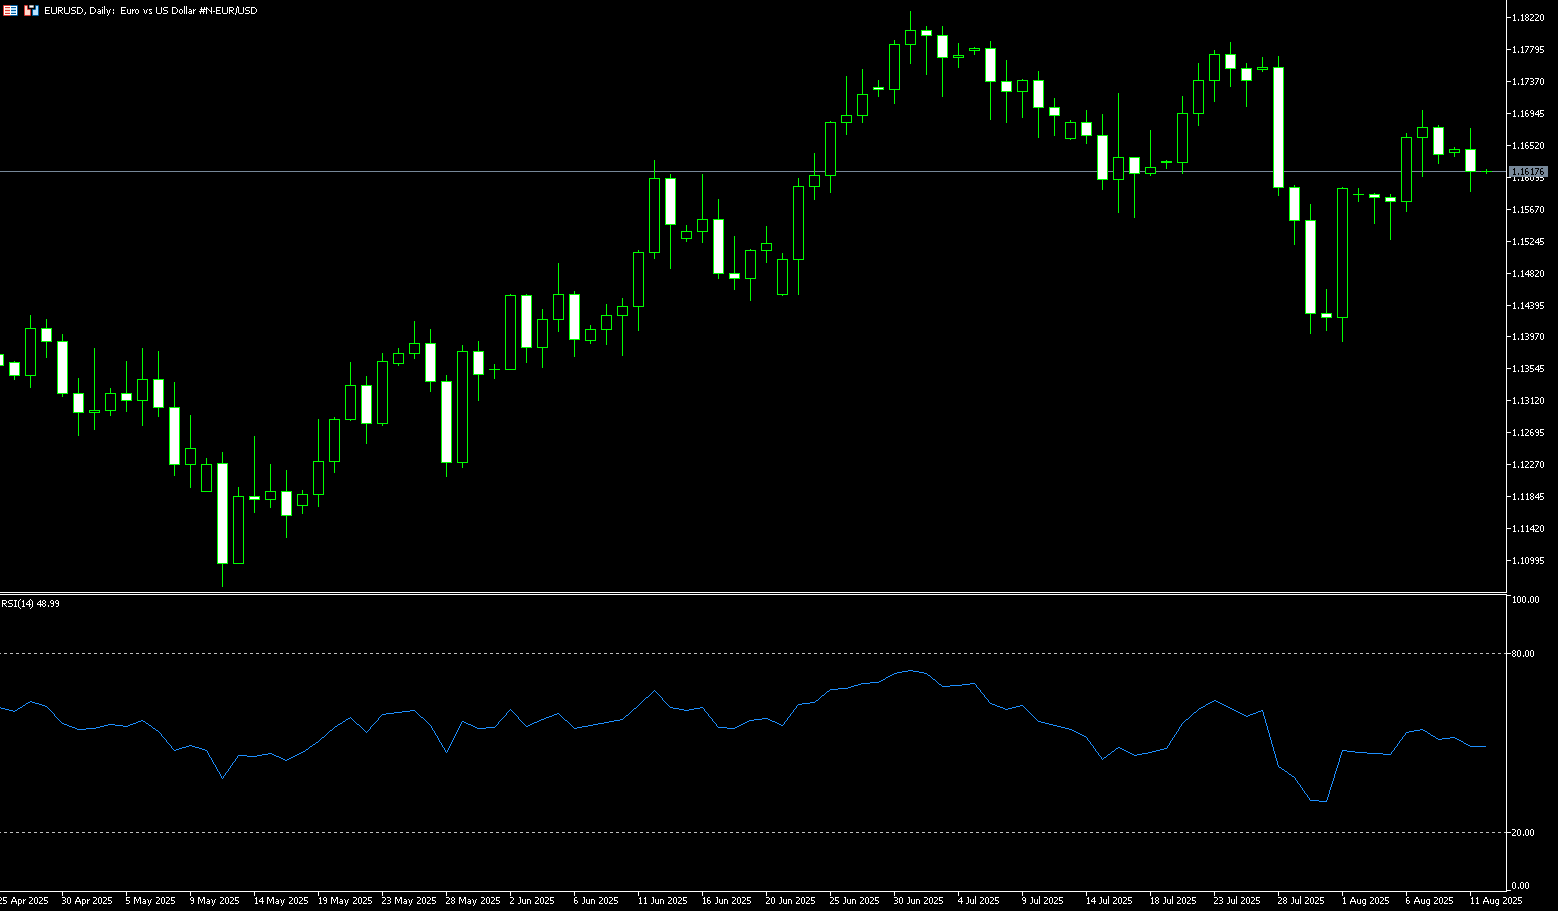
EUR/USD approached 1.1620 during Monday's session. The euro strengthened against the dollar on the possibility of a meeting between US President Trump and Russian President Vladimir Putin on Friday to end sanctions. Traders awaited US Consumer Price Index (CPI) data due later on Tuesday. Trump and Putin have agreed to meet in Alaska on Friday to discuss a path forward towards ending the war in Ukraine. Concerns intensified as Trump set an August 8th deadline for Putin to agree to an immediate ceasefire or face tougher US sanctions. With the deadline approaching, Trump announced that he and Putin would meet in person on Friday. Optimism surrounding a potential US-Russia meeting could provide some short-term support for the euro. Across the pond, dovish Federal Reserve expectations could weigh on the US dollar, providing a tailwind for major currency pairs.
On the daily chart, EUR/USD's rebound last week, after breaking above the 20-day simple moving average at 1.1624, lost momentum near 1.1698 (the August 7 high) and 1.1700 (the round-figure mark). While the 14-day relative strength index (RSI) remains in bullish territory (currently at 54.24), it has turned slightly downward, suggesting that buyers may be losing momentum. However, holding above the neutral line suggests potential consolidation ahead. A break above 1.1698-1.1700 would open the way to resistance at 1.1770 (July 28 high), potentially leading to a climb towards 1.1800, followed by a test of the year-to-date high at 1.1831. Otherwise, a pullback below the 1.1600 round-figure mark would expose the 9-day simple moving average at 1.1571 and the 1.1600 round-figure mark. Further weakness could target 1.1528 (August 5 low) and the 1.1500 level.
Consider a long EUR at 1.1605 today, with a stop-loss at 1.1590 and targets at 1.1650 and 1.1660.
Disclaimer: The information contained herein (1) is proprietary to BCR and/or its content providers; (2) may not be copied or distributed; (3) is not warranted to be accurate, complete or timely; and, (4) does not constitute advice or a recommendation by BCR or its content providers in respect of the investment in financial instruments. Neither BCR or its content providers are responsible for any damages or losses arising from any use of this information. Past performance is no guarantee of future results.
Lebih Liputan


Pendedahan Risiko:Instrumen derivatif diniagakan di luar bursa dengan margin, yang bermakna ia membawa tahap risiko yang tinggi dan terdapat kemungkinan anda boleh kehilangan seluruh pelaburan anda. Produk-produk ini tidak sesuai untuk semua pelabur. Pastikan anda memahami sepenuhnya risiko dan pertimbangkan dengan teliti keadaan kewangan dan pengalaman dagangan anda sebelum berdagang. Cari nasihat kewangan bebas jika perlu sebelum membuka akaun dengan BCR.

 English
 简体中文
简体中文
 繁體中文
繁體中文
 Bahasa
Melayu
Bahasa
Melayu
 Tiếng
Việt
Tiếng
Việt
 ไทย
ไทย
 日本語
日本語
 한국어
한국어
 ភាសាខ្មែរ
 español