0
US Dollar Index
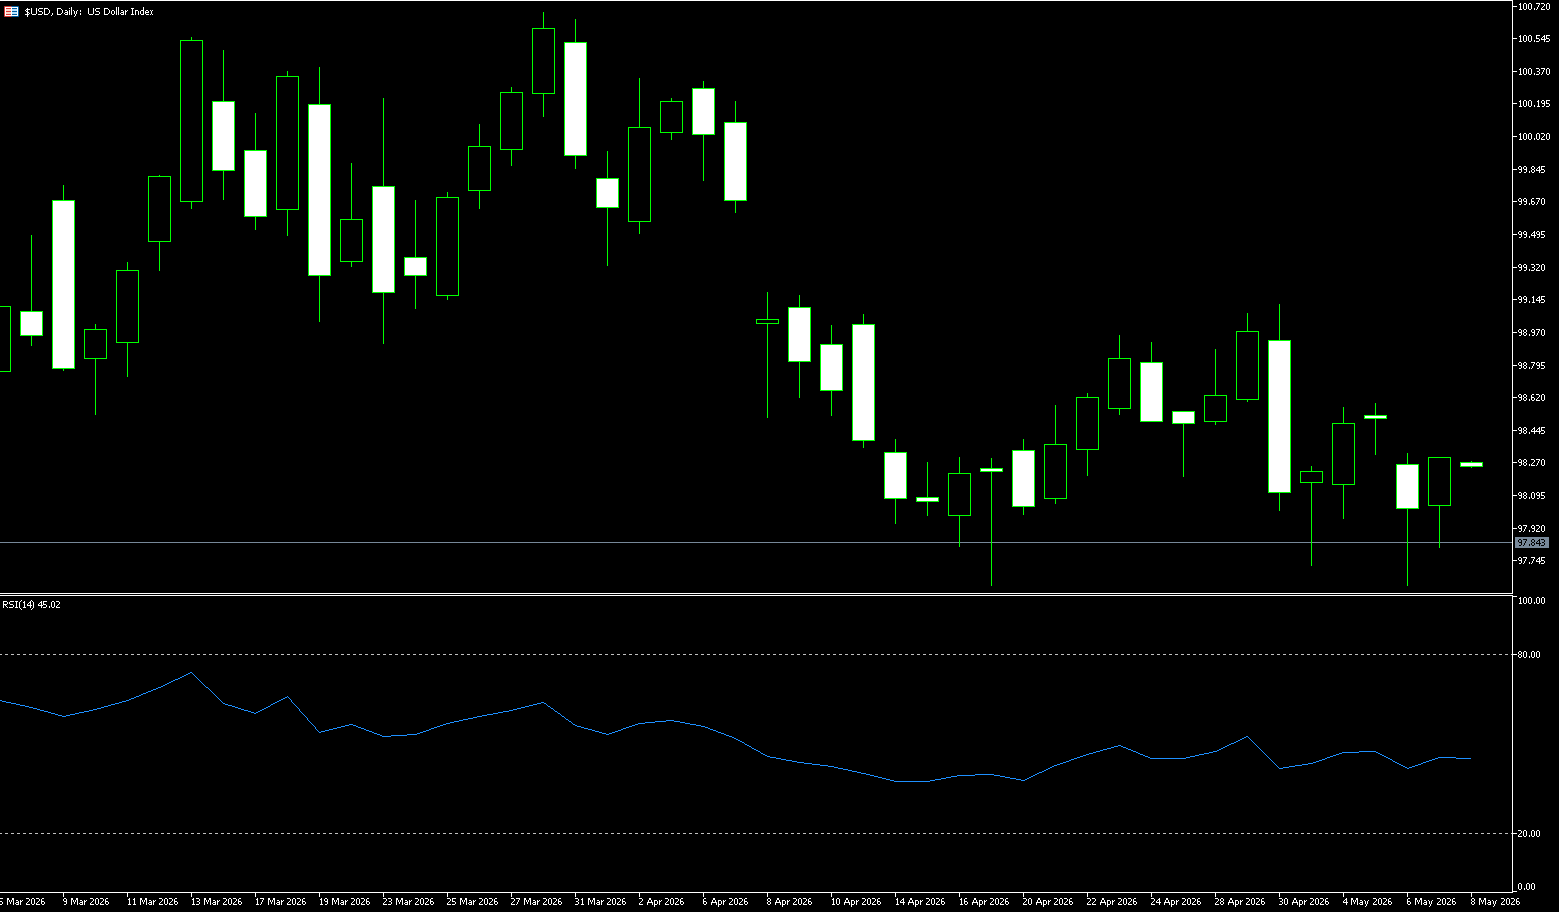
The US dollar index climbed above 99 ahead of the weekend, reaching a near five-week high and poised for a weekly gain of over 1.4%, supported by escalating inflationary pressures that have strengthened market expectations for a Federal Reserve rate hike later this year. Data released earlier this week showed that US wholesale inflation accelerated at its fastest pace since 2022 in April, while consumer prices recorded their largest increase since 2023, driven by renewed price pressures from the energy shock related to the conflict with Iran. Retail sales growth slowed as expected but continued to point to strong consumer demand. The market has now completely ruled out a Fed rate cut this year, with some traders increasingly expecting a rate hike by December. Meanwhile, investors remain focused on the second day of high-level talks between President Trump and Chinese President Xi Jinping, after Xi warned that Taiwan could become a source of “conflict” between the world’s two largest economies.
The current strength of the US dollar index is not only due to the boost from the US visit to China, but also because it stabilized above 99.00 after the data release and subsequently strengthened significantly. On the one hand, better-than-expected core retail sales confirmed the resilience of domestic demand, alleviating concerns about an economic recession and weakening the necessity for the Federal Reserve to cut interest rates in the short term, providing fundamental support for the dollar. On the other hand, escalating global geopolitical uncertainties coupled with high energy prices have driven safe-haven demand, pushing funds back into dollar assets and reinforcing their safe-haven attributes. However, the weakness in the job market is limiting the dollar's gains: if initial jobless claims continue to rise and non-farm payroll growth slows further, it could trigger a repricing of the economic outlook, thus suppressing the dollar's upside potential.
Last week, the US dollar index experienced a bottoming-out and rebound, trending upwards in a volatile manner. It found strong support around 97.60 at the beginning of the week, and subsequently rebounded, driven by higher-than-expected US CPI inflation, rising expectations of a Fed rate hike, and safe-haven buying in the Middle East. On Thursday, it stabilized above 98.50, and on Friday in Asian trading, it surged to 99.32 (the highest point since mid-April). The overall trend shifted from weak consolidation to short-term bullish dominance, with significantly increased volatility. The battle between bulls and bears shifted from the 98 level to the 99 level. This week closed with consecutive small positive candles followed by a medium-sized positive candle, with gradually rising lows forming a stepped rebound structure. The short-term downtrend channel has been broken, indicating a temporary end to the downtrend. The price has risen above the 5/20/100/200-day simple moving averages, which, after converging, are beginning to diverge upwards, forming a bullish structure. The Bollinger Bands have shifted from converging to opening upwards. The US dollar index has stabilized above the midline at 98.43 and the 200-day simple moving average at 98.54, breaking through the upper resistance level and opening up upward potential.
Technical indicators: MACD: A golden cross below the zero line, with the red bars continuing to expand, indicating a shift from weak to strong bullish momentum; while RSI (14): rose from the weak zone of 41.90 to 59.30, breaking through the 50 level, the dividing line between bullish and bearish trends, and has not entered overbought territory, indicating ample upward potential. Currently, the support level of 97.62 (the low of May 6th) has been tested effectively multiple times, forming a double bottom pattern and completely releasing selling pressure. The short-term trend has shifted from a slightly weak to a slightly strong oscillation to bullish dominance, with moving averages and indicators all turning in a positive direction. The 99 level is the decisive point between bulls and bears; a hold above this level would continue the rebound, while a break below would lead to a return to the 98-100 range. Furthermore, higher-than-expected inflation is pushing up expectations of interest rate hikes, which, combined with the technical rebound, strengthens the bullish momentum. If the US dollar index can rebound and hold above 99.00 (the psychological level), it may further test the 99.31 area (the 65-week simple moving average); a break above this level would further strengthen the support towards 99.93 (the 70-week simple moving average) and the psychological level of 100. However, if the US dollar index falls instead of rising, it may retreat back to 98.54 (the 200-day simple moving average) or even the 98.00 psychological level.
Today, consider shorting the US Dollar Index at 99.40, with a stop-loss at 99.50 and targets at 98.90 and 98.80.
WTI Crude Oil
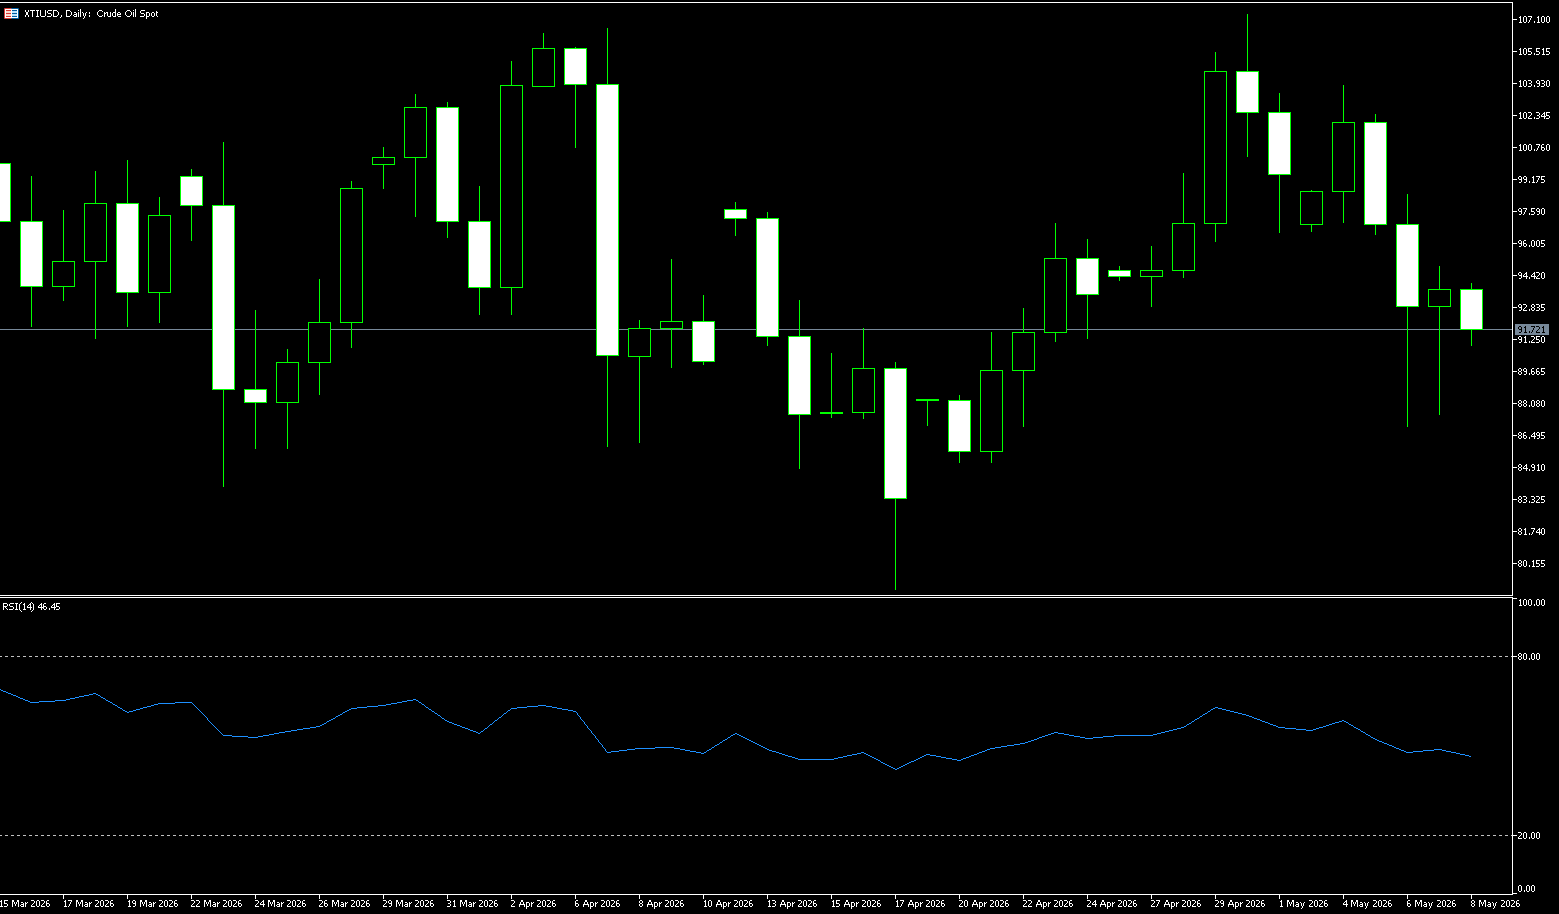
Before the end of last week, WTI crude oil rose more than 3.0%, approaching $101.30 per barrel, and recorded a 10% weekly gain, as the Strait of Hormuz remained effectively closed, and global supply concerns continued to escalate. Efforts to end the conflict remain stalled, and disruptions continue to impact energy markets and exacerbate inflation concerns. President Trump sent mixed signals on the situation, first stating that the US did not need the Strait of Hormuz to be open, and then joining Chinese President Xi Jinping in stating that "we hope the Strait will be open." The International Energy Agency warned this week that even if the fighting ends next month, the oil market may remain severely undersupplied until October. Oil inventories continue to tighten, while tanker traffic in the Strait of Hormuz remains extremely limited; only a handful of ships have successfully left the Persian Gulf since the conflict began.
International oil prices fluctuated last week. Brent crude oil climbed to a high of $106.60 per barrel before retreating. US spot crude oil (WTI) traded around $101 per barrel during the same period. Meanwhile, WTI touched a low of $95.50 during the day, ultimately closing near $101, exhibiting a typical "V-shaped" oscillation throughout the day. Two key events drove the oil price fluctuations. First, Iranian state media reported that approximately 30 ships had transited the Strait of Hormuz in recent hours; Iran has begun allowing some Chinese ships to pass through. Second, high-level diplomatic relations between China and the US provided political support for the opening of the Strait. The White House stated that US President Trump and Chinese President Xi Jinping agreed during their talks that the Strait of Hormuz must remain open to ensure the free flow of energy.
Last week, WTI crude oil generally exhibited a pattern of high-level volatility, intensified battle between bulls and bears, and pullbacks after initial surges. Prices repeatedly battled around the $100 mark throughout the week. While the medium-to-long-term bullish trend remained intact, short-term upward momentum clearly weakened, and technically, the market entered a high-level consolidation phase after the recent rise. Overall, the pullback in spot crude oil prices is a result of short-term factors such as buyer hesitancy, inventory depletion, and replenishment of alternative sources, rather than a substantial improvement in the supply and demand situation. Without a breakthrough in geopolitical developments, spot oil prices could resume their upward trend at any time. The weekly chart continues its long-term bullish trend, with oil prices holding above the MA20, MA50, and MA100 moving averages, maintaining a healthy overall upward trend without any signs of reversal. The previous continuous short squeeze has ended, and prices are now consolidating at higher levels.
The RSI (14) has rebounded to the 65 level, a neutral-to-strong range, moving out of oversold territory, indicating increased bullish momentum but not a reversal. The MACD is above the zero line, with the red bars shortening, indicating slower upward momentum and no signs of increased bearish volume. Furthermore, the Bollinger Bands are flattening at the upper rail and rising at the middle rail, with prices consolidating between the upper and middle rails at high levels. Currently, oil prices are consolidating within a high-level range, between $95.00 and $107.00. Short-term moving averages are converging, indicating increasing divergence between bulls and bears, limiting downside potential and suggesting a period of consolidation. Meanwhile, the medium- to long-term trend remains bullish, supported by geopolitical conflicts, OPEC+ production cuts, and the peak summer oil consumption season. However, in the short term, profit-taking at higher levels has weakened upward momentum, leading to consolidation and the end of the one-sided upward trend. The price action is likely to revolve around $100, with increased volatility and a fierce battle between bulls and bears. A sustained move above $96.40 (20-day moving average) and a break above the psychological resistance level of $100.00 would target $107.35 (April 30 high) and the $110.00 level, awaiting catalysts from news events. A decisive break below $96.26 (20-day moving average) would trigger a technical pullback, retracing to support at $93.34 (last week's low) – the psychological level of $90.
Today, consider going long on crude oil at $100.88, with a stop-loss at $100.70 and targets of $103.00 and $104.00.
Spot Gold
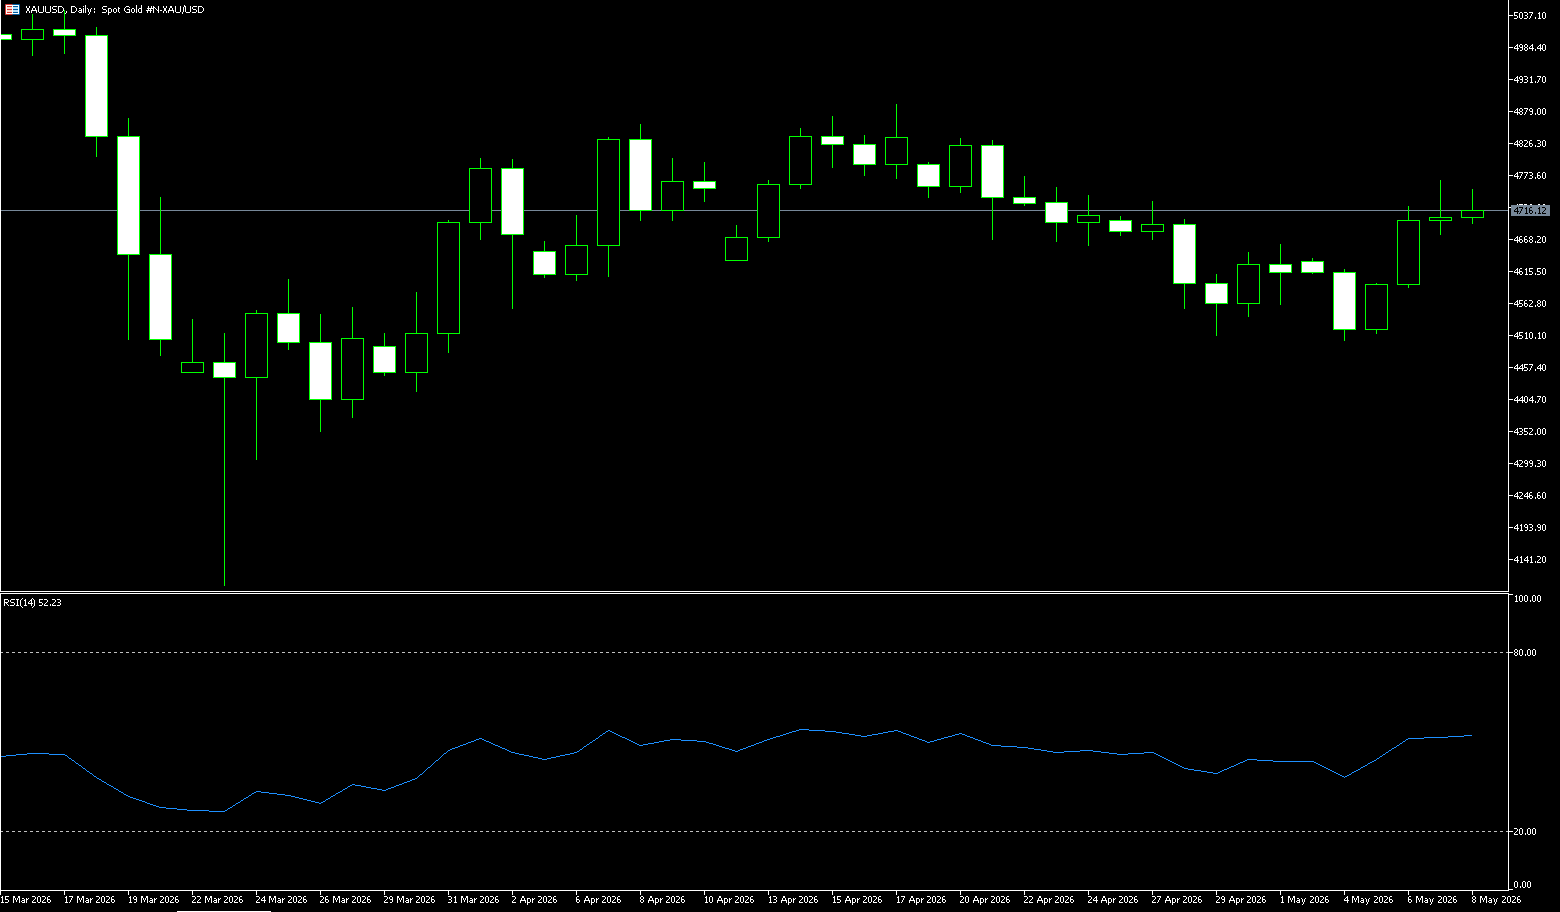
Gold fell to $4,511 per ounce on Friday, down approximately 3.77% for the week, pressured by accelerating US inflation, raising concerns that the Federal Reserve may need to maintain high interest rates or even raise them. Data released earlier this week showed that U.S. wholesale inflation surged at its fastest pace since 2022 in April, while consumer prices saw their largest increase since 2023. Inflationary pressures were primarily driven by the ongoing conflict in the Middle East and the near-closure of the Strait of Hormuz, which has severely disrupted global energy transport. The market has now completely ruled out a Fed rate cut this year, with some traders increasingly considering a December rate hike. Meanwhile, President Trump met with Chinese President Xi Jinping to discuss efforts to keep the Strait of Hormuz open to maintain energy trade. On the other hand, India further tightened its gold import regulations as authorities increased measures to support the rupee.
A significant shift in expectations regarding Fed monetary policy has further exacerbated downward pressure on gold. Driven by the surge in energy prices due to the Middle East conflict, both the U.S. Producer Price Index (PPI) and Consumer Price Index (CPI) rose sharply in April, and market expectations for a Fed rate cut have largely subsided. While gold is traditionally seen as an inflation hedge, rising interest rates often diminish its appeal as the opportunity cost of holding gold increases significantly. Investors should closely monitor the specific outcomes of the meeting between the Chinese and U.S. leaders and the actual navigation status of the Strait of Hormuz. If tensions in the Middle East ease, gold may face further downside risk. In the short term, watch for support around 4640; a break below this level could lead to a further test of the 4600 psychological level. Conversely, if the energy crisis deepens or diplomatic progress falls short of expectations, gold's safe-haven appeal will regain market favor.
Last week, gold traded in a high-level consolidation phase in the first half, with intensified battles between bulls and bears. Driven by fluctuations in the US dollar index, US Treasury yields, geopolitical risk aversion, and expectations regarding Federal Reserve policy, prices fluctuated repeatedly within a high range, showing significant resistance above and solid support below. The short-term bias is towards a slightly bullish consolidation at high levels, awaiting a key directional breakout. The weekly chart maintains a bullish trend structure, with moving averages in a bullish alignment. Gold prices have stabilized above the 5- and 10-week moving averages, indicating that the medium-term uptrend remains intact. However, after last week's surge, upward momentum weakened, and the candlestick showed an upper shadow, indicating high-level consolidation and profit-taking pressure from bulls. The weekly chart is likely to close with a small, range-bound candlestick, building momentum for a directional move next week. The RSI (14) indicator, a technical indicator, has retreated from the overbought zone without showing a significant top divergence, indicating a weakening of bullish momentum but no dominance from the bears. The MACD histogram is shrinking, and the fast and slow lines are flat at high levels, suggesting a short-term consolidation phase without a clear reversal signal.
From a technical perspective, gold prices are currently between the 20-week (4779) and 34-week (4511) simple moving averages. Momentum indicators suggest the market is generally neutral, with gold prices exhibiting a range-bound trading pattern. After last week's downward movement, a directional move is likely next week. Short-term resistance lies near the 25-week simple moving average at $4,687, forming a resistance zone around the $4,700 level, which may limit any rebound attempts. Further gains may encounter selling pressure around the $4,779 (20-week simple moving average) and $4,800 (psychological level). Bears expect gold prices to break below $4,540 (last week's closing price) and the first resistance zone of $4,511 (last week's low and the 34-week moving average); further downside targets are $4,500.00 (psychological level) and $4,361 (40-week moving average).
Consider going long on gold today at $4,535, with a stop loss at $4,530 and targets at $4,580 and $4,600.
AUD/USD
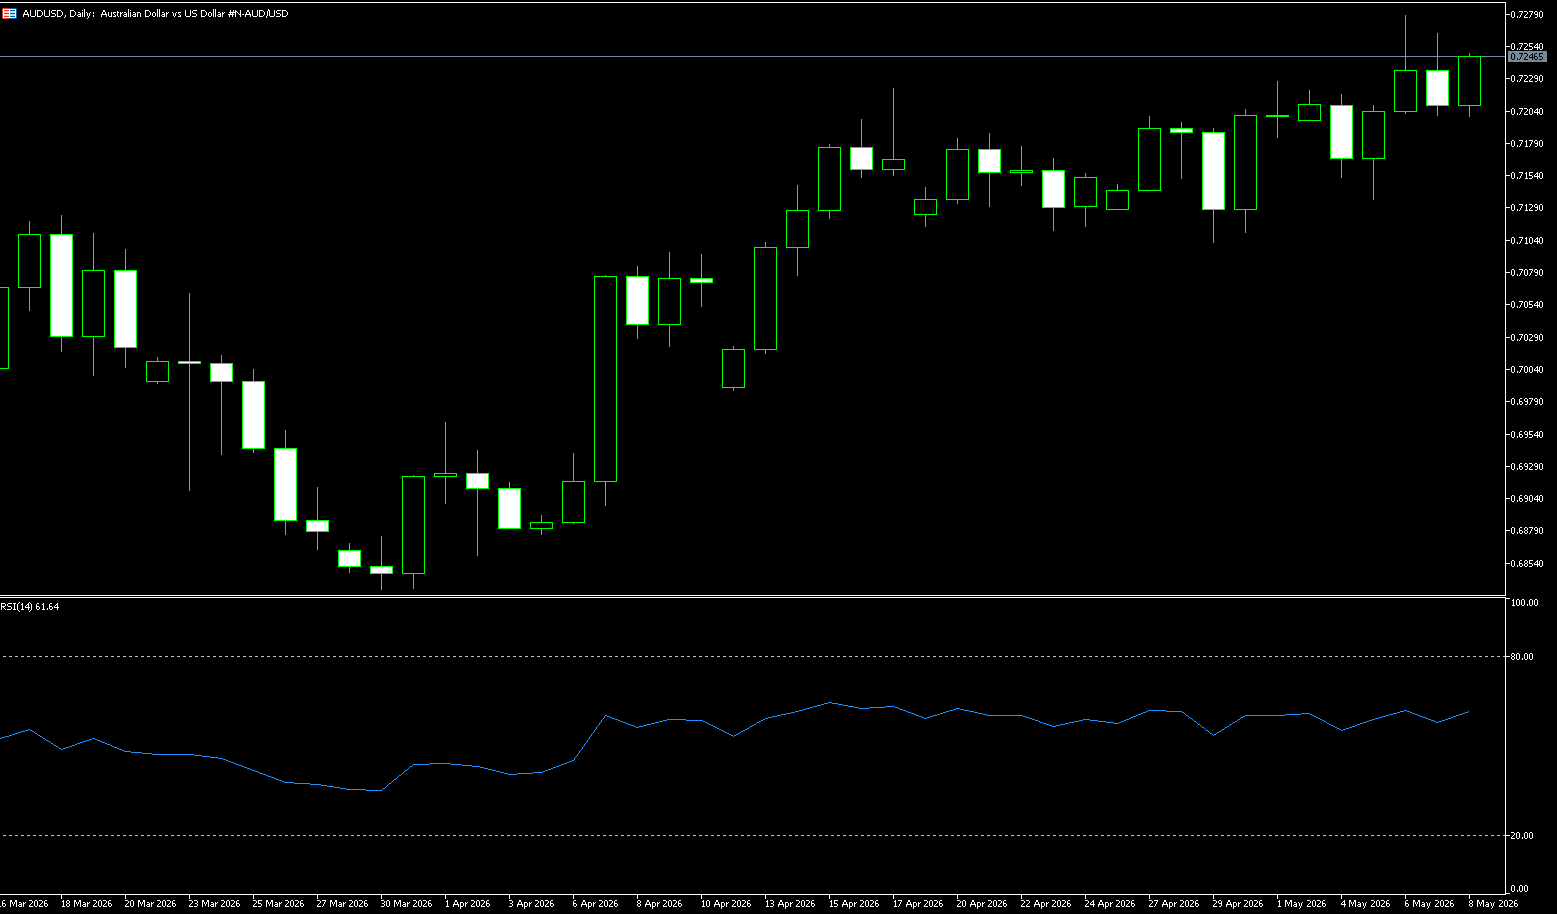
The Australian dollar fell below US$0.72, retreating from its recent four-year high, and is expected to post a weekly loss of about 1.32%, pressured by a generally stronger US dollar. The dollar gained momentum last week as rising energy prices and ongoing disruptions in the Strait of Hormuz fueled inflation concerns, reinforcing market bets on another Federal Reserve rate hike this year. In Australia, the Reserve Bank of Australia has already raised interest rates three times this year due to the global energy shock caused by the war, and the swap market indicates an approximately 80% probability of a fourth rate hike by August. Next week's RBA meeting minutes will provide further guidance on the policy path, while the Westpac consumer confidence index is expected to show whether the negative readings in April have stabilized. Markets are also focused on the second day of high-stakes talks between President Trump and Chinese President Xi Jinping, with Washington seeking economic concessions from Beijing amid the Iran conflict.
Trump stated that Chinese leader Xi had offered to help mediate an end to the war with Iran and keep the Strait of Hormuz open to global shipping. However, the US president said he wants US-China relations to be "stronger and better than ever." The focus was on the Taiwan issue, with Xi Jinping warning the US president that mishandling China's claims to Taiwan could lead to "conflict or even war," as the disputed island has been a key topic in the talks. Any signs of tension between the US and China could weaken the Australian dollar, which acts as a proxy for China, as China is a significant trading partner for Australia. On the other hand, recent accelerating US inflation data strengthened market expectations that the Federal Reserve will maintain high interest rates for an extended period, supporting the US dollar. The market currently estimates a probability of at least a 25 basis point rate hike by the Fed at its December meeting at nearly 32.9%, up from 22.5% a week ago.
The current Australian dollar/US dollar exchange rate is being influenced by the interplay between a strong US dollar and expectations of improved global risk sentiment. Better-than-expected US PPI data reinforced market expectations that the Fed will maintain high interest rates for an extended period, thus pushing the US dollar higher. Last week, the AUD/USD pair generally exhibited a weak and volatile downward trend, with limited upward rebound strength, significant resistance above, and repeated testing of key support below. In the short term, the bears are in control, and close attention should be paid to the interplay between the US dollar index, commodities, and risk sentiment. The daily chart shows the overall trend is in a medium-term downward channel. The exchange rate is under pressure below the moving average system, with the 5/10-day moving average forming a short-term resistance zone. After a slight rebound at the beginning of the week, it encountered resistance and fell back, with the center of gravity gradually shifting downward. The downtrend has not been reversed. Technical indicators: MACD: The daily MACD remains below the zero axis, with bearish momentum dominating and no obvious golden cross reversal signal yet. The short-term MACD golden cross is only a minor rebound correction with weak sustainability. RSI (14): Overall, it is in a weak range below 50. A rebound to around 50 was met with resistance and fell back, indicating insufficient bullish momentum; there is still room for further decline. Meanwhile, the exchange rate is running between the lower and middle Bollinger Bands, with the middle band continuing to exert downward pressure. The Bollinger Bands opening is weak, showing a clear downward trend.
From the 4-hour chart, the Australian dollar against the US dollar has recently entered a consolidation phase. Short-term moving averages are gradually flattening, indicating that the short-term market direction is unclear. The MACD indicator shows signs of a high-level death cross, indicating that the exchange rate faces further technical correction risk. However, the RSI indicator remains around 28, indicating that bearish forces have not yet fully taken control. A technical rebound is possible later. If the exchange rate regains its footing above 0.7200, it may retest the resistance zone of 0.7270 (the highest point since June 2022), or even the 0.7300 level. If it breaks below 0.7152 (the 180-day moving average), it may further retreat to the vicinity of 0.7100 (the psychological level) and further challenge the 0.7040 (the 89-day moving average) level.
Consider going long on the Australian dollar today at 0.7138, with a stop loss at 0.7126 and targets of 0.7200 and 0.7210.
GBP/USD
The pound has broken below the dollar at 1.3250, reaching its lowest level since early April, and is expected to fall more than 2% against the dollar this week. Political turmoil in the UK continues to escalate. Former Health Secretary Wes Streitting's resignation on Thursday appears to have emboldened other potential challengers. Among the most threatening is the influential left-wing Greater Manchester Mayor Andy Burnham—widely seen as the biggest threat to Prime Minister Starmer's leadership. The resignation of a Greater Manchester Labour MP paved the way for Burnham's return to Parliament, where he could potentially challenge for the premiership if successful. Markets are concerned that Burnham may push for more spending and tax increases against the backdrop of a deteriorating UK fiscal outlook and continued pressure on long-term government bonds. The pound's reversal is notable because political turmoil is causing markets to overlook the actually strong performance of the UK economy.
As domestic political turmoil intensifies, the pound is finally beginning to react negatively. The previously "strange divergence" between deteriorating UK political fundamentals and the pound's price resilience is rapidly correcting, while the dollar is simultaneously breaking out, creating a double pressure. Overall, UK political turmoil and fiscal concerns are outweighing better-than-expected economic data, while the continued US economic exceptionalism and the technical breakout of the dollar index provide dual impetus for further declines in the exchange rate.
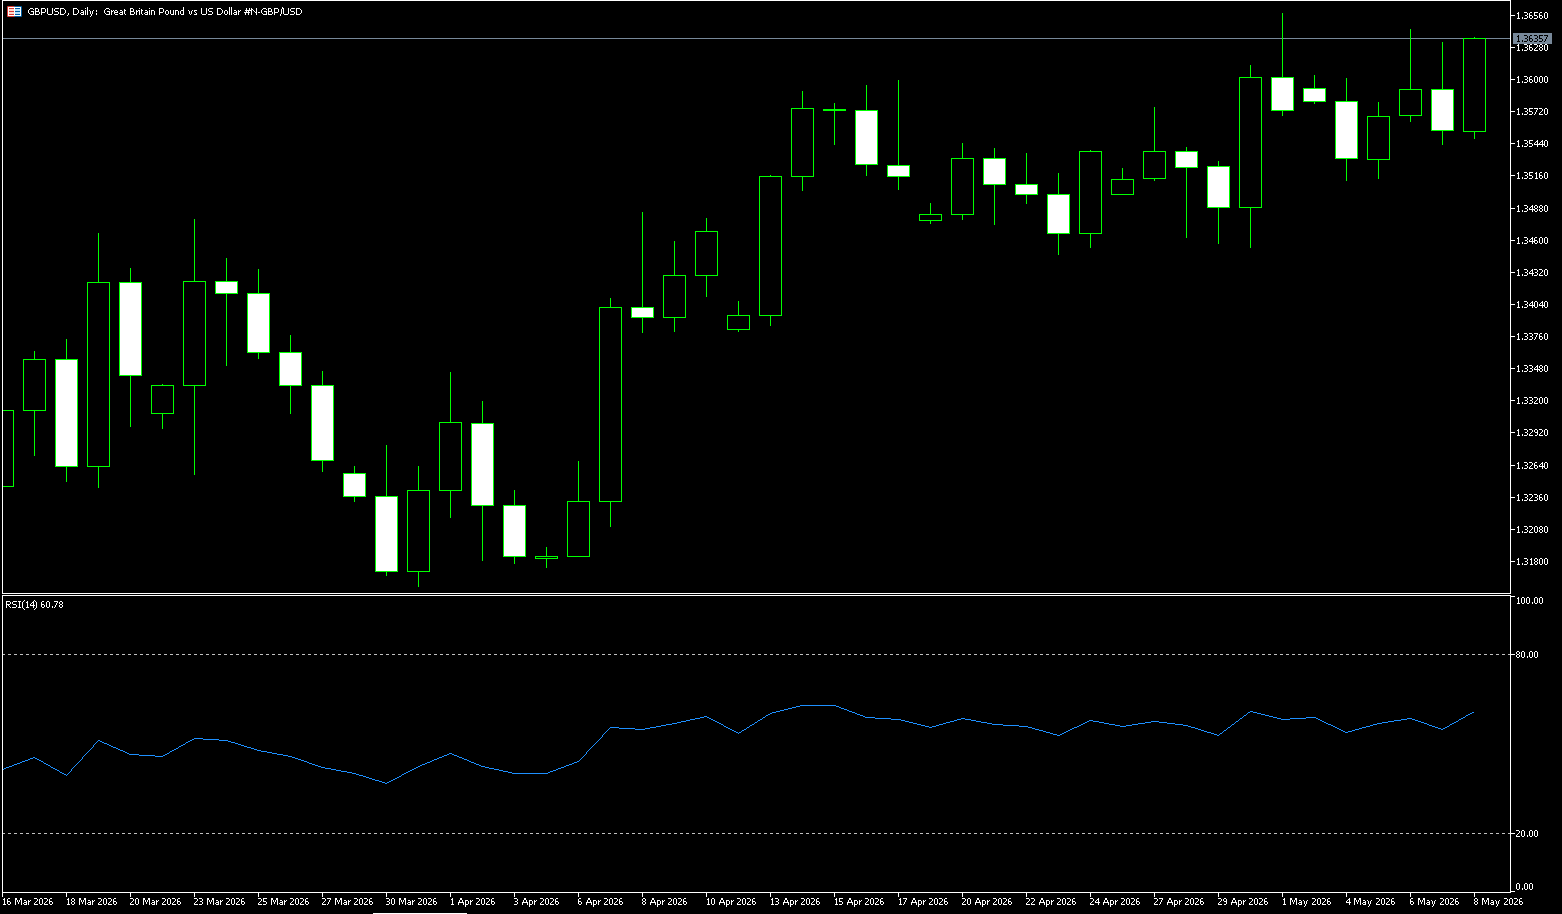
As domestic political turmoil in the UK continues to escalate, the pound has finally begun to react negatively. The previously strange divergence between the deteriorating UK political fundamentals and the pound's price resilience is rapidly correcting, while the dollar is simultaneously breaking out, creating a double-factor pressure. The daily chart shows that the GBP/USD pair currently exhibits a clear bearish trend, with the price effectively breaking below all four moving averages, forming a typical bearish alignment. Specifically, the 20-day simple moving average is at 1.3525; the 50-day is at 1.3429, the 100-day at 1.3479, and the 200-day at 1.3425, while the current price is trading around 1.3353, significantly below all moving averages. Furthermore, the 50-day moving average of 1.3429 has crossed below the 100-day moving average of 1.3479, further confirming the continuation of the downtrend.
GBP/USD is currently trading at 1.3325, maintaining a bearish short-term outlook. The currency pair has retreated from near the downtrend resistance line it previously broke through at 1.3616. The 14-day Relative Strength Index (RSI) is around 37, indicating that downward momentum is building rather than the oversold condition has ended, suggesting that sellers remain in control. Initial resistance is located near 1.3430, where the 50, 100, and 200-day simple moving averages converge. A sustained rise and break above this moving average cluster would alleviate recent downward pressure, targeting the psychological level of 1.3500. If the daily close fails to return to this resistance zone, any rebound could be seen as a corrective bounce within a broader downtrend from recent highs. On the downside, the first support level is at 1.3300 (a psychological level), a break below which would target 1.3228 (the March 31 low) and the 1.3200 area.
Today, consider going long on GBP at 1.3313, with a stop-loss at 1.3300 and targets at 1.3365 and 1.3375.
USD/JPY
The yen depreciated to around 158.70 per dollar before the end of last week and is expected to record a weekly loss of over 1%, pressured by a generally stronger dollar as accelerating US inflation related to the Iran war increased market expectations for a Federal Reserve rate hike later this year. Persistently high oil prices, due to Japan's heavy reliance on energy imports from the region, also put pressure on the yen. The currency has now given back about half of the gains made since multiple rounds of government intervention since April 30, sparking speculation that Tokyo may intervene again to support the yen. US Treasury Secretary Scott Bessant has also expressed support for Japan's recent measures aimed at stabilizing its currency. Meanwhile, Bank of Japan board member Kazuyuki Masuda believes that interest rates should be raised as soon as possible, citing the increasing inflationary risks from the Iran war.
Rising oil prices, higher global yields, and tensions in the Middle East are weakening the yen's stability and negatively impacting recent interventions by the Ministry of Finance. With the Bank of Japan maintaining interest rates and Japanese government bonds underperforming, real yields remain too low, making further foreign exchange intervention a possible means to prevent another sharp rise in the USD/JPY exchange rate. Rising yields and oil price pressures are pushing the yen higher, which will further disrupt the sovereign bond market. This week, higher-than-expected US inflation has exacerbated inflation concerns. Oil prices continued to rise despite the closure of the Strait of Hormuz. The USD/JPY exchange rate has clearly broken through the 158 level, a level that marks the point of the Ministry of Finance's last intervention on May 6th, and is rapidly retreating to the high point of the first intervention on April 30th (both interventions are pending confirmation).
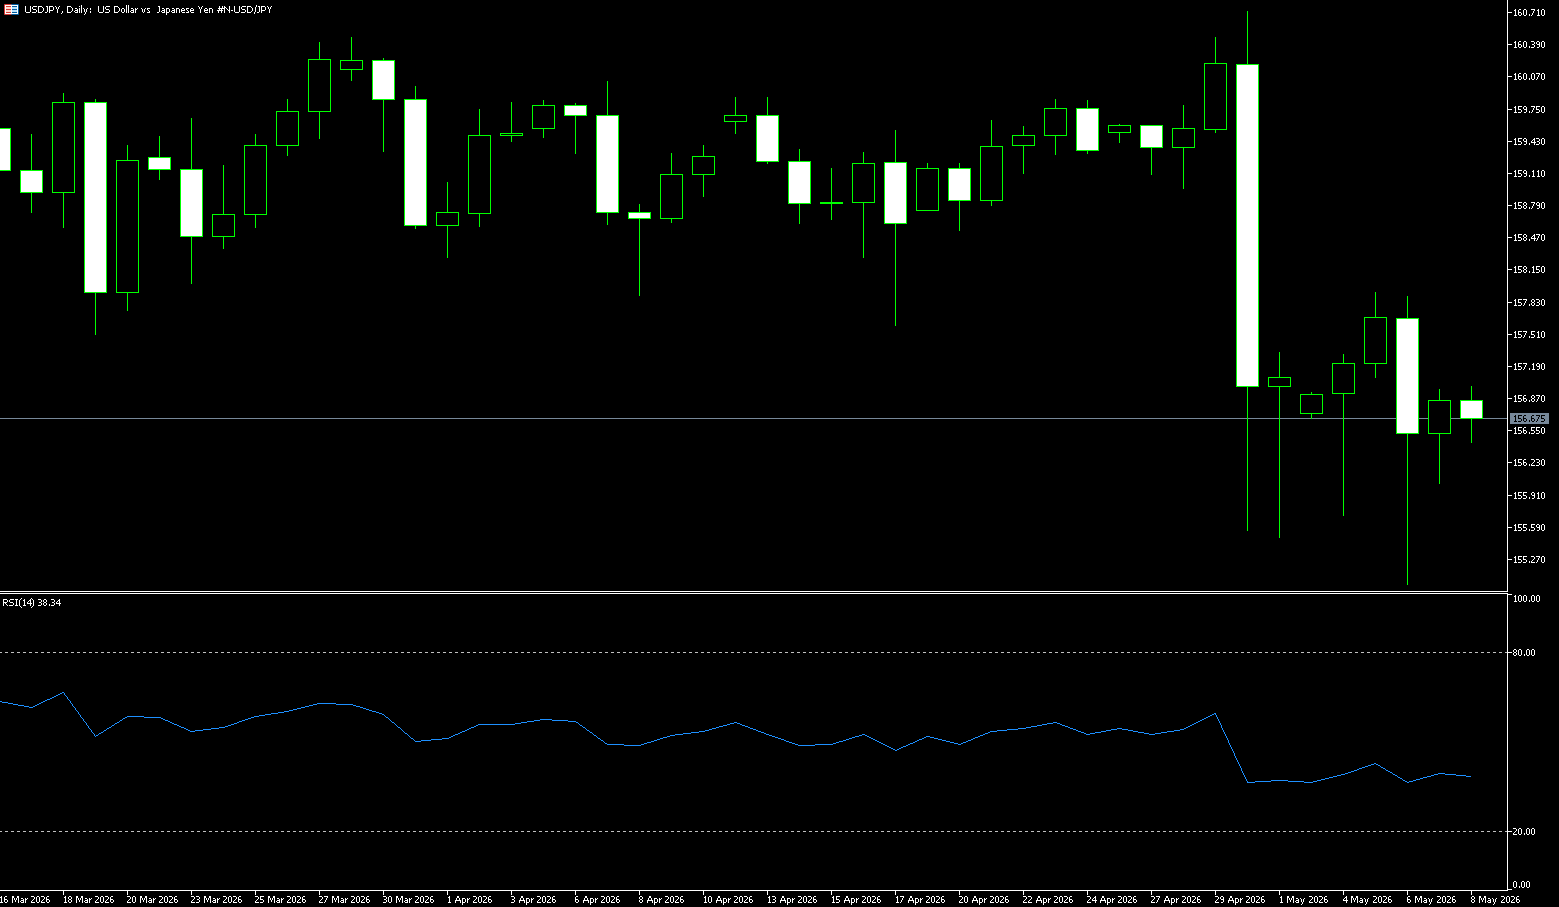
Last week, the key characteristics of the USD/JPY exchange rate were a rapid rebound after Japanese intervention, high-level consolidation with a bullish bias, pressured by the expected intervention at the 160 level, and supported by solid interest rate differentials, resulting in an overall bullish consolidation pattern. US inflation has outperformed expectations, delaying the Fed's rate cut expectations and pushing up US Treasury yields. The Bank of Japan's maintenance of ultra-low interest rates has widened the US-Japan interest rate differential, with carry trades dominating buying, driving the price rebound. However, the biggest risk is a sudden intervention by the Bank of Japan in the exchange rate; the psychological level of 160 is a frequent trigger point for intervention, and a rapid drop of 300-500 points is highly probable if touched, requiring close monitoring. The 200-day moving average at 154.58 forms strong medium-term support, with each pullback finding support. The 50-week moving average at 158.75 continues to rise, indicating a complete bullish trend structure.
Regarding chart patterns, the daily chart shows consecutive positive closes, with prices moving along the upper Bollinger Band, which is widening upwards, clearly indicating a strong bullish pattern. The 5-day, 10-day, and 20-day moving averages are in a bullish alignment, with support levels rising sequentially during pullbacks. The RSI (14) technical indicator is stable in the 50-55 neutral-to-bullish range, not entering a severely overbought state, indicating sufficient upward momentum; while the MACD shows a continuous red bar above the zero line, indicating stable bullish momentum and no top divergence; the trading volume is moderate during the rebound phase, with no breakout signal. If the US dollar continues to rebound this week, the USD/JPY pair may further test the 159.00 (psychological level), and a break above this level would challenge 160.00. A re-establishment above 160.00 would then retest the 160.73 (April high) level. If the exchange rate falls below 157.54 (20-day moving average), it may further retreat to around 156.50, and a break below this level would lead to a further decline to the 156.00 (psychological level).
Consider shorting the US dollar at 158.95 today, with a stop loss at 159.15 and targets at 158.00 and 157.90.
EUR/USD
The euro fell below $1.1650 last week, hitting its lowest level since early April, and is expected to lose more than 1% against the dollar for the week. Increasing evidence of economic damage from the war in Iran has led investors to anticipate interest rates will rise faster than expected and economic growth will weaken. A surge in oil prices after US President Donald Trump stated that "we don't need the Strait of Hormuz to be open" further exacerbated concerns that rising energy costs will drive up prices of goods and services, thus exacerbating inflation. Investors have increased their bets on European Central Bank (ECB) rate hikes and now fully expect three rate increases. ECB official Martins Kazaks reiterated this view on Thursday, stating that if rising oil prices affect inflation expectations, the central bank will need to raise borrowing costs.
The euro/dollar has fallen to its lowest level since early April as widening US Treasury/German bond spreads and rising energy prices have put pressure on the euro. Pricing in an aggressive rate hike by the ECB in June suggests downside risks for the euro relative to G10 currencies. The euro is facing difficulties, having fallen below its 50-day and 200-day moving averages due to the Federal Reserve's repricing, higher US Treasury yields, and oil and gas prices. As May enters its midpoint, the single currency is struggling, only slightly outperforming the Swedish krona and the British pound. The euro/dollar pair fell to its lowest level since early April due to widening US/German bond yield spreads and rising energy prices. Aggressive pricing at the June meeting means that if the ECB holds rates steady next month, and other conditions remain unchanged (oil prices, risk assets, the Fed), the euro faces downside risks against G10 currencies.
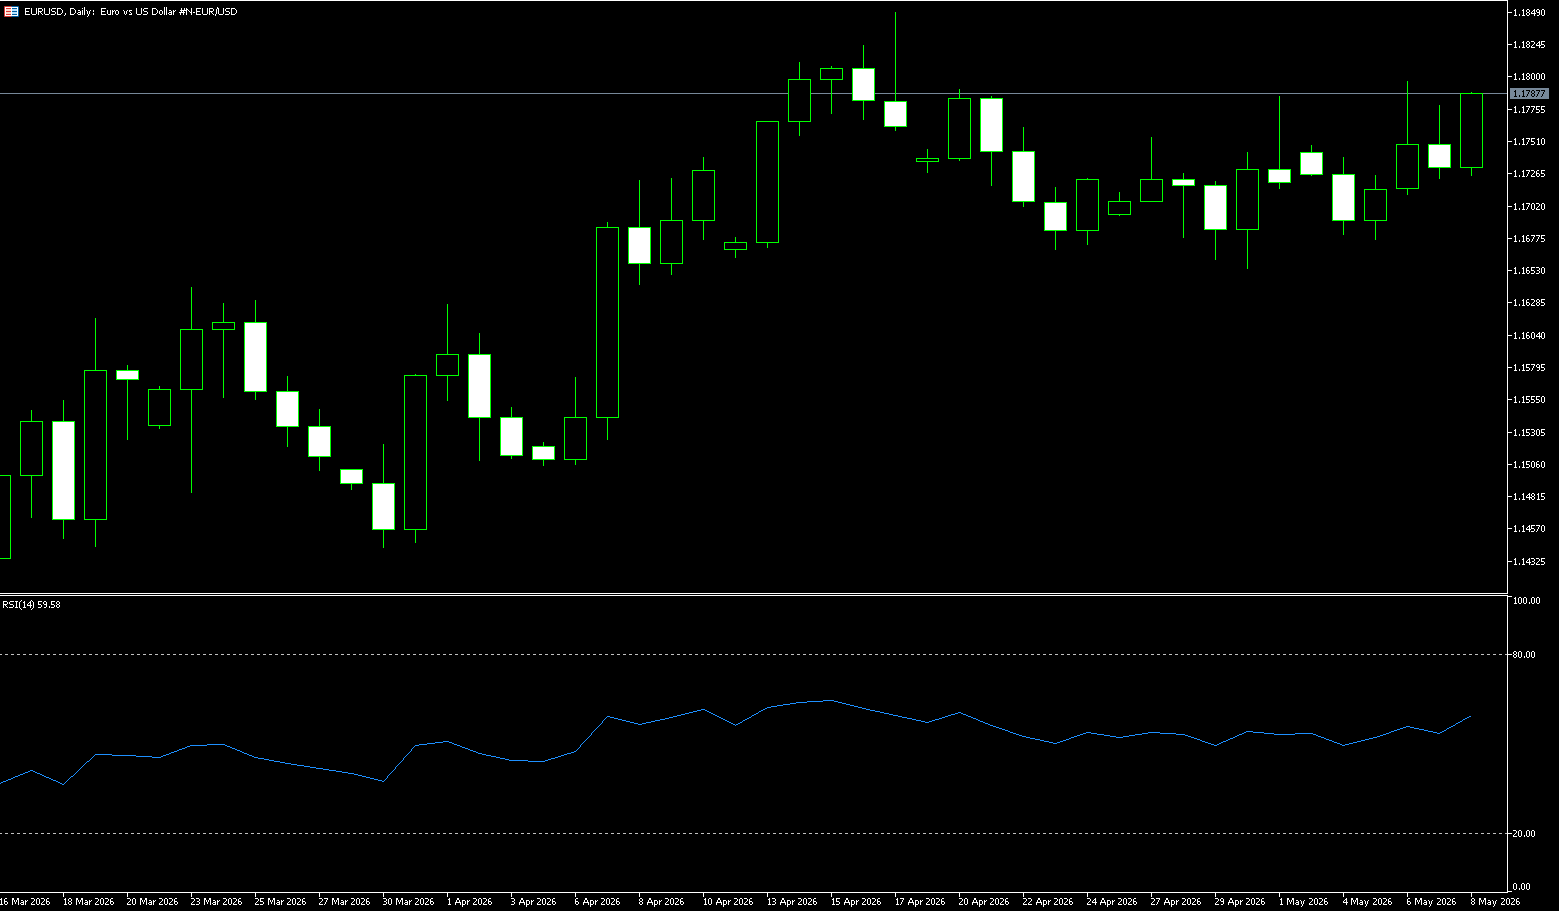
The euro/dollar pair's technical movement last week was characterized by a rise followed by a fall, exhibiting a weak and volatile downward trend. Suppressed by better-than-expected US inflation data and a stronger dollar, the bulls' rebound lacked momentum. Technically, the pair has shifted from high-level pressure to a weaker range-bound movement, with the battle between bulls and bears concentrated in the core range of 1.15–1.187. Last week's weekly chart likely closed with a medium-sized bearish candle, with the exchange rate rising to around 1.1780 before encountering resistance and falling back. The center of gravity continued to shift downwards, ending the previous mild rebound. While the 10-week moving average remains upward, indicating the medium-term uptrend structure is not completely broken, short-term pullback pressure has increased. The recent upward movement over the past two weeks has been confined within an upward channel.
Furthermore, the EUR/USD exchange rate has held steady above the 200-period simple moving average on the 4-hour chart, reaffirming the constructive bias in the short term, while the bullish structure remains intact. However, the Relative Strength Index (RSI) hovers around 41, suggesting the market is in a consolidation phase rather than overextending. Additionally, the latest MACD reading has slightly turned negative, indicating weakening upward momentum, even though price action remains trend-supported. Therefore, any further gains are likely to face initial resistance at the 1.1700 level, followed by initial resistance near the upper boundary of the trend channel at 1.1802. A clear break above this level would pave the way for a stronger bullish extension. On the downside, recent support levels for the exchange rate are at the 1.1600 level and the turning point near the 1.1550 level, followed by the psychological level of 1.1500.
Today, consider going long on the Euro at 1.1612, with a stop loss at 1.1600 and targets at 1.1660 and 1.1670.
Disclaimer: The information contained herein (1) is proprietary to BCR and/or its content providers; (2) may not be copied or distributed; (3) is not warranted to be accurate, complete or timely; and, (4) does not constitute advice or a recommendation by BCR or its content providers in respect of the investment in financial instruments. Neither BCR or its content providers are responsible for any damages or losses arising from any use of this information. Past performance is no guarantee of future results.
Lebih Liputan


Pendedahan Risiko:Instrumen derivatif diniagakan di luar bursa dengan margin, yang bermakna ia membawa tahap risiko yang tinggi dan terdapat kemungkinan anda boleh kehilangan seluruh pelaburan anda. Produk-produk ini tidak sesuai untuk semua pelabur. Pastikan anda memahami sepenuhnya risiko dan pertimbangkan dengan teliti keadaan kewangan dan pengalaman dagangan anda sebelum berdagang. Cari nasihat kewangan bebas jika perlu sebelum membuka akaun dengan BCR.
BCR Co Pty Ltd (No. Syarikat 1975046) ialah syarikat yang diperbadankan di bawah undang-undang British Virgin Islands, dengan pejabat berdaftar di Trident Chambers, Wickham’s Cay 1, Road Town, Tortola, British Virgin Islands, dan dilesenkan serta dikawal selia oleh Suruhanjaya Perkhidmatan Kewangan British Virgin Islands di bawah Lesen No. SIBA/L/19/1122.
Open Bridge Limited (No. Syarikat 16701394) ialah syarikat yang diperbadankan di bawah Akta Syarikat 2006 dan berdaftar di England dan Wales, dengan alamat berdaftar di Kemp House, 160 City Road, London, City Road, London, England, EC1V 2NX. Entiti ini bertindak semata-mata sebagai pemproses pembayaran dan tidak menyediakan sebarang perkhidmatan perdagangan atau pelaburan.

 English
 简体中文
简体中文
 繁體中文
繁體中文
 Bahasa
Melayu
Bahasa
Melayu
 Tiếng
Việt
Tiếng
Việt
 ไทย
ไทย
 日本語
日本語
 한국어
한국어
 ភាសាខ្មែរ
 español