0
US Dollar Index
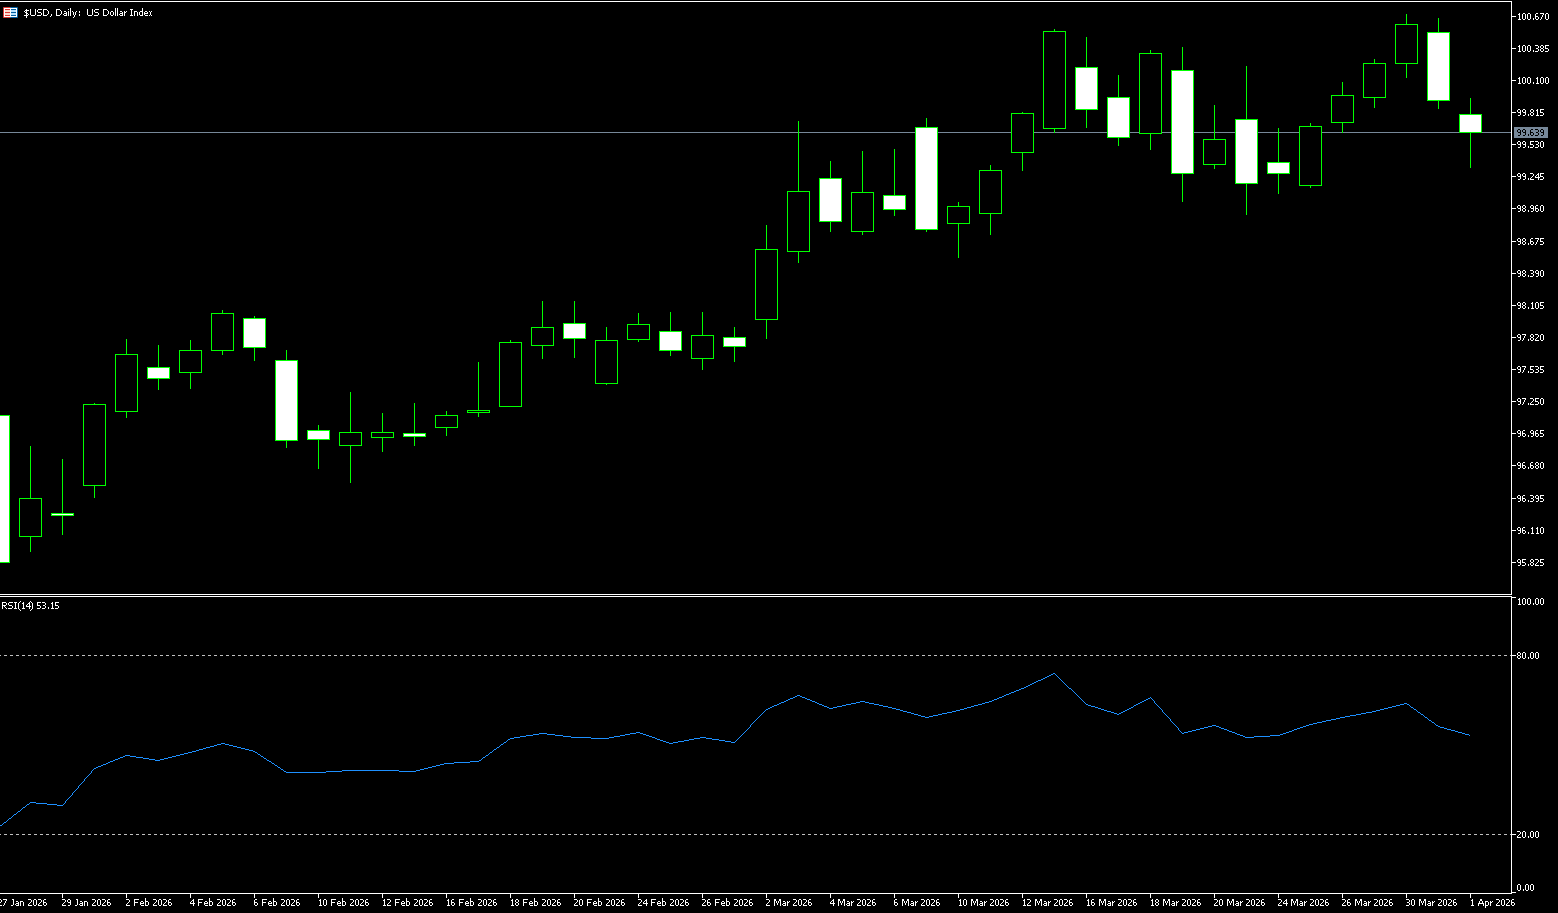
The US dollar index fell to around 99.50 on the first trading day of April, its lowest level in a week, as markets rallied on hopes for a swift resolution to the Middle East conflict. President Trump stated that the US would end its military action against Iran within two to three weeks, regardless of whether a deal was reached. Nevertheless, traders remained cautious as more US troops were being deployed to the region and the Strait of Hormuz remained largely closed. Market participants are now awaiting Trump's national address later that day on the situation with Iran. Last month, the dollar rose 2.3% as investors sought safe-haven assets amid fears of a protracted war. The currency also received support from diminished expectations of a Fed rate cut this year, fueled by a sharp rise in oil prices due to the conflict, which fueled inflation concerns. Meanwhile, Fed Chairman Jerome Powell appeared to offer reassurance to the market that long-term US inflation expectations remained stable.
While the dollar's movements have been volatile, the broader message is its inherent resilience. Despite the frequent fluctuations, the dollar has risen, benefiting from strong yields, a cautious Fed, and a far from stable macroeconomic backdrop. If inflation remains stubborn, the Federal Reserve will remain on the sidelines for a longer period, strengthening the dollar's support; if economic growth slows significantly, discussions will shift back to interest rate cuts. The dollar index rose to a new high of 100.64 at the beginning of the week, before falling back in a V-shape to around 99.80. After breaking through the 100.00 (psychological level) resistance zone, downside potential could open to the 99.08 (30-day simple moving average) - 99.00 (psychological level) area; key resistance levels are first at 100 (psychological level), then at 100.64 (this week's high).
Today, consider shorting the dollar index at 99.67, with a stop-loss at 99.78 and targets at 99.200 and 99.10.
WTI Crude Oil
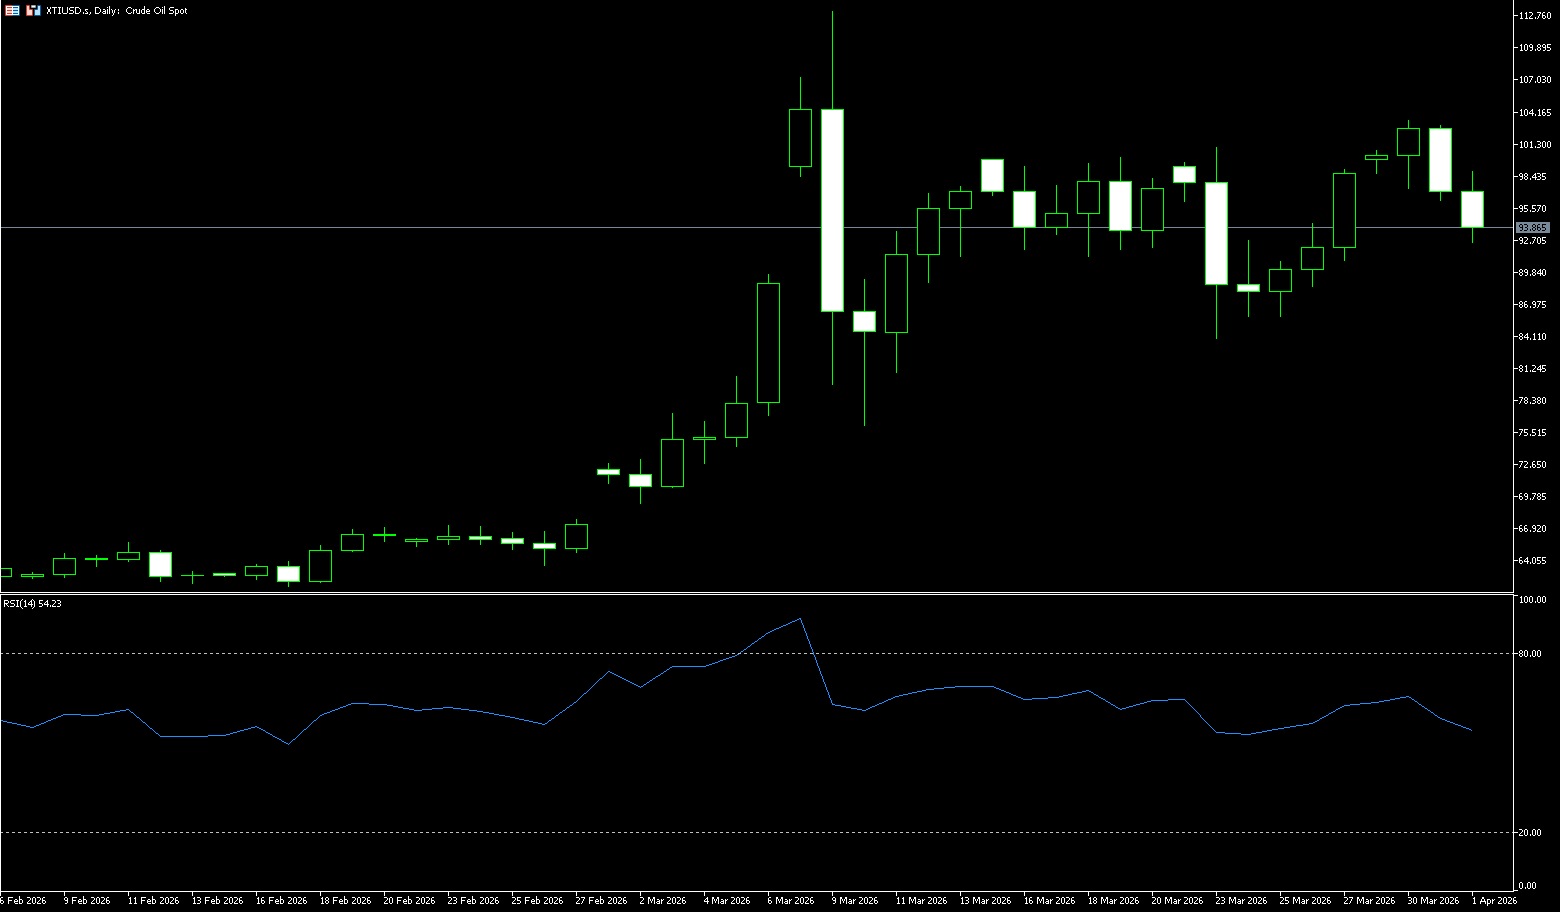
US WTI crude oil prices fell more than 2.5% on the first trading day of April, breaking below $98 per barrel, after posting a record monthly gain in March, boosted by hopes of easing tensions in the Middle East. President Trump told reporters that U.S. troops could withdraw from Iran within two to three weeks and hinted that an agreement with Tehran was possible, although not a necessary condition for ending the conflict. However, markets remained cautious due to the arrival of additional U.S. troops in the region, and Tehran's statement that no formal peace talks were underway, but indicated a willingness to end the war if its conditions were met. All eyes are now on Trump's national address later today regarding the Iran conflict. Meanwhile, Iranian drones attacked fuel tanks at Kuwait International Airport, causing fires and damage, further escalating recent attacks on energy infrastructure. Additionally, API data showed that U.S. crude oil inventories surged by 10.263 million barrels last week.
Overall, the decline in U.S. shale oil production is weakening the global crude oil market's supply buffer. The current oil price logic has clearly shifted from fundamentals to sentiment-driven, making prices more susceptible to unexpected events. In the short term, oil prices are likely to maintain a high-level consolidation pattern, while the medium-term direction still depends on the evolution of the geopolitical situation. From a technical perspective, oil prices on the daily chart remain within a high-level consolidation range. Prices have repeatedly encountered resistance near the psychological level of $100 and Tuesday's high of $103.40, indicating heavy selling pressure. On the downside, the previous range of $92.43 (20-day moving average) and $94.00 (psychological level) forms a key support area, reflecting the bulls' defensive intentions. Momentum indicators show that upward momentum has weakened, but a trend reversal signal has not yet formed.
Today, consider going long on spot crude oil at $94.00, with a stop-loss at $93.80 and targets of $96.00 and $97.00.
Spot Gold
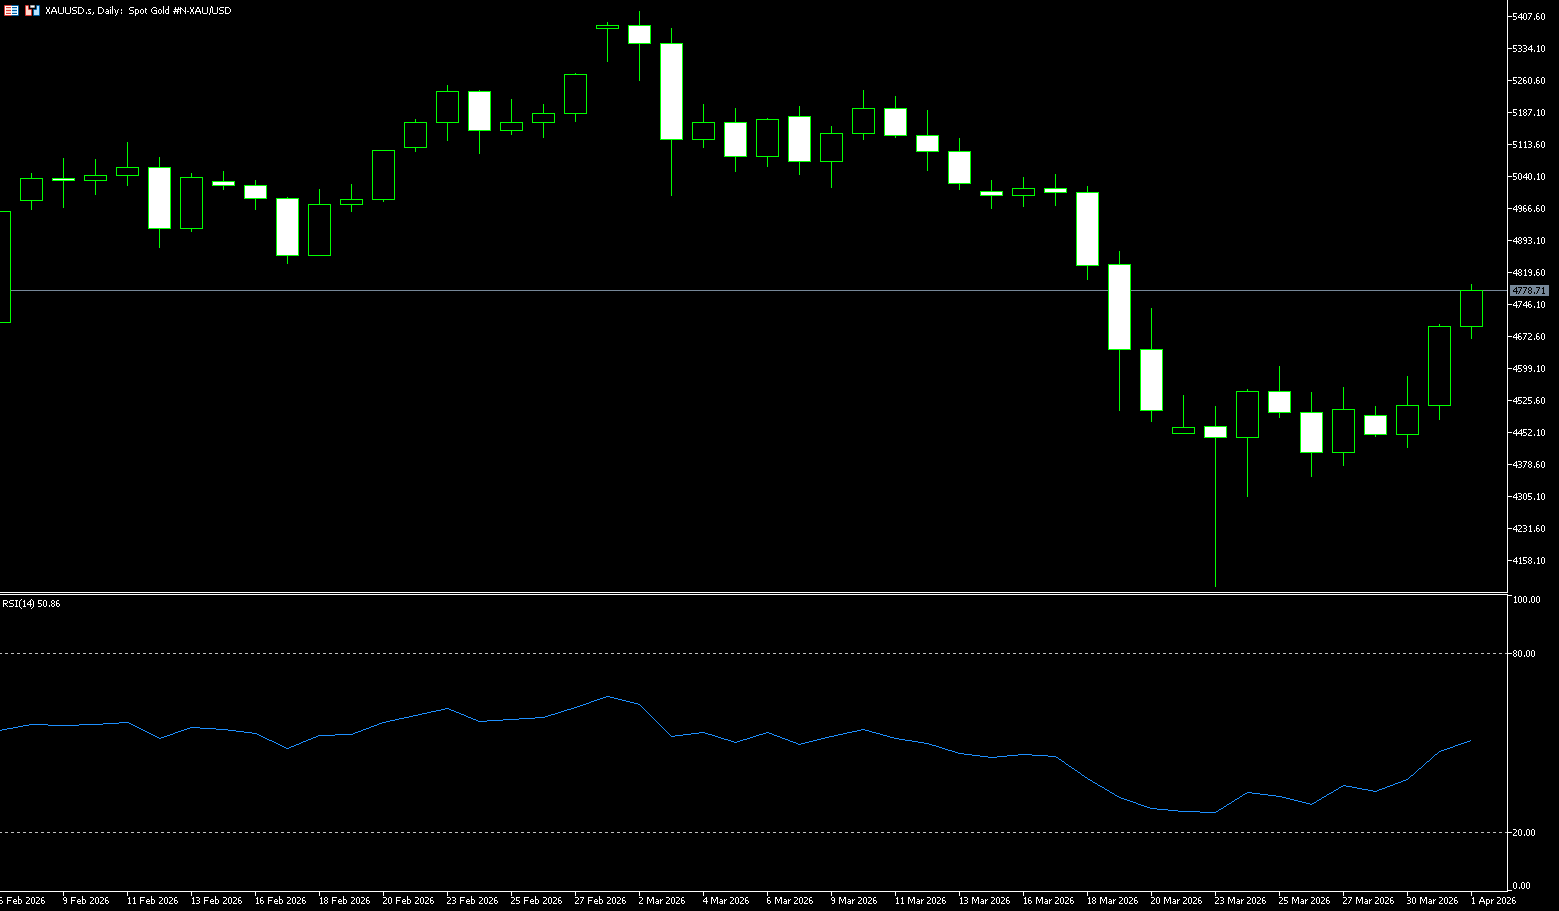
On Wednesday, gold prices rose to around $4,760 per ounce as signs of easing tensions in the Middle East could lead to a decline in oil prices and alleviate concerns about further central bank rate hikes. President Donald Trump told aides he was willing to end the war with Iran, even if the Strait of Hormuz remained closed for most of the year, while regional reports suggested Iranian President Masoud Pezeshkian might consider ending the conflict under certain conditions. However, gold's gains remained limited as easing geopolitical risks reduced safe-haven demand, while a strong dollar and high Treasury yields continued to pressure non-yielding assets. Gold prices plunged more than 13% in March, marking their biggest monthly drop since October 2008, and are still nearly 19% below their all-time high reached at the end of January. Traders are now closely watching upcoming US economic data and signals from the Federal Reserve for further direction on interest rate expectations.
Spot gold recorded a massive 11.8% drop in March, its worst monthly performance since October 2008. The current gold market's bullish/bearish landscape is clearly biased towards the bears, with various technical signals and fund position data corroborating each other, making the characteristics of a false rebound increasingly clear. Gold rose slightly to around $4,700 during the day, seemingly showing signs of bottoming out and rebounding. However, the overall bullish momentum was weak, with prices encountering selling pressure multiple times during the upward movement, resulting in intermittent rebounds and failing to form a sustained upward trend. This weak rebound further confirms the market's assessment of a "dead cat bounce," indicating that after a brief rebound, gold prices are likely to begin a new round of decline, with downside risks accumulating. The $4,800 (psychological level) and $4,880 (25-day moving average) levels have become clear strong resistance levels, not only limiting the extent of any rebound but also likely attracting short sellers to add to their positions, further pressuring prices. If market sentiment weakens again, gold prices will likely come under downward pressure, potentially accelerating the decline to around $4,615 (105-day moving average). Once the 105-day moving average is effectively broken, the $4,600 (psychological level) will be the first target.
Today, consider going long on spot gold at 4,753, with a stop loss at 4,747 and targets at 4,790 and 4,795.
AUD/USD
The Australian dollar rose to around US$0.6940, rebounding from a two-month low, supported by hopes of easing tensions in the Middle East. Global risk sentiment improved after Trump indicated the US could end its military strikes against Iran within two to three weeks, and his planned national address later that day further fueled speculation of a potential de-escalation of the conflict. However, uncertainty remains as reports suggest the US may deploy additional naval forces to the region, while concerns about the Strait of Hormuz are supporting oil prices amid persistent fears of supply risks. The inflationary impact of rising energy costs continues to cloud the outlook, with analysts warning this could keep prices high for a longer period and increase pressure on Australian interest rates. The Reserve Bank of Australia's March rate hike to 4.10% remains closely watched, with the market pricing in a roughly 65% chance of another rate hike at its May meeting, despite a slight easing in expectations for peak rates.
The Australian dollar (AUD) remains supported by strong macroeconomic fundamentals and a firm stance from the Reserve Bank of Australia (RBA). However, this is not an ideal environment for a bull market. The AUD performs well when risk appetite is high, while the US dollar takes control when market volatility intensifies. The bias remains bullish, but short-term risks are beginning to turn negative. On the daily chart, the pair is trading above 0.6900. The short-term bias is slightly bullish, as the pair remains above 0.6870, the 38.2% Fibonacci retracement level from the 0.6421 low to the 0.7147 high, and the price is currently hovering above this threshold. This suggests that the overall uptrend momentum is weakening but not yet broken, and the pair remains firmly above the 100-day simple moving average at 0.6826 and the psychological level of 0.6800. The Relative Strength Index (RSI) has fallen to around 43, reinforcing the signal of easing bullish pressure, and there is still room for further downside in the short term. Immediate resistance is at 0.6870 (38.2% Fibonacci retracement), followed by key support near the 100-day simple moving average at 0.6826.
Consider going long on the Australian dollar today at 0.6910, with a stop loss at 0.6900 and targets at 0.6970 and 0.6960.

GBP/USD
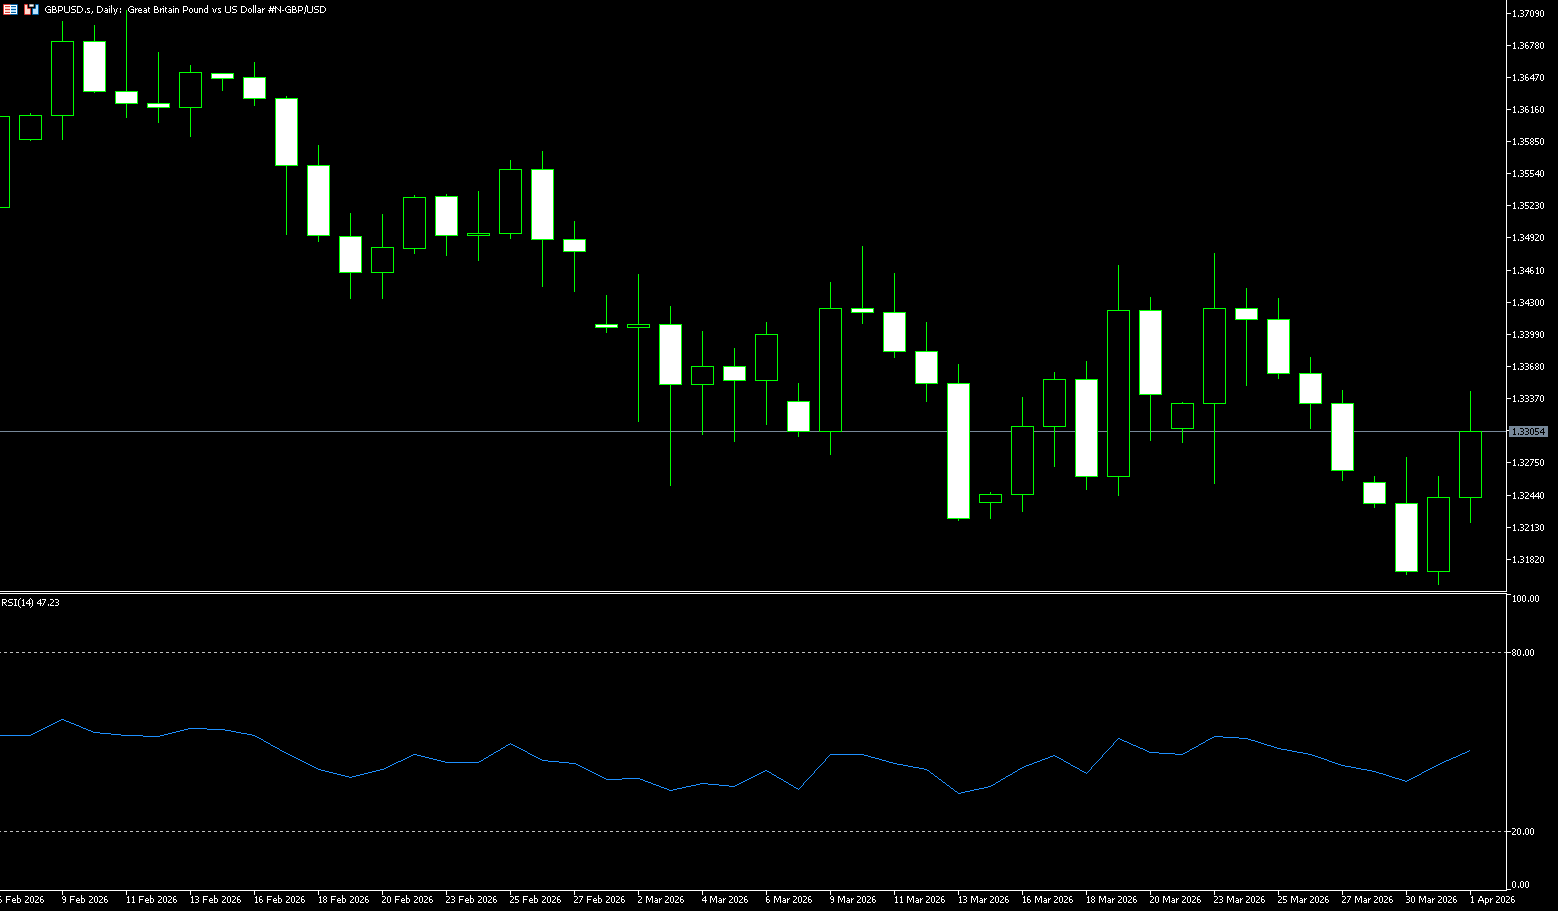
The pound rose to $1.33, moving away from its recent four-month low, as optimism grew that the conflict with Iran could be resolved in the near term. This modest rebound follows a volatile March when the pound fell 1.9% against the dollar, its worst monthly decline since July 2025, due to escalating tensions in the Middle East. US President Donald Trump said on Tuesday that the US could withdraw from Iran “within two to three weeks,” with or without a deal. However, the Strait of Hormuz crisis remains unresolved, and the closure of this vital waterway continues to disrupt oil flows and push up prices. Persistent uncertainty and inflationary pressures have led to a revision of market expectations for Bank of England policy, with investors now anticipating fewer than two rate hikes in 2026, down from four predicted in mid-March. Early bets on two pre-conflict rate cuts have also been abandoned.
On the daily chart, GBP/USD is slightly bearish in the short term, as the spot price remains below the flattening 100-day simple moving average at 1.3419 and trading below the Bollinger Band middle line at 1.3336, keeping price action in the lower half of the trading range. The 14-day Relative Strength Index (RSI) is around 41, reinforcing the loss of bullish momentum rather than significant selling pressure, indicating that sellers still have the upper hand, but the decline is restrained rather than impulsive. Near-term support lies near the recent psychological low of 1.3200; a break below this area would expose the next downside target around 1.3159 (Tuesday's low). Initial resistance is at 1.3357 (25-day moving average). A daily close above this resistance would help neutralize bearish sentiment and pave the way for a further challenge of the 100-day simple moving average at 1.3419.
Consider going long on GBP at 1.3290 today, with a stop loss at 1.3280 and targets at 1.3350 and 1.3360.
USD/JPY
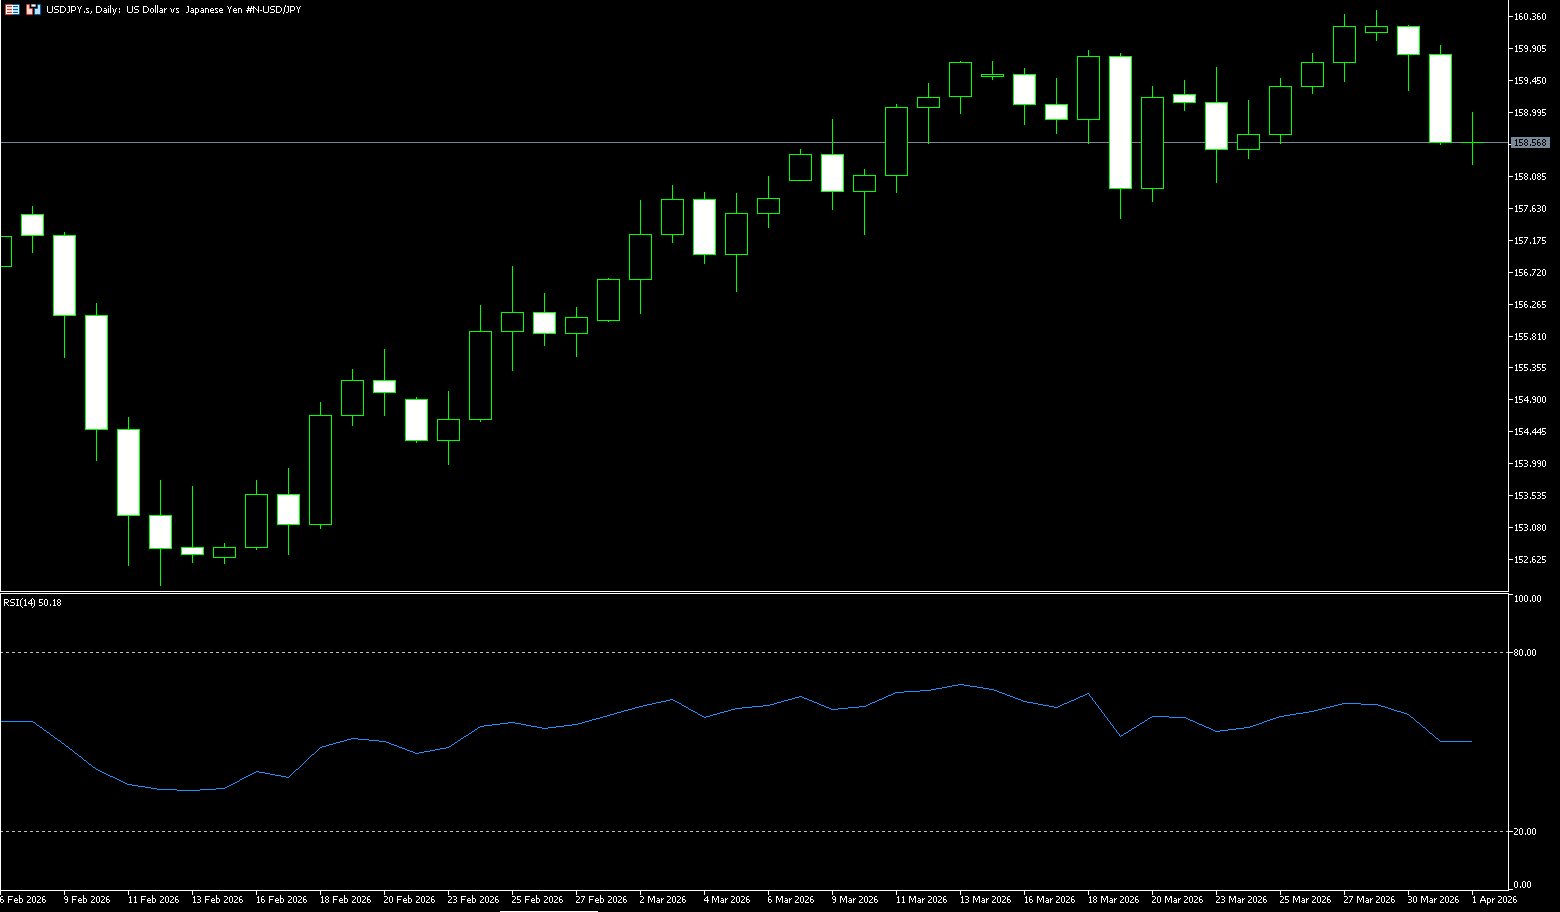
USD/JPY has recovered slightly from its more than one-week low near 158.45 reached during Wednesday's Asian session, but lacks sustained buying. The spot price is currently trading below 159.00, almost flat on the day, as traders assess the potential impact of a possible US withdrawal from the war with Iran and await new geopolitical developments for substantial momentum. US President Trump stated on Tuesday that the US would end its current hostilities with Iran within two to three weeks and that Tehran would not need an agreement with Washington to end the conflict. The statement boosted hopes for a rapid de-escalation of tensions in the Middle East, strongly bolstering global risk sentiment, weakening the dollar's status as a reserve currency, and limiting the USD/JPY's gains. Meanwhile, the closely watched Bank of Japan's Tankan survey showed improved business confidence among large manufacturers as of March. This further supported the yen and limited the USD/JPY's gains. This outlook could put pressure on the yen, but market speculation that authorities would intervene to support the currency helped limit losses. Nevertheless, the fundamental backdrop is complex, and investors should exercise caution before making directional bets around USD/JPY.
On the daily chart, USD/JPY is down 0.40%, trading around 158.50 at the time of writing. It previously fell from the 159.60 area to an intraday low of around 158.25, as the dollar weakened following unexpected geopolitical developments. USD/JPY is trading at 158.50 on the daily chart. The overall bias is bullish, as the price is well above the rising 50-day and 200-day simple moving averages, confirming that the uptrend remains strong despite the recent pullback from the 160.00 area. The Stochastic Relative Strength Index (RSI) has retreated from overbought extremes but remains in positive territory, indicating weakening upward momentum rather than a clear reversal. The preference remains to buy on dips, as long as the pair stays above short-term trend support. Immediate support is at the 158.00 level; a break below this level would expose 157.00 as the next support within a broader bullish structure. Initial resistance is at 159.22, the recent swing high; if bullish momentum recovers, the next target is the 160.00 psychological level.
Today, consider shorting the US dollar at 159.00, with a stop loss at 159.20 and targets at 158.00 and 157.80.
EUR/USD
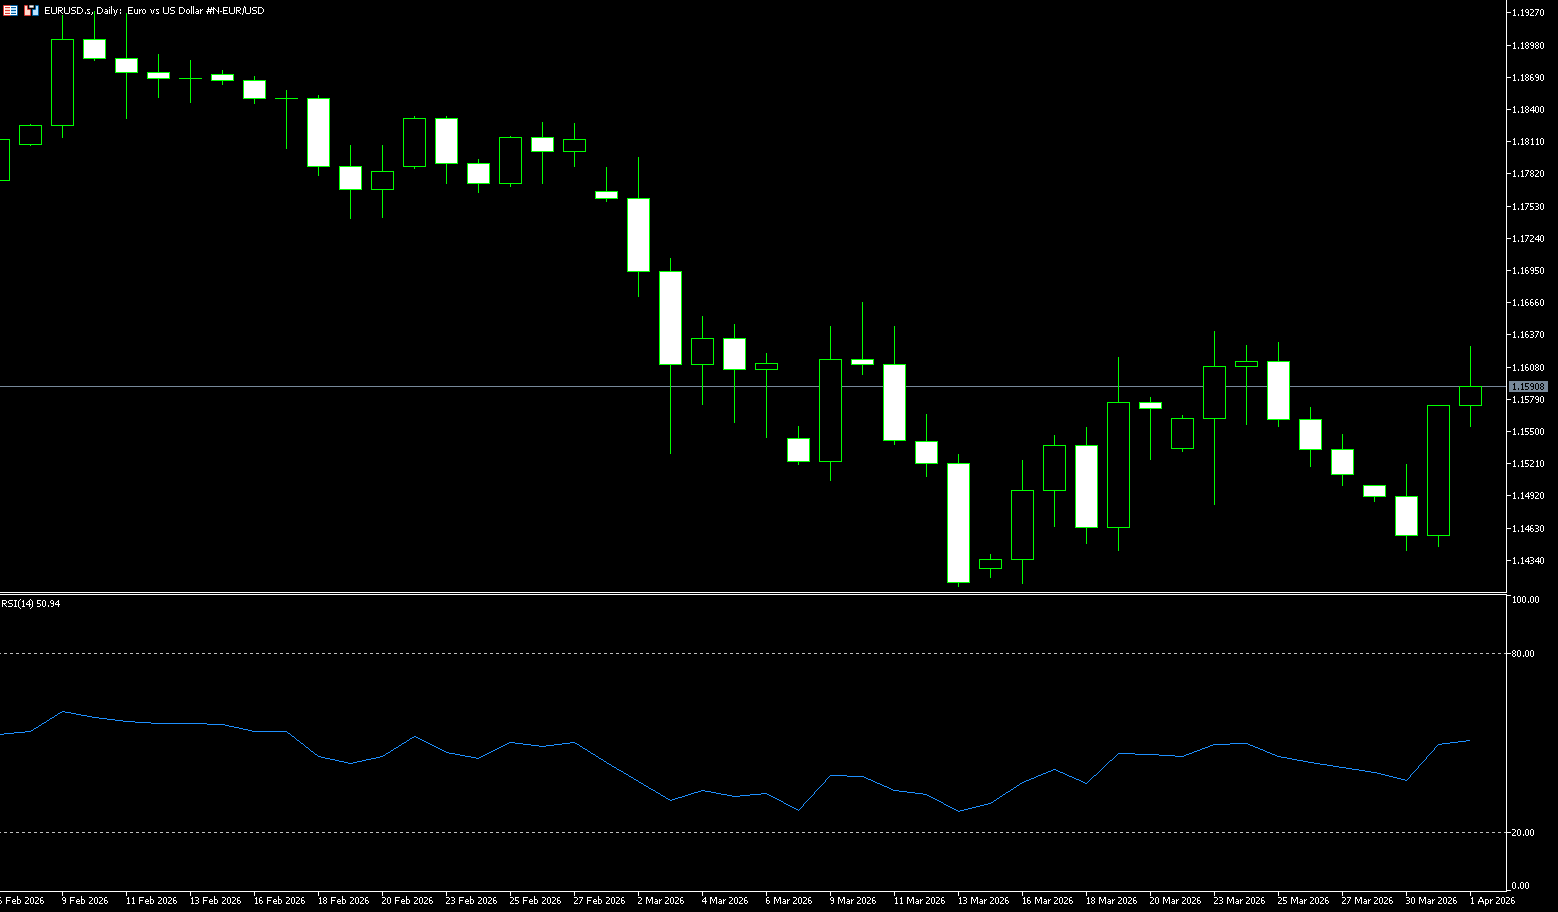
The euro/dollar pair rose for the second consecutive day, trading around 1.1600 during Wednesday's European session. The pair gained as the dollar weakened and safe-haven demand waned due to easing tensions in the Middle East. US President Trump stated on Tuesday that the US would "leave" the war with Iran "soon," indicating a withdrawal could occur within two to three weeks. This statement reinforced previous pronouncements, suggesting that the US strategic objectives have been largely achieved, and market expectations for a swift resolution to the conflict have increased. Regarding Iran, President Masoud Pezeshkian stated his willingness to de-escalate regional tensions if concrete guarantees are received. European Central Bank President Christine Lagarde and Chief Economist Philip Lane stated that recent developments may support a more hawkish monetary policy stance. However, they also noted that the scale and timing of any policy response will depend on the severity and duration of the energy shock triggered by the geopolitical situation.
The euro started the week quite weakly against the dollar, bearing additional downward momentum and approaching its year-to-date low near 1.1414. This deep pullback in the pair is a response to the continued strength of the dollar, as investors favor safe-haven assets amid unresolved geopolitical tensions in the Middle East. On the daily chart, EUR/USD is trading at 1.1600. The short-term bias is slightly weak, as the spot price remains below the 50-day and 100-day simple moving averages, which are above 1.16 and have flattened after previous tops, indicating continued downward pressure below a broad resistance zone. Momentum indicators reinforce this trend, with the Relative Strength Index (RSI) sliding towards 49 after failing to hold above the 50 neutral level, suggesting the downtrend remains active rather than a consolidation range. Immediate resistance is at 1.1650 (the 35-day simple moving average), followed by 1.1700 (the psychological level). Initial support is at 1.1535 (14-day simple moving average). A decisive break below this level would pave the way for the next bearish target of the 1.1500 area.
Consider going long on the Euro today at 1.1577, with a stop-loss at 1.1570 and targets at 1.1650 and 1.1640.
Disclaimer: The information contained herein (1) is proprietary to BCR and/or its content providers; (2) may not be copied or distributed; (3) is not warranted to be accurate, complete or timely; and, (4) does not constitute advice or a recommendation by BCR or its content providers in respect of the investment in financial instruments. Neither BCR or its content providers are responsible for any damages or losses arising from any use of this information. Past performance is no guarantee of future results.
Lebih Liputan


Pendedahan Risiko:Instrumen derivatif diniagakan di luar bursa dengan margin, yang bermakna ia membawa tahap risiko yang tinggi dan terdapat kemungkinan anda boleh kehilangan seluruh pelaburan anda. Produk-produk ini tidak sesuai untuk semua pelabur. Pastikan anda memahami sepenuhnya risiko dan pertimbangkan dengan teliti keadaan kewangan dan pengalaman dagangan anda sebelum berdagang. Cari nasihat kewangan bebas jika perlu sebelum membuka akaun dengan BCR.
BCR Co Pty Ltd (No. Syarikat 1975046) ialah syarikat yang diperbadankan di bawah undang-undang British Virgin Islands, dengan pejabat berdaftar di Trident Chambers, Wickham’s Cay 1, Road Town, Tortola, British Virgin Islands, dan dilesenkan serta dikawal selia oleh Suruhanjaya Perkhidmatan Kewangan British Virgin Islands di bawah Lesen No. SIBA/L/19/1122.
Open Bridge Limited (No. Syarikat 16701394) ialah syarikat yang diperbadankan di bawah Akta Syarikat 2006 dan berdaftar di England dan Wales, dengan alamat berdaftar di Kemp House, 160 City Road, London, City Road, London, England, EC1V 2NX. Entiti ini bertindak semata-mata sebagai pemproses pembayaran dan tidak menyediakan sebarang perkhidmatan perdagangan atau pelaburan.

 English
 简体中文
简体中文
 繁體中文
繁體中文
 Bahasa
Melayu
Bahasa
Melayu
 Tiếng
Việt
Tiếng
Việt
 ไทย
ไทย
 日本語
日本語
 한국어
한국어
 ភាសាខ្មែរ
 español