0
US Dollar Index
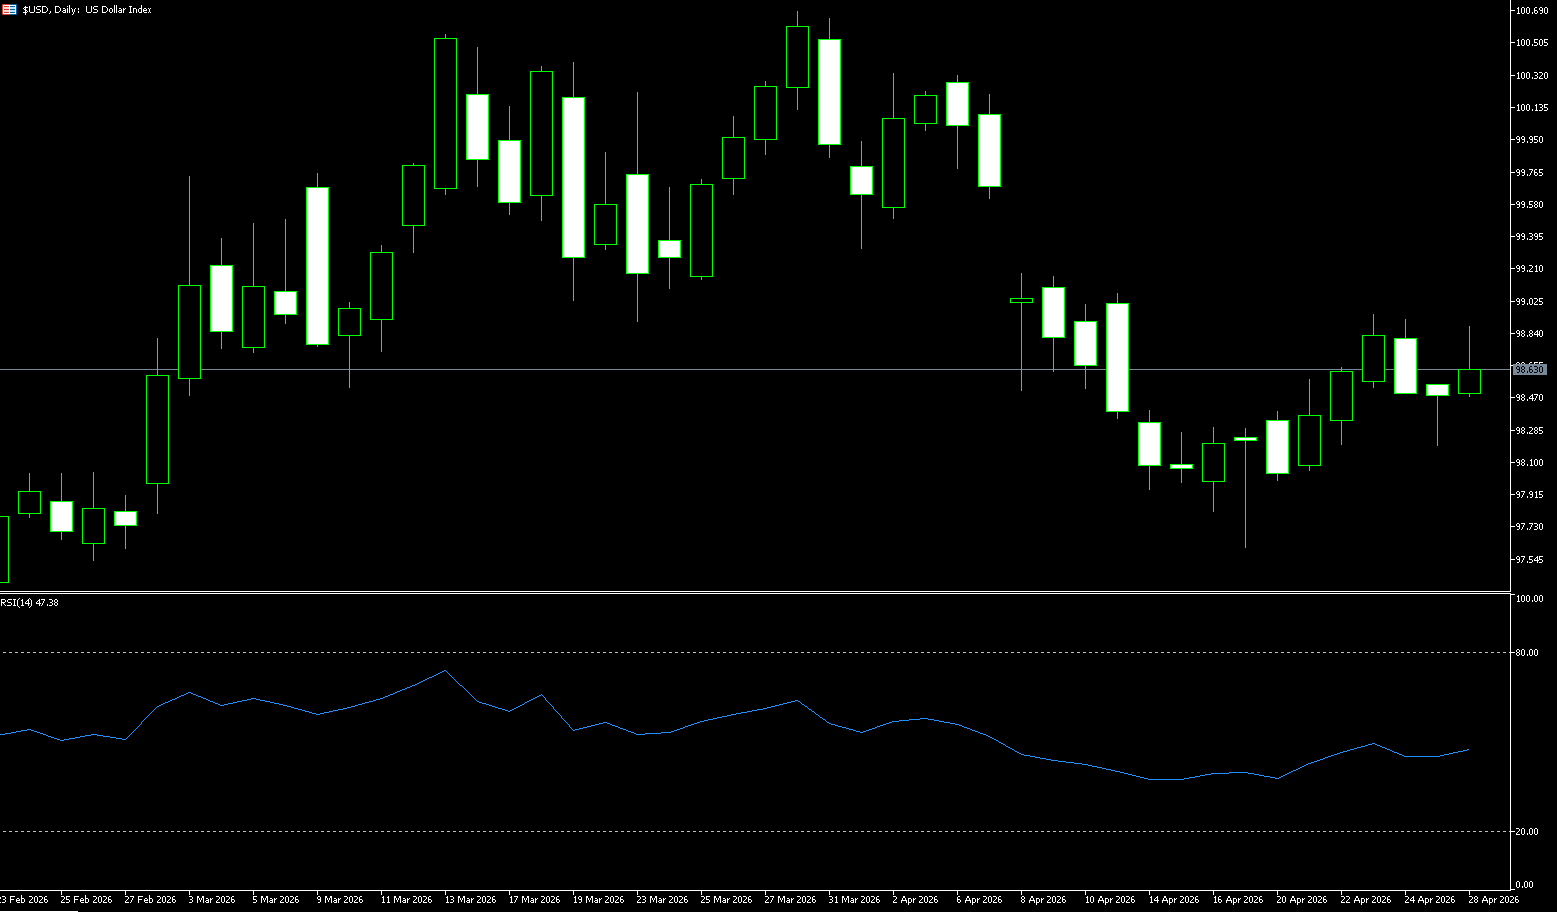
The US dollar index hovered around 98.60 on Tuesday, after a sharp drop in the previous session, as renewed diplomatic efforts in the US-Iran conflict reduced demand for safe-haven currencies. Iran reportedly made a new proposal to the US through Pakistani mediators, stating it would reopen the Strait of Hormuz if Washington lifted its blockade, although Tehran's nuclear program remains a key obstacle in negotiations. Market attention also turned to the upcoming Federal Reserve policy meeting, where interest rates are expected to remain unchanged; this may be Jerome Powell's last meeting as Fed chairman. Fed nominee Kevin Warsh emphasized policy independence, although the market is still pricing in a more aggressive easing cycle. Investors are also awaiting policy decisions from other major central banks this week, including the European Central Bank, the Bank of England, and the Bank of Japan.
It is worth noting that the current geopolitical drivers in the oil market are subtly intertwined with the US dollar index, with the traditional negative correlation showing a temporary divergence, and the dollar and oil prices exhibiting a phenomenon of rising and falling together. In the early stages of the conflict, the US dollar index surged to 100.64 due to safe-haven demand, but gradually fell back to near 98 as the situation became increasingly tense, while oil prices remained high and volatile. This divergence is due to two main factors: firstly, the US, as a net exporter of crude oil, benefits from a trade surplus resulting from rising oil prices, which supports the dollar; secondly, the key short-term level for the dollar index is around the 200-day simple moving average at 98.54. If it can hold above this level, the bullish trend will continue, targeting the previous high resistance levels of 98.94 (last Thursday's high) and 99.00 (the psychological level). However, a decisive break below this level would indicate a weakening trend and a potential pullback to the 98.00 level and the 97.63 level (the low of April 17th).
Today, consider shorting the US Dollar Index at 98.72, with a stop-loss at 98.85 and targets at 98.20 and 98.40.
WTI Crude Oil
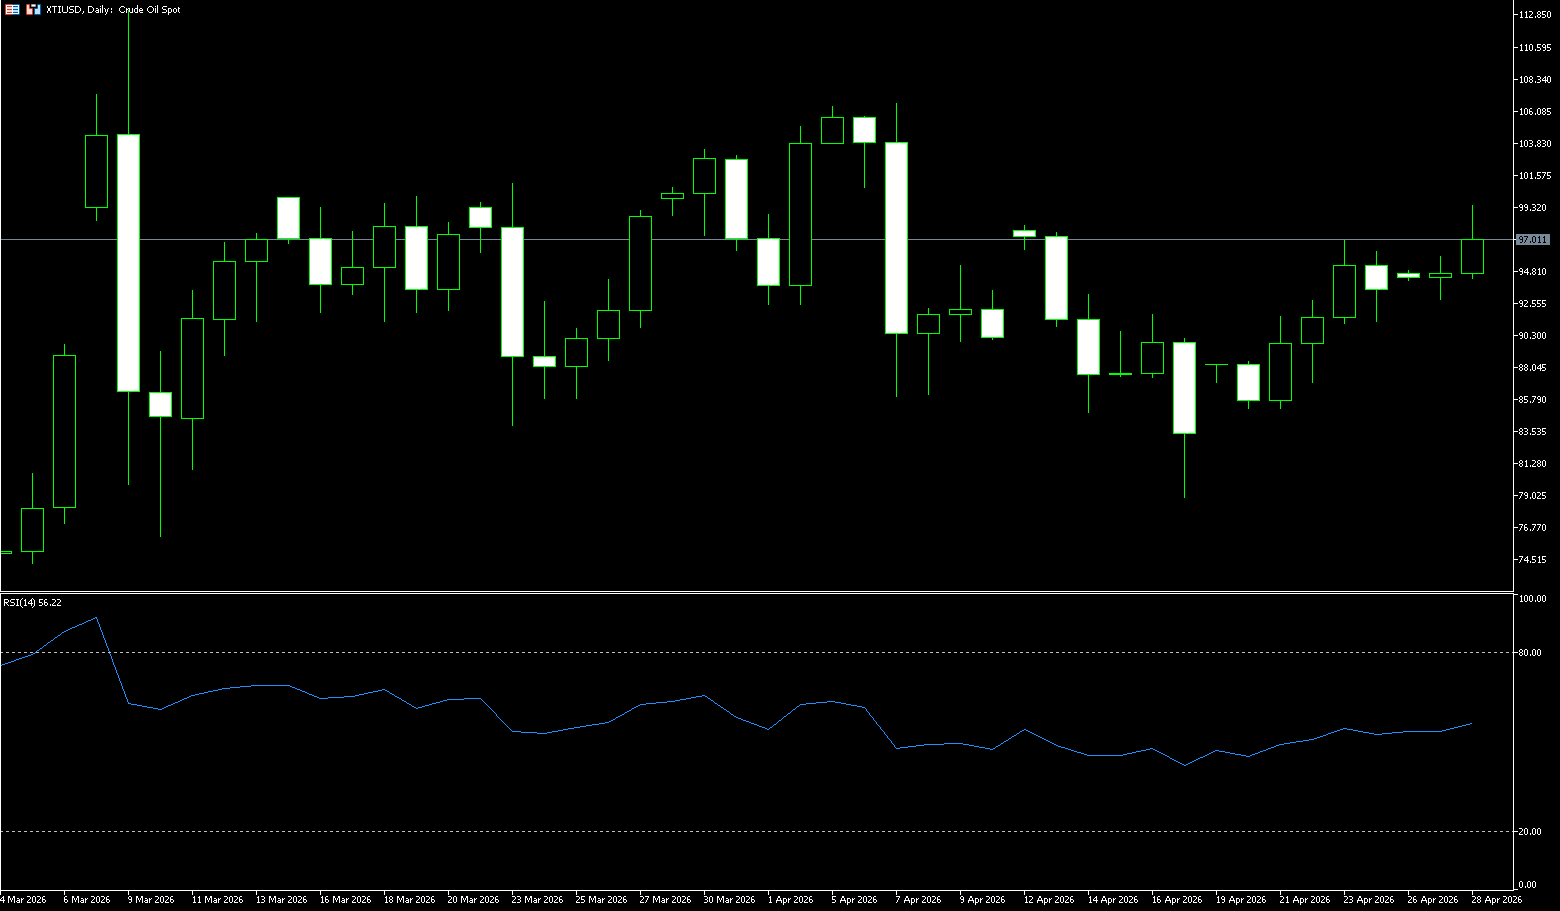
WTI crude oil rose above $97.50 per barrel on Tuesday, extending gains from the previous trading session, as the market assessed the possibility of a lasting ceasefire and the prospect of a potential reopening of the Strait of Hormuz, following Iran's submission of a new proposal to the United States. Tehran reportedly signaled through Pakistan that hostilities could cease if Washington lifts its maritime blockade, agrees to revise the framework for passage through the Strait of Hormuz, and provides assurances for future military action. The United States has expressed skepticism about the proposal and is expected to issue a counter-proposal in the coming days, while Iran's nuclear program remains a key point of contention. The conflict has entered its ninth week, pushing up energy prices and disrupting supply in major markets, while the International Energy Agency has warned of an unprecedented supply shock and increasing risks of slowing demand.
Overall, oil prices are currently at a critical juncture driven by both fundamentals and geopolitical risks. The expanding supply disruptions are providing solid support for oil prices, while the uncertainty surrounding US-Iran negotiations is the biggest short-term variable. From a trend perspective, oil prices still have upward potential, but the pace will depend on whether geopolitical tensions ease. Technically, current oil prices are exhibiting a typical high-level consolidation pattern. On the daily chart, the overall trend remains upward, but momentum has slowed, with prices repeatedly testing the $100 level without a decisive breakthrough, indicating strong resistance above. A support level has formed around $92; a break below this level could trigger a technical pullback. Momentum indicators show that while bullish forces are dominant, they are showing signs of weakening. On the 4-hour chart, prices are trading within a range, exhibiting a short-term slightly bullish consolidation pattern. Technical indicators such as the RSI remain in the mid-to-high range, indicating intensified competition between bulls and bears. A break above $98.50 and the psychological level of $100 could open up new upward potential; conversely, a break below $92 should raise concerns about a potential pullback to the lower support area of $90.
Today, consider going long on crude oil at 97.30, with a stop loss at 97.10 and targets at 99.00 and 100.00.
Spot Gold
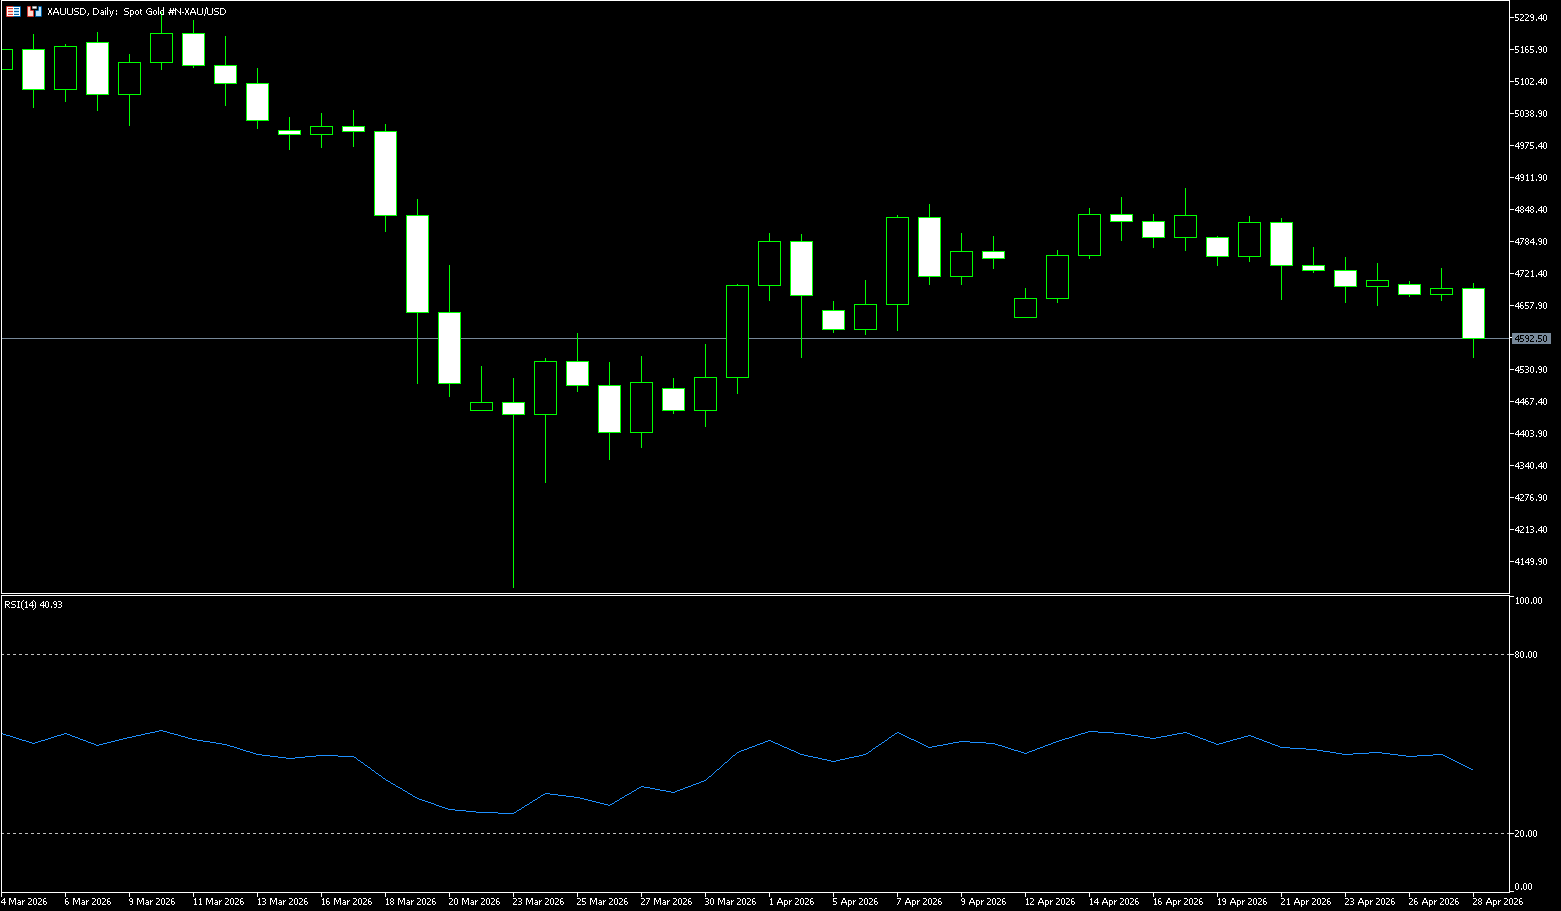
Gold fell to near $4,600 per ounce on Tuesday, extending losses from the previous session, as investors assessed renewed diplomatic efforts to resolve the US-Iran conflict, which has triggered a historic energy supply shock and exacerbated inflation concerns. Tehran reportedly made a new proposal to Washington through Pakistani mediators, suggesting reopening the Strait of Hormuz if the US lifts its blockade, while postponing negotiations on Iran's nuclear program. The US remains cautious on the proposal and is expected to issue a counter-proposal in the coming days, with Tehran's nuclear ambitions remaining a major obstacle. Investors are also focused on policy decisions from major central banks this week, including the Federal Reserve, the European Central Bank, and the Bank of Japan. High energy prices driven by the Middle East conflict have exacerbated inflation concerns and increased expectations that central banks may maintain higher interest rates for longer or even tighten them further, putting pressure on non-yielding gold.
From the market reaction, the current gold price movement exhibits a typical tug-of-war between bulls and bears. On the one hand, geopolitical risks and inflation expectations are supporting gold prices; on the other hand, persistently high interest rates and a potential strengthening of the US dollar are putting downward pressure on prices. Globally, funds are repeatedly switching between safe-haven and yield-generating assets, leading to increased volatility in gold prices but no clear trend. In the short term, gold prices are more likely to remain range-bound rather than trending in one direction. Technically, the daily chart for gold remains in a high-level consolidation pattern. While the overall trend hasn't completely turned bearish, upward momentum has clearly weakened. Key resistance levels are concentrated around $4,750 and $4,800 (psychological levels), areas that have repeatedly acted as resistance, indicating heavy selling pressure. Support levels are at $4,500 (psychological level) and $4,569 (140-day simple moving average).
Today, consider going long on spot gold at 4,590, with a stop loss at 4,585 and targets at 4,750 and 4,740.
AUD/USD
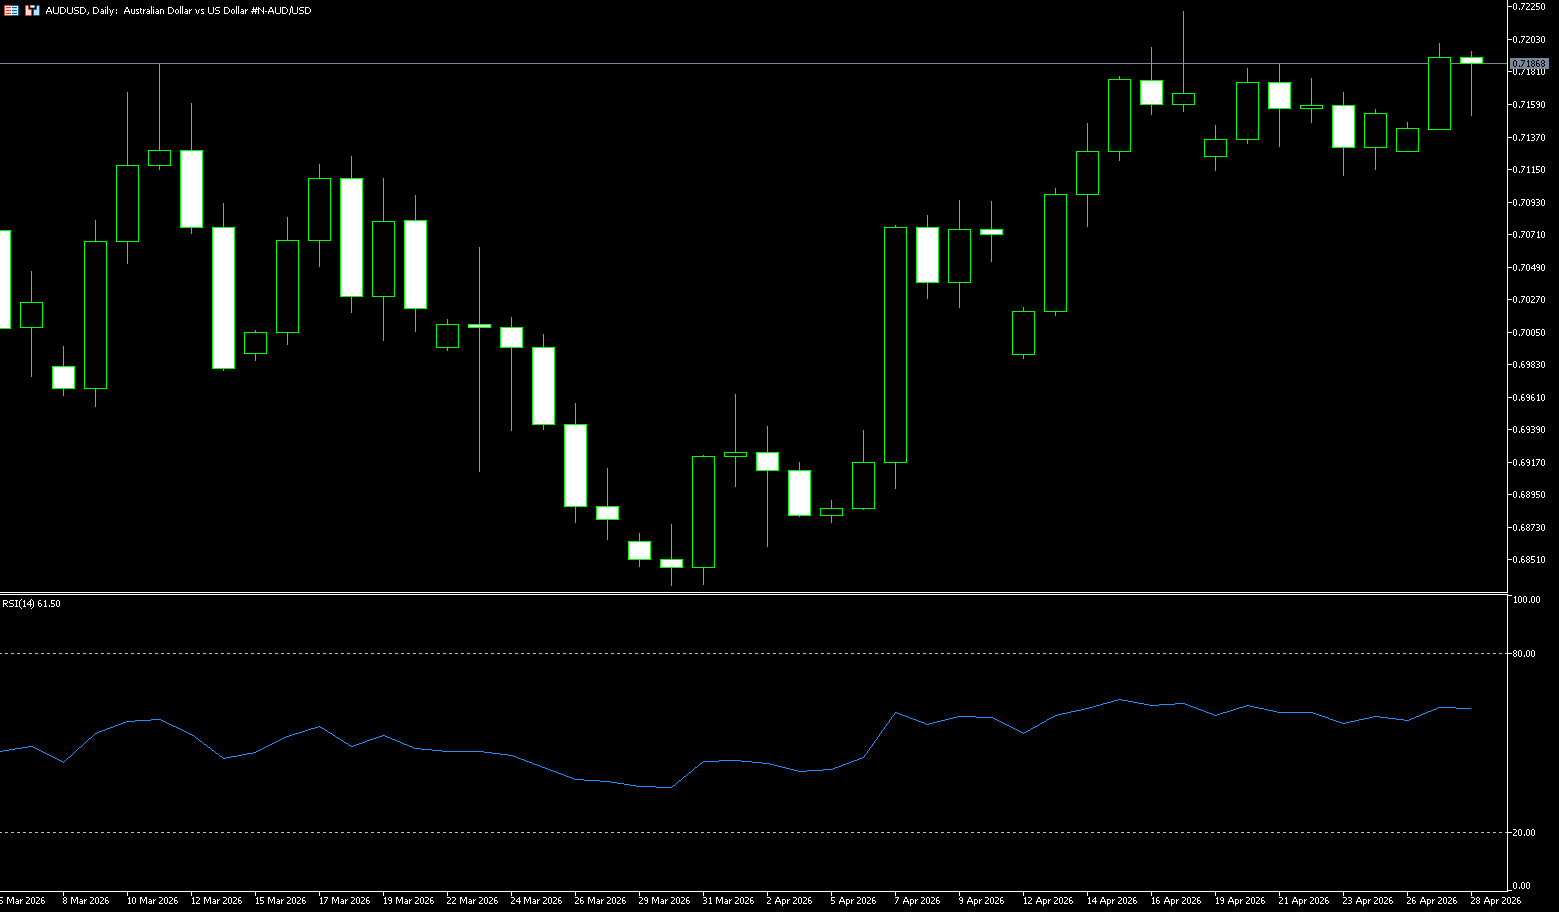
The Australian dollar remained above US$0.7180, reaching a four-year high, as soaring energy prices strengthened expectations of an interest rate hike ahead of upcoming inflation data. Although the ceasefire has largely held since early April, efforts to resume peace talks between the US and Iran remain uncertain, and energy flows through the Strait of Hormuz remain restricted. The resulting energy supply shock continues to drive inflation risks, reinforcing market expectations that the central bank will maintain higher interest rates for a longer period or raise rates further. In Australia, investors are awaiting the March Consumer Price Index report on Wednesday, which is expected to show overall inflation rising 4.7% year-on-year, well above the Reserve Bank of Australia's target of 2-3%. Any unexpected upside surprise could solidify market bets on a 25 basis point rate hike at the central bank's May 5 meeting. The market currently estimates an 80% probability of a third rate hike this year to 4.35%.
The Australian dollar accelerated its rebound against a weaker US dollar early in the week, reaching a 10-day high slightly above 0.7200 at the time of writing, after rebounding from a low near 0.7100 last week. News of a peace proposal from Tehran and expectations that high energy prices will push up inflation and force the Reserve Bank of Australia to raise interest rates next week continued to support the Australian dollar's strength. The Australian dollar's strong rebound since April appears to have intensified further in the past few days, with bulls regaining control and paving the way for AUD/USD to challenge the yearly high near 0.7200 in the short term. The continuation of the pair's strong rebound is attributed to a sharp sell-off in the US dollar. Resistance lies at the psychological level of 0.72000 and the April 17 high of 0.7222; a sustained break above these levels would reopen a more positive short-term outlook. The first support level is at the psychological level of 0.7300. The 0.7100 (psychological level) and 0.7142 (14-day moving average) constitute a more important medium-term demand zone, which will act as key support if sellers regain control.
Consider going long on the Australian dollar today at 0.7170, with a stop loss at 0.7160 and targets at 0.7230 and 0.7240.
GBP/USD
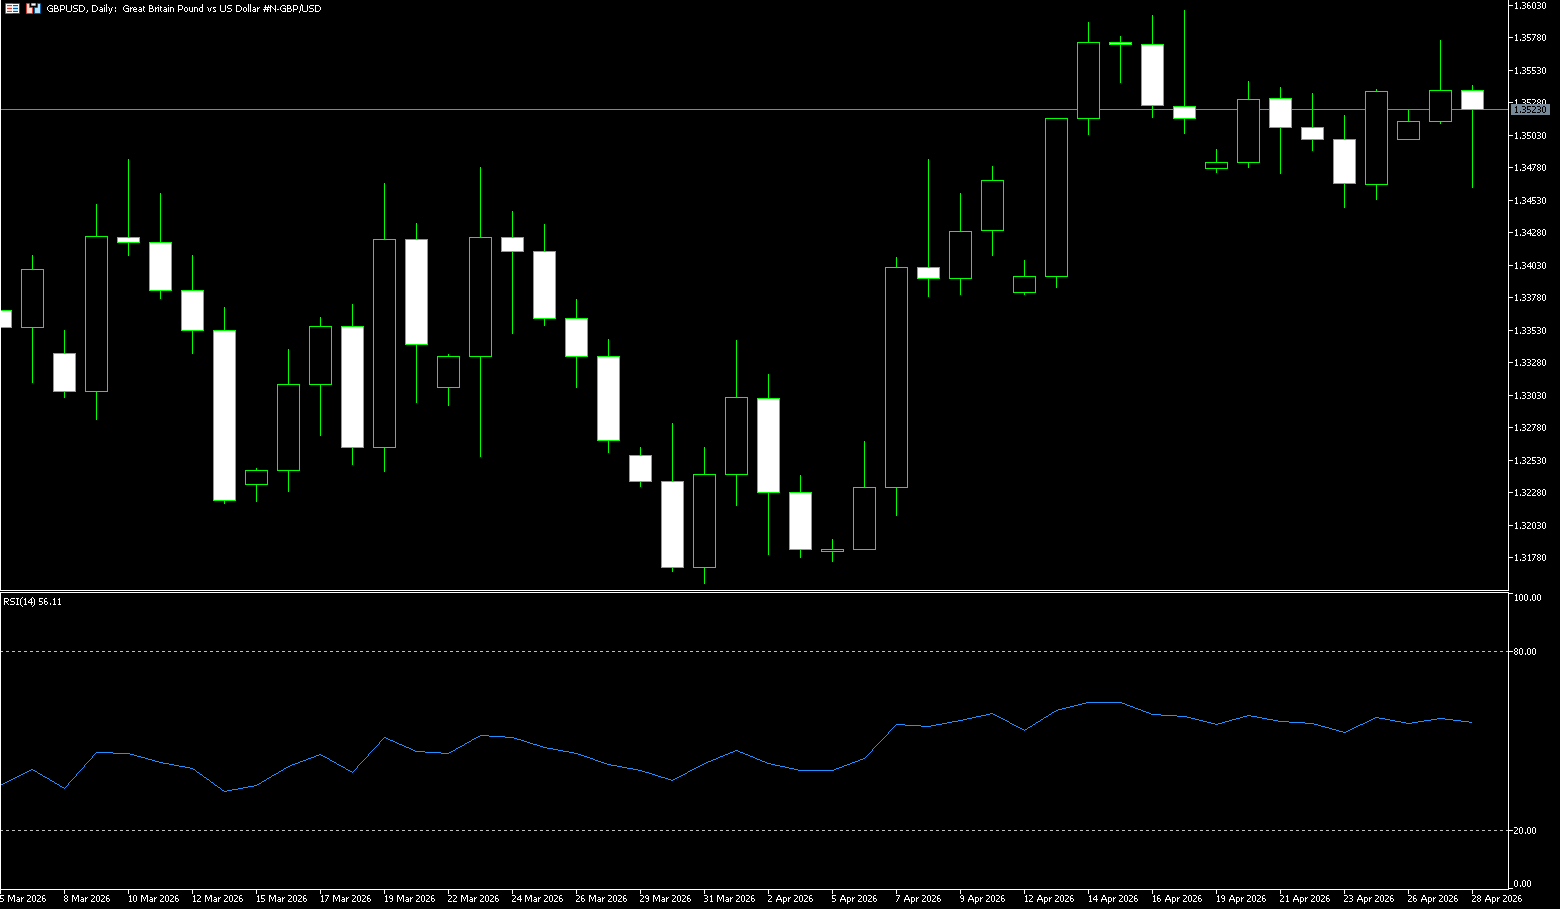
The British pound/US dollar continued to decline near 1.3500 during Tuesday's European trading session. The pound weakened against the dollar due to escalating tensions between the US and Iran, and upcoming policy announcements from the Federal Reserve and the Bank of England later this week, as traders turned to risk aversion. Investors await a week of intensive economic data and global interest rate decisions, while also focusing on the US-Iran peace talks. The Bank of England is expected to keep interest rates at 3.75% amid the Middle East crisis, with analysts anticipating a near-unanimous or strong majority vote to maintain the status quo. This follows last week's UK inflation report for March, which showed the Consumer Price Index (CPI) rose 3.3% year-on-year, primarily driven by soaring fuel prices, leading the market to expect at least two rate hikes this year, up from one to a possible third. Economic pressures are mounting as oil prices surge amid the ongoing blockade of the Strait of Hormuz and stalled US-Iran negotiations. Political uncertainty is also rising ahead of the May 7 local elections, with Prime Minister Keir Starmer facing criticism for appointing Peter Mandelson as US ambassador.
The pound/dollar pair is showing some resilience above the 100-period simple moving average (1.3465) on the 4-hour chart and has rebounded from near the 38.2% Fibonacci retracement level of its monthly gains. Meanwhile, the Relative Strength Index (RSI) is at 53.17, near the midline, while the Moving Average Convergence Divergence (MACD) indicator remains in negative territory with a flat histogram. This suggests limited upward momentum and keeps the short-term trend broadly neutral with a slight bearish bias. A clear break above the aforementioned resistance levels near the psychological level of 1.3600, and the area around 1.3672 (the February 12 high), and 1.3675 (the upper Bollinger Band), would alleviate immediate pressure. On the downside, initial support lies at the 100-period simple moving average of 1.3456, followed by the 38.2% Fibonacci retracement level at 1.3439, with deeper support at the psychological level of 1.3400.
Consider going long on GBP at 1.3506 today, with a stop-loss at 1.3500 and targets at 1.3570 and 1.3580.
USD/JPY
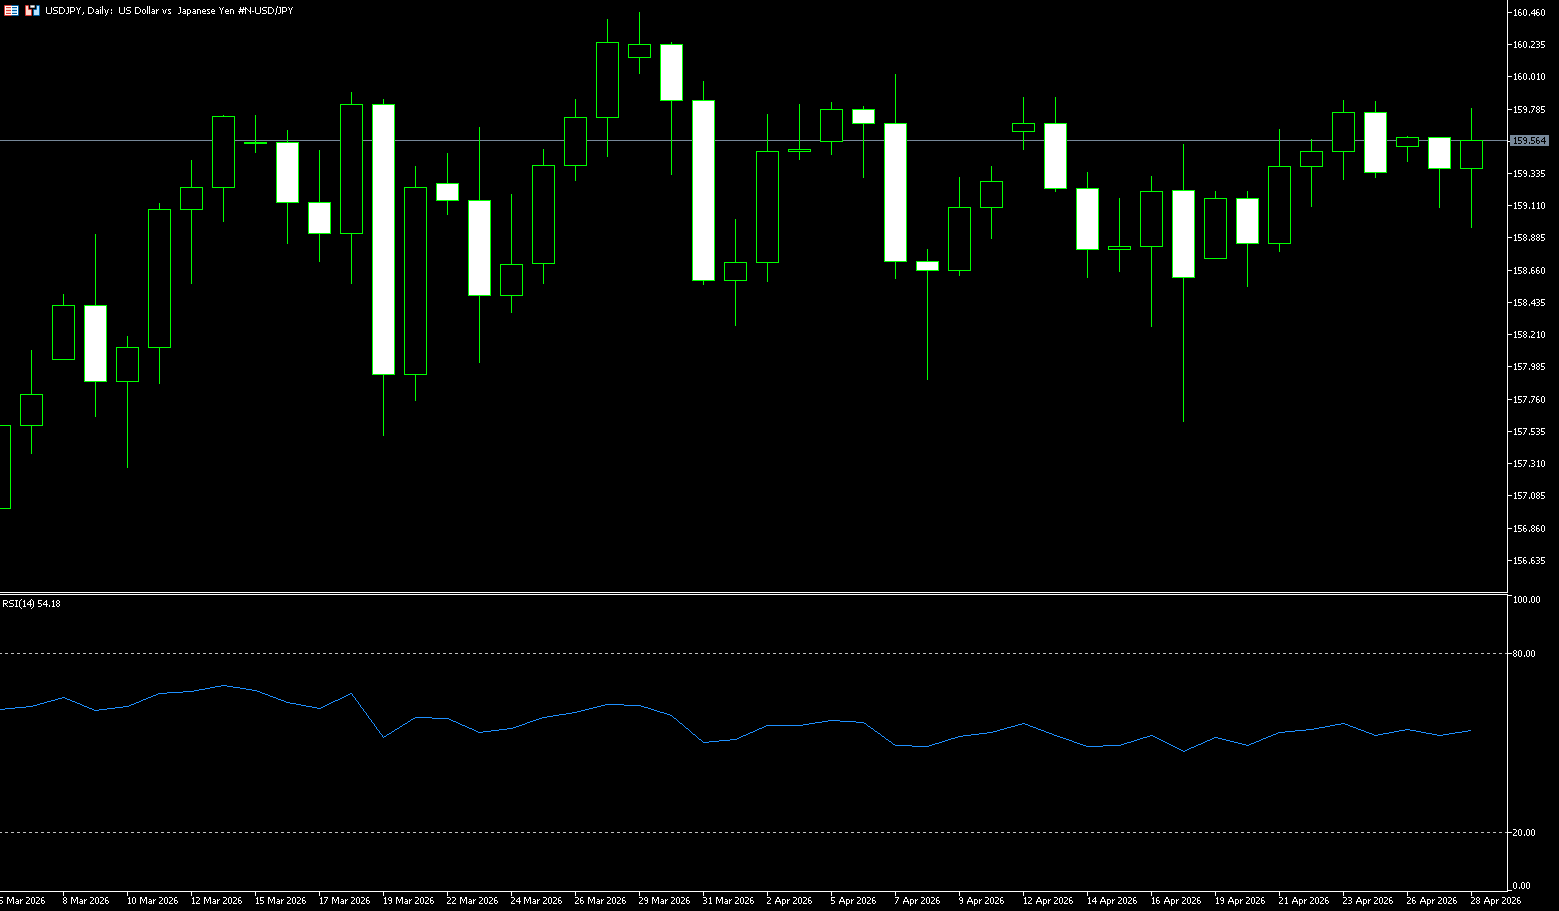
USD/JPY broke below its consolidation range, testing 159.60, as traders digested the Bank of Japan's decision to keep interest rates unchanged and raise inflation forecasts. Focus now shifts to Bank of Japan Governor Ueda's press conference for further trading momentum. The Bank of Japan previously kept its policy rate unchanged at 0.75% for the fourth consecutive meeting, in line with expectations. The central bank also raised its inflation outlook while lowering its growth forecast for fiscal year 2026, citing the economic impact of the Middle East conflict, which is expected to put pressure on corporate profits and suppress real household income. Bank of Japan Governor Kazuo Ueda remains in focus for reinforcing expectations of a gradual normalization path, which could provide support for the yen, which has been pressured by soaring oil prices. Further monetary weakness could increase the likelihood of policy tightening if import inflation accelerates through the exchange rate transmission effect. Finance Minister Katayama also reiterated the authorities' readiness to intervene in the currency market.
The USD/JPY pair fell to near 159.70 during the European session; however, the pair maintains a constructive bullish bias as the spot price remains above the 40-day simple moving average at 159.02. The currency pair is testing a breakout of a descending triangle pattern on the daily chart, near the downward sloping boundary around 159.20, which typically leads to a new uptrend. The 14-day Relative Strength Index (RSI) is near 52, suggesting neutral to slightly positive momentum rather than an overbought condition. On the downside, the reclaimed 159 level, coinciding closely with the 50-day simple moving average at 158.40, provides immediate support; a break below this level would expose the horizontal support boundary of the aforementioned chart pattern, around 157.60. On the upside, a hold above the downward sloping boundary could see the pair advance to 160.00. A break above 160.00 would open further upside potential, targeting the March 30 high of 160.46.
Today, consider shorting the US dollar at 159.78, with a stop loss at 159.95 and targets at 158.90 and 158.70.
EUR/USD
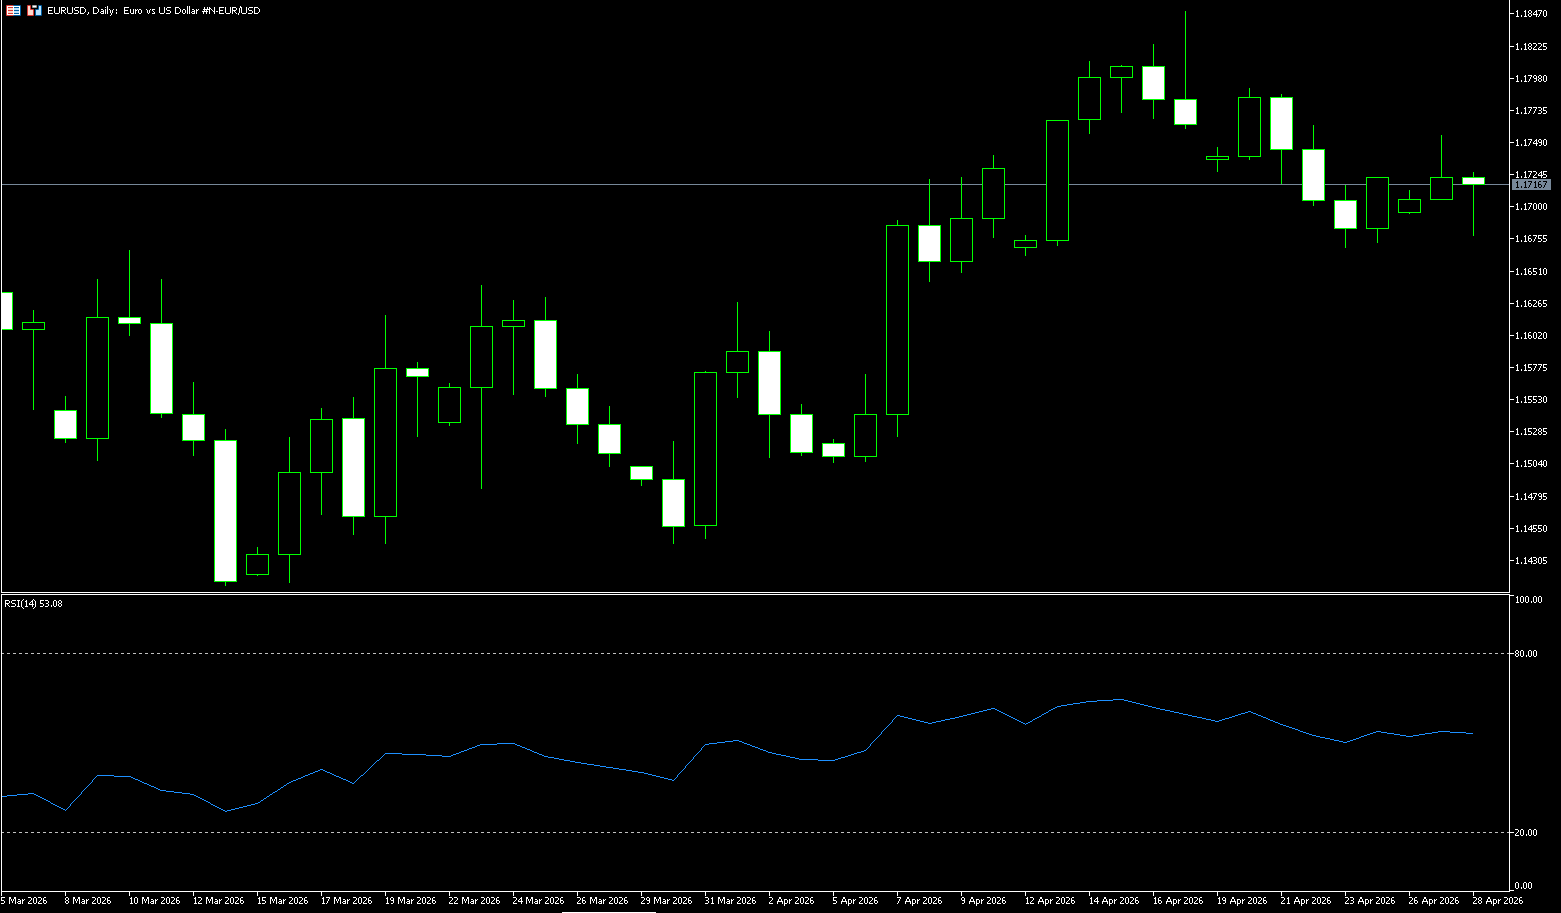
The EUR/USD pair continued its weakness during Tuesday's European session, testing below the 1.1700 level. Uncertainty surrounding the second round of US-Iran peace talks supported the safe-haven dollar, preventing the pair from rebounding, and market focus shifted to this week's key central bank meetings. Investors are awaiting a busy week of economic data releases, including Eurozone inflation and GDP figures, as well as global interest rate decisions. Eurozone inflation is expected to reach 2.9% in April, the highest level since December 2023, primarily driven by soaring energy prices related to the Middle East conflict. Meanwhile, the European Central Bank is likely to keep interest rates unchanged at its meeting on Thursday, adopting a wait-and-see approach in response to the evolving macroeconomic and geopolitical situation. The market still expects two 25-basis-point rate hikes in 2026, with a possible third hike by the end of the year. Meanwhile, reports indicate that Iran has submitted a new proposal to the United States aimed at reopening the Strait of Hormuz, following President Donald Trump's weekend announcement of the cancellation of a planned meeting between a US envoy and Iran in Pakistan.
The EUR/USD exchange rate holds a moderately bullish bias as it trades above its 200-day simple moving average (1.1676) and above the 38.2% Fibonacci retracement level of the recent rebound from the late March lows. However, momentum oscillators are showing mixed signals, suggesting that upward pressure is constructive but not impulsive. The MACD line is slightly positive and above its signal line. Nevertheless, the Relative Strength Index (RSI) has retreated to around 50. Initial resistance is located at 1.1762 (the April 22 high). A break above this level would target 1.1830, the late February high. Immediate support is seen at the 200-day simple moving average (SMA) at 1.1676, with further support at the 50.0% Fibonacci retracement level around 1.1643. If EUR/USD breaks decisively below the 200-day SMA, a deeper pullback target would be the 1.1600 level.
Consider going long on EUR/USD today at 1.1706, with a stop-loss at 1.1695 and targets at 1.1760 and 1.1770.
Disclaimer: The information contained herein (1) is proprietary to BCR and/or its content providers; (2) may not be copied or distributed; (3) is not warranted to be accurate, complete or timely; and, (4) does not constitute advice or a recommendation by BCR or its content providers in respect of the investment in financial instruments. Neither BCR or its content providers are responsible for any damages or losses arising from any use of this information. Past performance is no guarantee of future results.
Lebih Liputan


Pendedahan Risiko:Instrumen derivatif diniagakan di luar bursa dengan margin, yang bermakna ia membawa tahap risiko yang tinggi dan terdapat kemungkinan anda boleh kehilangan seluruh pelaburan anda. Produk-produk ini tidak sesuai untuk semua pelabur. Pastikan anda memahami sepenuhnya risiko dan pertimbangkan dengan teliti keadaan kewangan dan pengalaman dagangan anda sebelum berdagang. Cari nasihat kewangan bebas jika perlu sebelum membuka akaun dengan BCR.
BCR Co Pty Ltd (No. Syarikat 1975046) ialah syarikat yang diperbadankan di bawah undang-undang British Virgin Islands, dengan pejabat berdaftar di Trident Chambers, Wickham’s Cay 1, Road Town, Tortola, British Virgin Islands, dan dilesenkan serta dikawal selia oleh Suruhanjaya Perkhidmatan Kewangan British Virgin Islands di bawah Lesen No. SIBA/L/19/1122.
Open Bridge Limited (No. Syarikat 16701394) ialah syarikat yang diperbadankan di bawah Akta Syarikat 2006 dan berdaftar di England dan Wales, dengan alamat berdaftar di Kemp House, 160 City Road, London, City Road, London, England, EC1V 2NX. Entiti ini bertindak semata-mata sebagai pemproses pembayaran dan tidak menyediakan sebarang perkhidmatan perdagangan atau pelaburan.

 English
 简体中文
简体中文
 繁體中文
繁體中文
 Bahasa
Melayu
Bahasa
Melayu
 Tiếng
Việt
Tiếng
Việt
 ไทย
ไทย
 日本語
日本語
 한국어
한국어
 ភាសាខ្មែរ
 español