


0
US Dollar Index
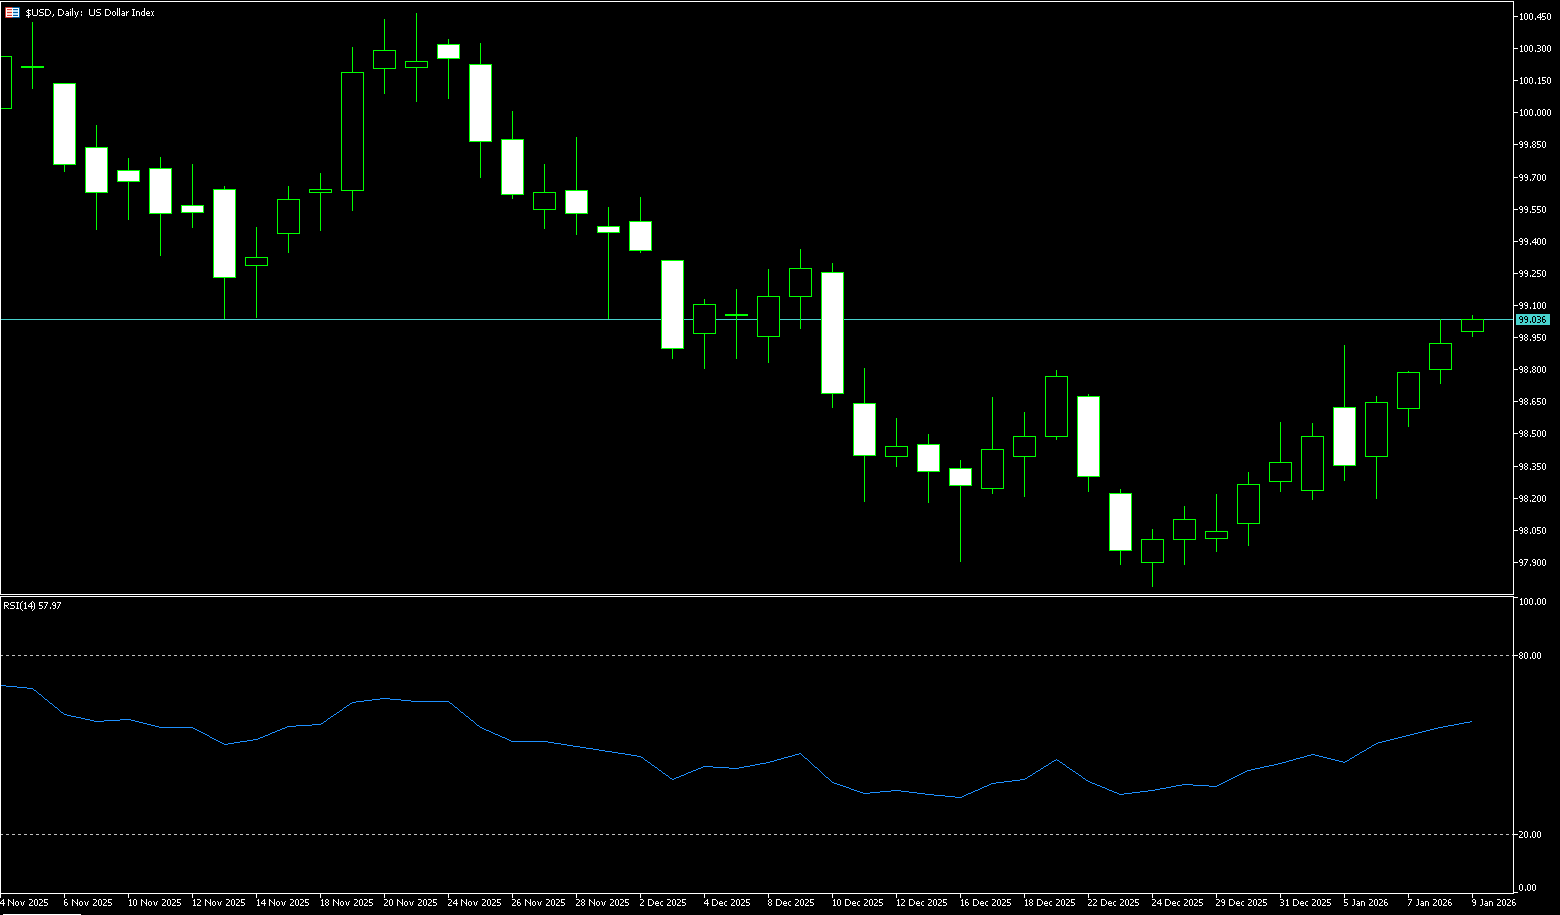
The US dollar index continued its decline for the second consecutive day. During Tuesday's European session, it traded around 98.26, a near two-week low. The dollar weakened as risk aversion rose amid escalating tensions between the US and the European Union. Investors turned to safe-haven currencies such as the Swiss franc, triggering widespread safe-haven trading. On the other hand, this expectation gap could be corrected if subsequent data continues to show strong economic resilience. Short-term US Treasury yields tend to rise whenever the market begins to question whether two rate cuts were too many, thus supporting the dollar. Meanwhile, a combination of "good US economic growth and strong inflation" would actually reduce the need for aggressive easing, thereby strengthening the dollar's relative advantage. On the other hand, the dollar's upside potential may be limited as strong US labor market data pushes expectations for further Fed rate cuts to June.
On the daily chart, the bullish momentum of the US dollar index continues to weaken, with both the Relative Strength Index (RSI) and the Stochastic Oscillator (KDJ) trending lower. The previous bearish divergence in the Stochastic Oscillator indicated a stall in the current rebound, and multiple signals still point to medium- to long-term pressure on the dollar. Furthermore, the dollar index has broken below the 99.00 support level and remains under pressure in the short term. To completely reverse the weak trend, it needs to break through the resistance level to 99.57 (the high of December 2nd last year). A successful break above this level could lead to a steady advance towards the 100 psychological level. Conversely, if the dollar index remains below the key 200-day simple moving average level of 98.71, there is still a possibility of further declines to 98.14 (this year's low), with further support at 98.00 (a psychological level).
Today, consider shorting the US Dollar Index around 98.70; Stop loss: 98.80; Target: 98.30; 98.20
WTI Crude Oil
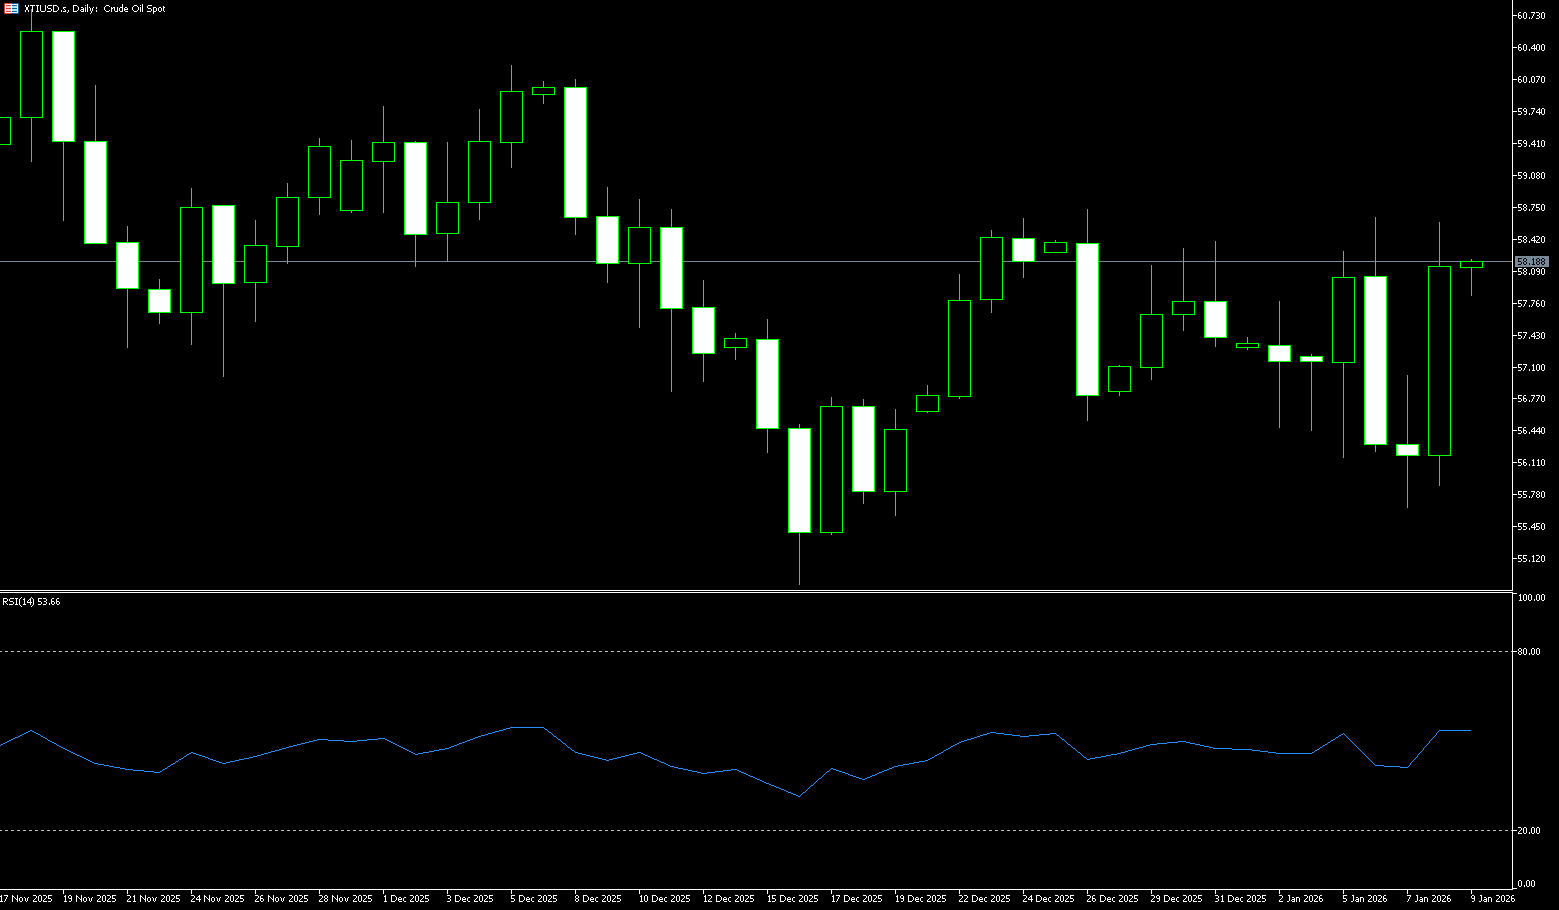
US crude oil is trading around $59.40 per barrel. Oil prices were relatively stable at the beginning of the week. The easing of unrest in Iran reduced the risk of a US military strike against this major oil producer and disrupting its supply. Market focus then shifted to the potential impact on demand from the US-EU trade tensions. On one hand, geopolitical risks have shifted. Iran quelled the protests through a crackdown, and US President Trump appeared to have withdrawn his previous threats of intervention, eliminating some of the supply risk premium supporting oil prices. On the other hand, a new focus has emerged. Market attention has turned to the escalating US-EU relations due to the Greenland sovereignty dispute. Trump threatened to impose tariffs on several European countries, while the EU stated it was prepared to retaliate and planned an emergency summit. Analysts point out that any escalation of the trade war could damage the outlook for oil demand. Furthermore, colder weather is expected in the Northern Hemisphere, exacerbating market concerns about tight distillate fuel supplies and providing some support for oil prices.
From a daily chart perspective, WTI crude oil has formed a clear resistance zone around the $60 mark. Last week, oil prices briefly broke through but quickly fell back, closing with a large bearish candle, indicating that the rebound was more of a technical correction than a trend reversal. Short-term moving averages have shown signs of weakening; the 5-day moving average has turned downwards and is approaching crossing below the 10-day moving average, while the 200-day moving average (at $61.96) remains above $60, providing dynamic resistance. The overall moving average system is gradually transitioning from a tangled state to a bearish alignment, reflecting a downward shift in the market's center of gravity. Based on chart pattern analysis, the area around $58.30 (20-day moving average) is a key short-term support level. A decisive break below this level could lead to further testing of the previous lows at $57.40 or even $56.50. Meanwhile, the $60.00-$60.50 range has become a key resistance level. Only a sustained break above this area accompanied by increased trading volume could potentially strengthen the short-term trend towards the 00-day moving average at $61.96.
Today, consider going long on crude oil around $59.25; Stop-loss: $59.10; Target: $60.50; $60.60
Spot Gold
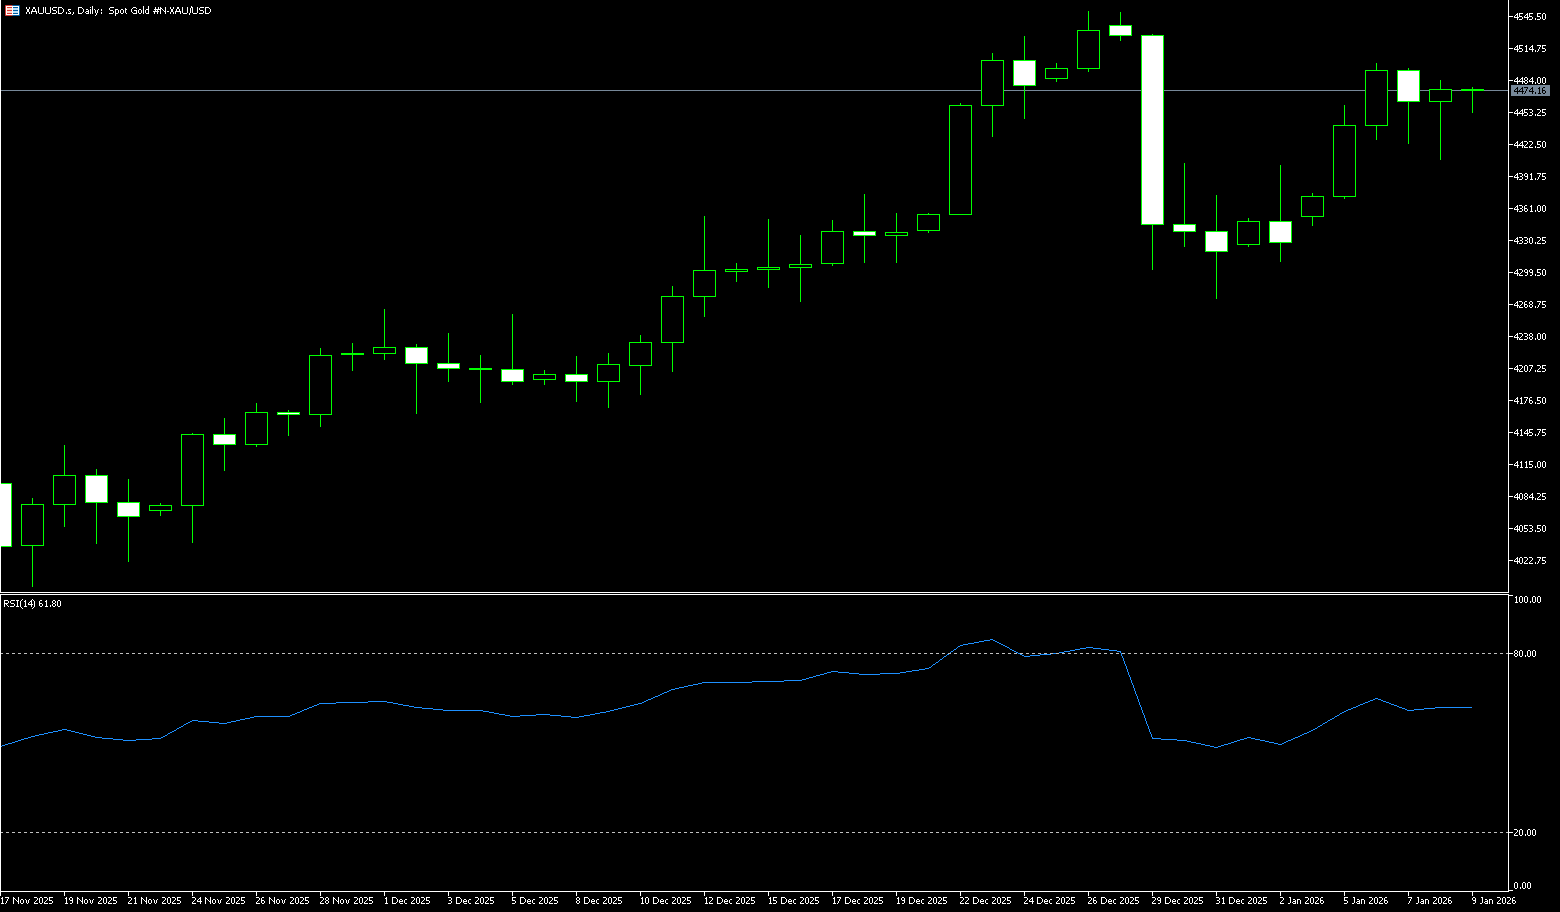
Gold continued its upward trend on Tuesday, reaching a new all-time high above $4766, driven by safe-haven demand fueled by escalating trade tensions between the US and the EU over Greenland's status. Precious metals received support as demand for safe-haven assets increased. Concerns about Trump's unstable trade policies have caused the dollar index to fall by more than 0.8% in the past two days, while the yield on the 10-year US Treasury bond rebounded to its highest level since September in a "sell America" trade similar to April's "Liberation Day." The current situation provides multiple positive supports for gold. First, escalating direct geopolitical risks, especially disputes involving the US and its traditional core allies, will drive safe-haven funds into gold. Second, global "populist" policy levels are at historically high levels. According to well-known institutions, this is typically accompanied by a macroeconomic environment of slower economic growth, rising inflation, and reduced trade openness over the next 10 to 15 years, fundamentally benefiting non-credit assets like gold.
Gold continued its rise on Tuesday, reaching a new all-time high above $4,766. Although the upward movement since the mid-October lows has been excessive, showing bearish divergence, there are no signs of a trend reversal in the 14-day Relative Strength Index (RSI) on the daily chart. The 5-day simple moving average at $4,646 continues to rise, supporting a bullish scenario. The Moving Average Convergence/Divergence (MACD) line is above the signal line and above zero, and the histogram is widening, indicating strengthening bullish momentum. The Relative Strength Index (RSI) is at 73, indicating overbought conditions. On the upside, the pair is likely to find resistance at the 161.8% Fibonacci extension of the January 8-12 rally, around $4770, followed by the psychological level of $4800. The ultimate target is the $5000 mark. A break below $4700 could find support around the $4646 (5-day simple moving average) area, followed by the psychological low of $4600.
Consider going long on gold around 4,758 today; Stop loss: 4,754; Target: 4,790; 4,800
AUD/USD
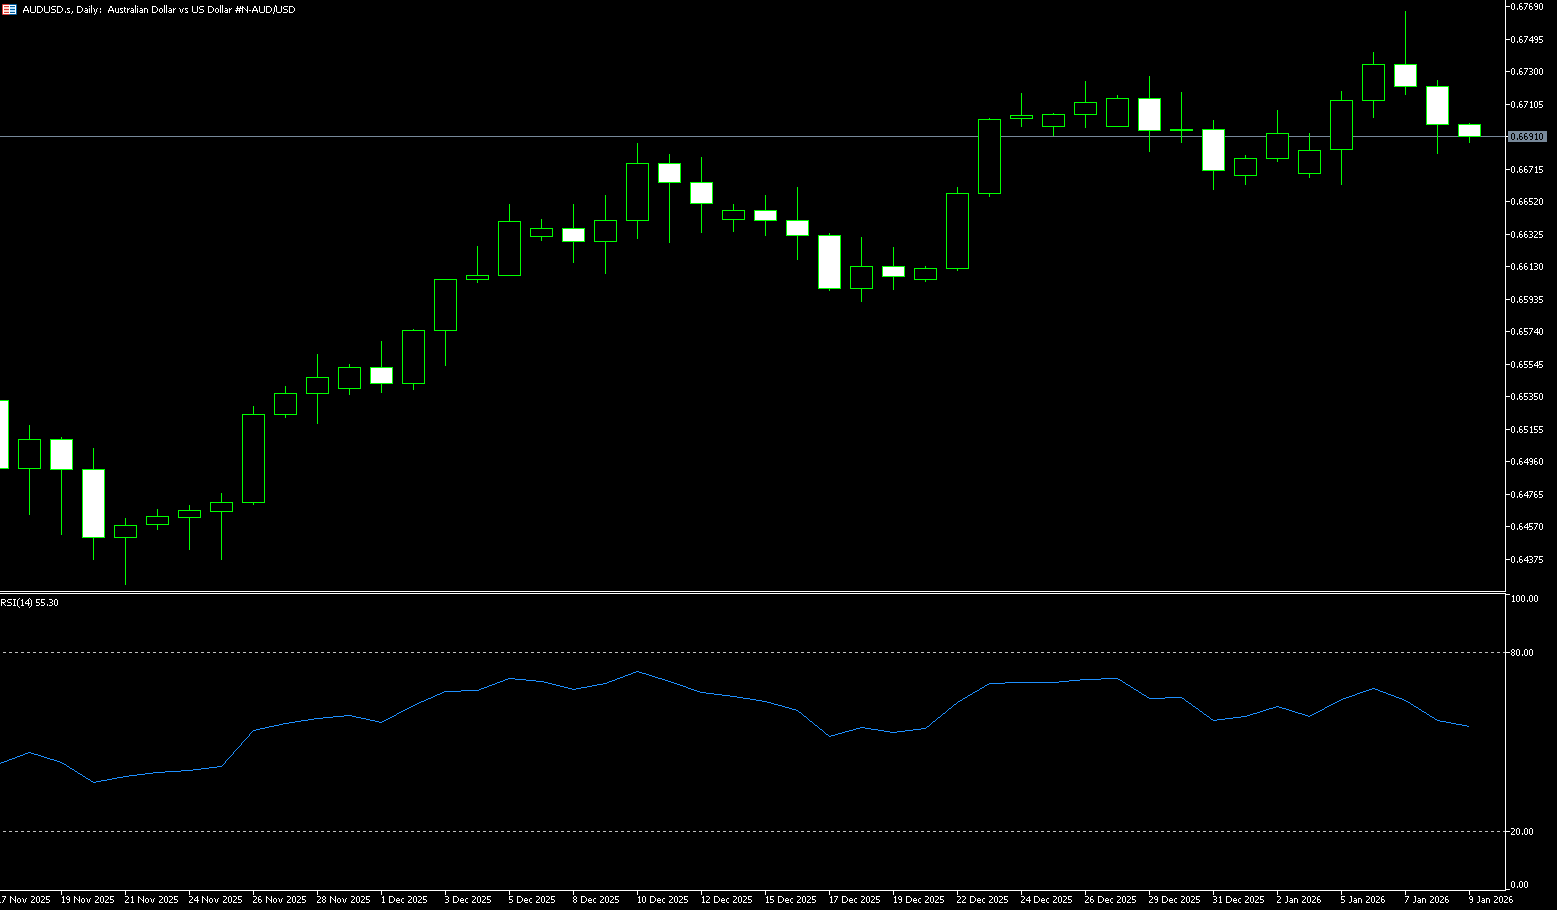
The Australian dollar broke strongly above US$0.67 on Tuesday, reaching a two-week high of 0.6747, supported by a weaker US dollar. The US dollar continued to be pressured after President Trump threatened to impose an additional 10% tariff on goods from eight European countries starting February 1. Strengthening expectations of interest rate hikes also reinforced the currency's appreciation. Meanwhile, Trump's tariff threats continued to affect investor sentiment, prompting some safe-haven funds to flow into the US dollar, creating resistance for the risk-sensitive Australian dollar. However, the Reserve Bank of Australia's hawkish stance should limit the downside for the Australian dollar. Among commodity currencies, the RBA is one of the few major central banks still discussing the possibility of interest rate hikes, allowing the Australian dollar to move independently over the past two months. Since November 21, the Australian dollar has maintained an upward structure against the US dollar, reflecting a market reassessment of its monetary policy outlook. This divergence in policy expectations from the Federal Reserve has become the core driving force supporting the Australian dollar.
On Tuesday, the Australian dollar/US dollar pair traded around 0.6730, having earlier risen to a two-week high of 0.6747. Daily chart analysis suggests the pair is consolidating around the 20-day simple moving average (SMA) at 0.6702, pointing to a neutral short-term bias. Meanwhile, the 14-day Relative Strength Index (RSI) is at 60.70, still above its midpoint, reinforcing potential upward momentum. The AUD/USD exchange rate remains above the 20-day SMA at 0.6702, maintaining a bullish bias and supporting a target of 0.6766, the highest level since October 2024. A break above this level would target the psychological level of 0.6800. A daily close below the short-term 20-day SMA could see initial support at 0.6659 (December 31st) and 0.6667 (last week's low). Deeper losses could extend to 0.6414, the lowest level since June 2025.
Consider going long on the Australian dollar around 0.6723 today; Stop loss: 0.6710; Target: 0.6770; 0.6780
GBP/USD
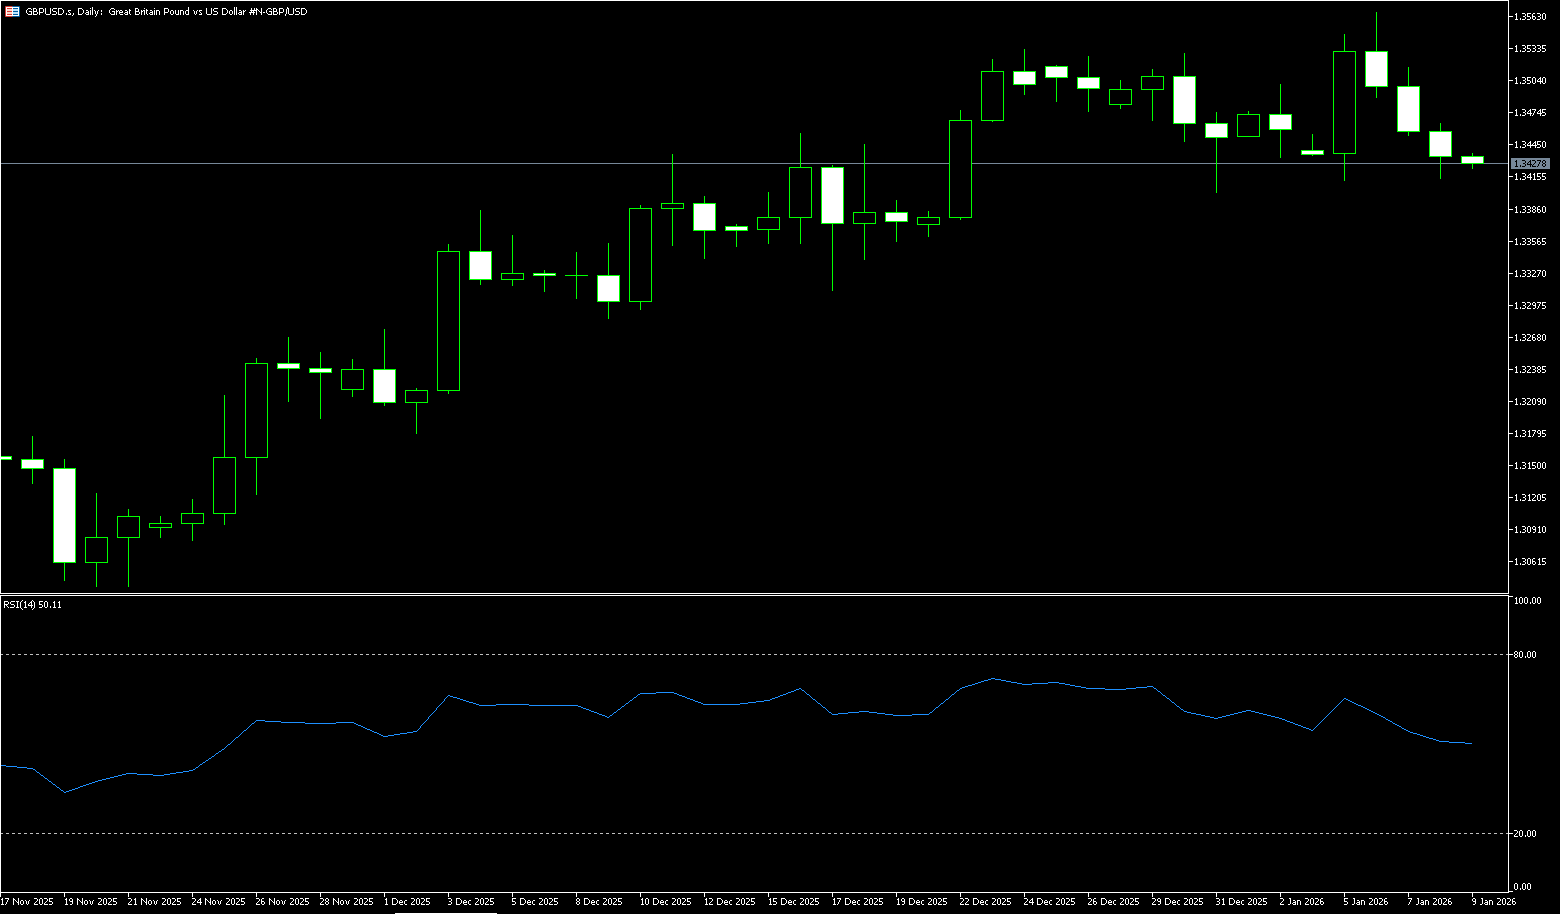
GBP/USD reversed its earlier pullback and successfully gained strong upward momentum on Monday, climbing to a near one-week high of 1.3490. The pound's sharp rebound was due to renewed selling interest impacting the dollar, driven by renewed tariff tensions. In contrast, the situation in the UK is slightly more complex. The Bank of England cut interest rates by 25 basis points to 3.75% at its year-end 2025 meeting, the lowest level in nearly three years, with a 5-4 vote indicating significant internal divisions on further easing. Its latest statement emphasized that "the easy part of the rate-cutting cycle is over," and every step forward will require stronger evidence, especially a significant slowdown in wage growth and a sustained decline in inflation. The UK will see a series of key data releases: CPI and PPI on Wednesday, and December retail sales and preliminary January PMI figures on Friday. If these data collectively point to cooling inflation and easing wage pressures, it will put downward pressure on the pound.
The early bullish rebound at the start of the week provided new support for GBP/USD near the 45-day simple moving average of 1.3366, but the overall price action remains bearish. Since failing to break through 1.3550 in early January, GBP/USD has been slowly declining. The daily chart's stochastic oscillator still indicates some downside potential, while the 14-day Relative Strength Index (RSI) remained in the neutral range of 56.40, indicating a balance between bulls and bears. A daily close below 1.3400 would pave the way for a challenge of the 45-day simple moving average at 1.3366, the new year's low of 1.3344, and then the psychological level of 1.3300. Conversely, if GBP/USD stays above 1.3400 and 1.3427 (the 34-day simple moving average), the next target is 1.3500, and a break above that would point to 1.3567 (the January 6 high).
Consider going long on GBP today around 1.3430; Stop loss: 1.3418; Targets: 1.3460; 1.3470
USD/JPY
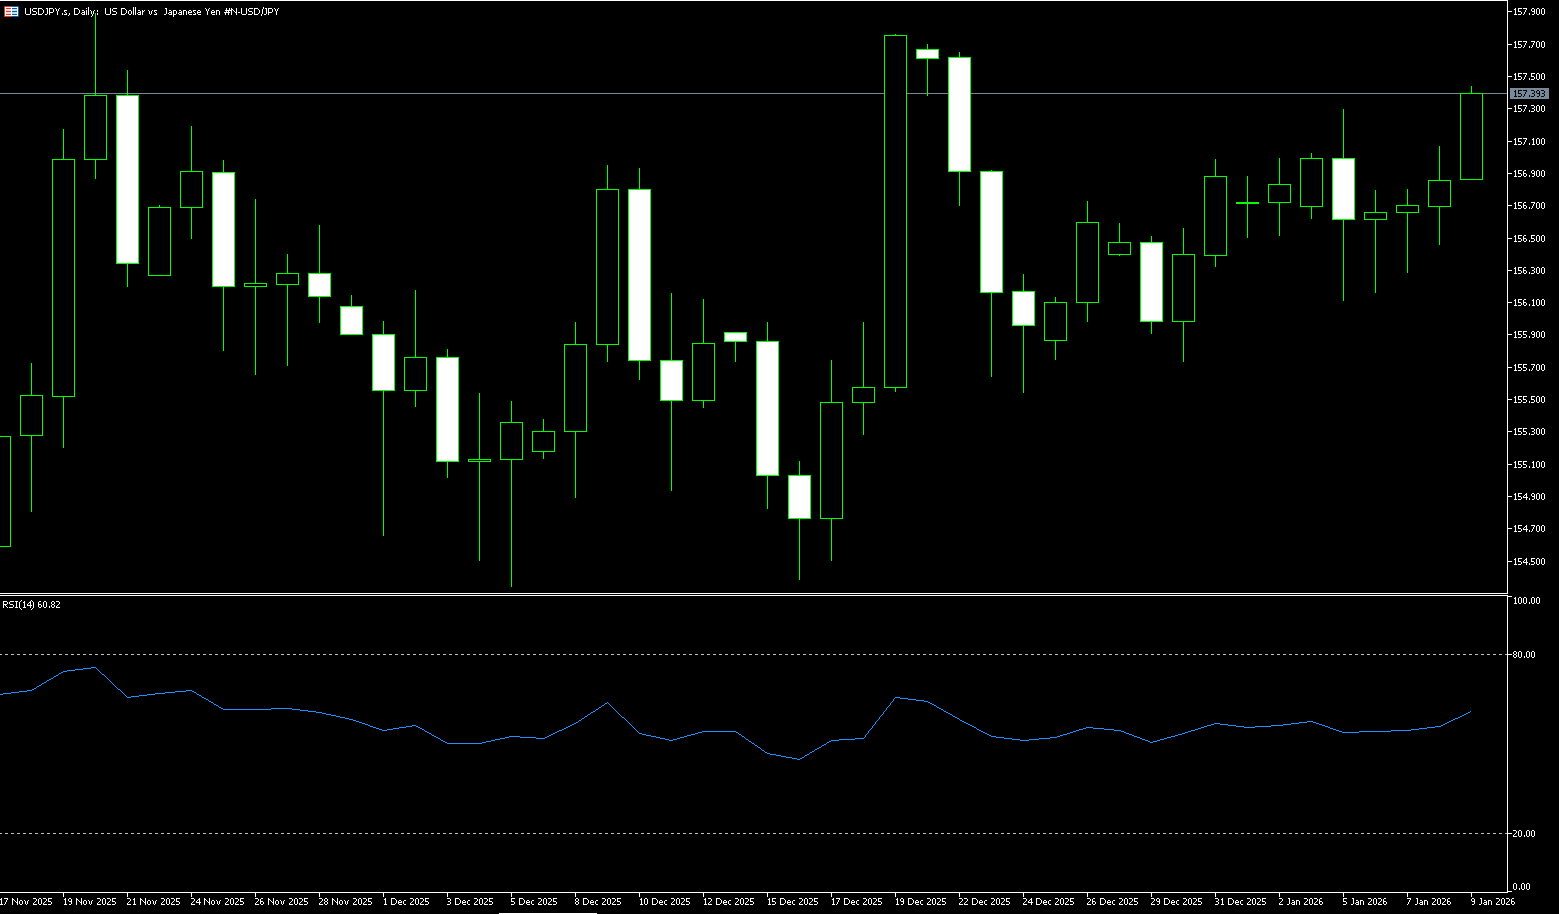
USD/JPY remained stable around 158.10 during Tuesday's trading session. The pair held steady as safe-haven inflows offset speculation that Prime Minister Sanae Takashi might call a snap election soon. The Bank of Japan will announce its first policy decision of 2026 on Friday. Despite the bank's decisive 25 basis point rate hike in December, pushing rates to a near 30-year high and expressing a willingness to continue tightening, recent political turmoil in Japan—with escalating rumors of an early election—has put significant pressure on the yen. Overnight index swaps currently indicate that the next rate hike is more likely in July than the previously anticipated spring. The continued depreciation of the yen has also sparked speculation about central bank intervention, with the Finance Minister issuing multiple warnings. However, historical experience suggests that verbal intervention or buying yen in the market alone can only produce short-term effects.
The USD/JPY pair traded in a narrow range around 158.10 at the start of the week. A break above 158 could pave the way for further gains, although a stronger rebound would require additional momentum confirmation. The MACD is hovering below zero, with readings approaching -0.01, indicating weakening bearish pressure. The 14-day Relative Strength Index (RSI) is at 56 (neutral to bearish), stabilizing after a previous oversold decline. Meanwhile, the USD/JPY pair is trading below its 5-day simple moving average around the 158.47 area, which should limit any rebound. A close above this moving average would skew the short-term trend towards 149.45 (last week's high), with a break above that targeting the 160 (psychological level). On the downside, 157 is the first support level, followed by strong second support at the 50-day simple moving average of 156.42. A break above that would target the 155.00 (psychological level) area.
Consider shorting the USD today around 158.35; Stop loss: 158.52; Target: 157.50; 157.40
EUR/USD
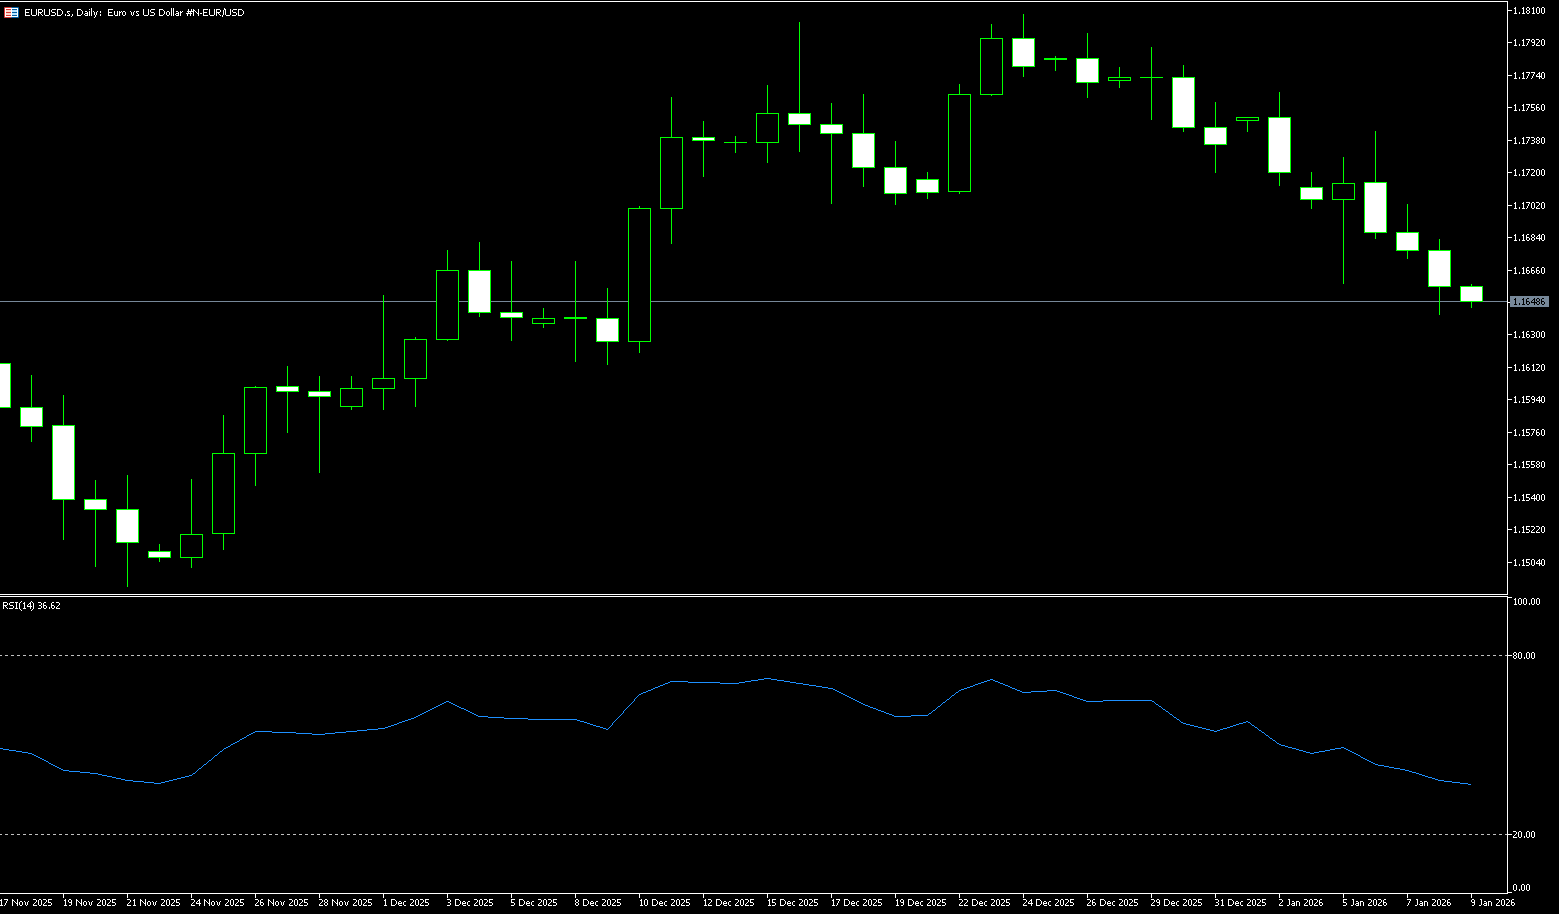
The EUR/USD has risen more than 1% over the past two days, trading at 1.1720 at the time of writing, as the dollar weakened across the board. US President Donald Trump's threat of additional tariffs on European countries triggered a "sell America" trade similar to that seen after Liberation Day in April. The euro/dollar has recovered part of its recent sharp pullback. Meanwhile, investors continue to assess President Trump's recent threats of new tariffs on several EU countries. The euro/dollar pair will be in focus. However, with Europe showing unexpectedly united resistance (such as suspending the ratification of the EU-US trade agreement) and rising domestic opposition in the US, market logic may shift towards a "sell the news" scenario or concerns about a weakening of the dollar's hegemony. The euro holding key psychological levels suggests short-term rebound potential. The dollar's trajectory is caught in a dilemma: its traditional safe-haven appeal may provide support, but the prospect of the US actively undermining alliances, escalating congressional political infighting, and potential trade damage constitutes a fundamental downside.
At the start of the week, the euro/dollar surged as the trade war between Trump and the EU diminished the dollar's safe-haven appeal. The pair rebounded from its 200-day simple moving average at 1.1587, gaining over 150 pips to 1.1730, poised to break through the next key resistance level. From a momentum perspective, the 14-day Relative Strength Index (RSI) is near 58, indicating that buyers are accumulating some strength. A break above the 60 level would confirm bullish dominance and position EUR/USD for further gains. The first key resistance level is the year's high of 1.1765, followed by the psychological level of 1.1800. For the bearish scenario to gain momentum, a break below the 50-day simple moving average at 1.1665 would be crucial. A break below this level would target the November low of 1.1632 (Tuesday's low), followed by 1.1600 (the psychological level).
Consider going long on EUR/USD today around 1.1713; Stop loss: 1.1700; Target: 1.1760; 1.1770
Disclaimer: The information contained herein (1) is proprietary to BCR and/or its content providers; (2) may not be copied or distributed; (3) is not warranted to be accurate, complete or timely; and, (4) does not constitute advice or a recommendation by BCR or its content providers in respect of the investment in financial instruments. Neither BCR or its content providers are responsible for any damages or losses arising from any use of this information. Past performance is no guarantee of future results.
More Coverage


Risk Disclosure:Derivatives are traded over-the-counter on margin, which means they carry a high level of risk and there is a possibility you could lose all of your investment. These products are not suitable for all investors. Please ensure you fully understand the risks and carefully consider your financial situation and trading experience before trading. Seek independent financial advice if necessary before opening an account with BCR.
BCR Co Pty Ltd (Company No. 1975046) is a company incorporated under the laws of the British Virgin Islands, with its registered office at Trident Chambers, Wickham’s Cay 1, Road Town, Tortola, British Virgin Islands, and is licensed and regulated by the British Virgin Islands Financial Services Commission under License No. SIBA/L/19/1122.
Open Bridge Limited (Company No. 16701394) is a company incorporated under the Companies Act 2006 and registered in England and Wales, with its registered address at Kemp House, 160 City Road, London, City Road, London, England, EC1V 2NX. This entity acts solely as a payment processor and does not provide any trading or investment services.

 English
 简体中文
简体中文
 繁體中文
繁體中文
 Bahasa
Melayu
Bahasa
Melayu
 Tiếng
Việt
Tiếng
Việt
 ไทย
ไทย
 日本語
日本語
 한국어
한국어
 ភាសាខ្មែរ
 español