


0
US Dollar Index
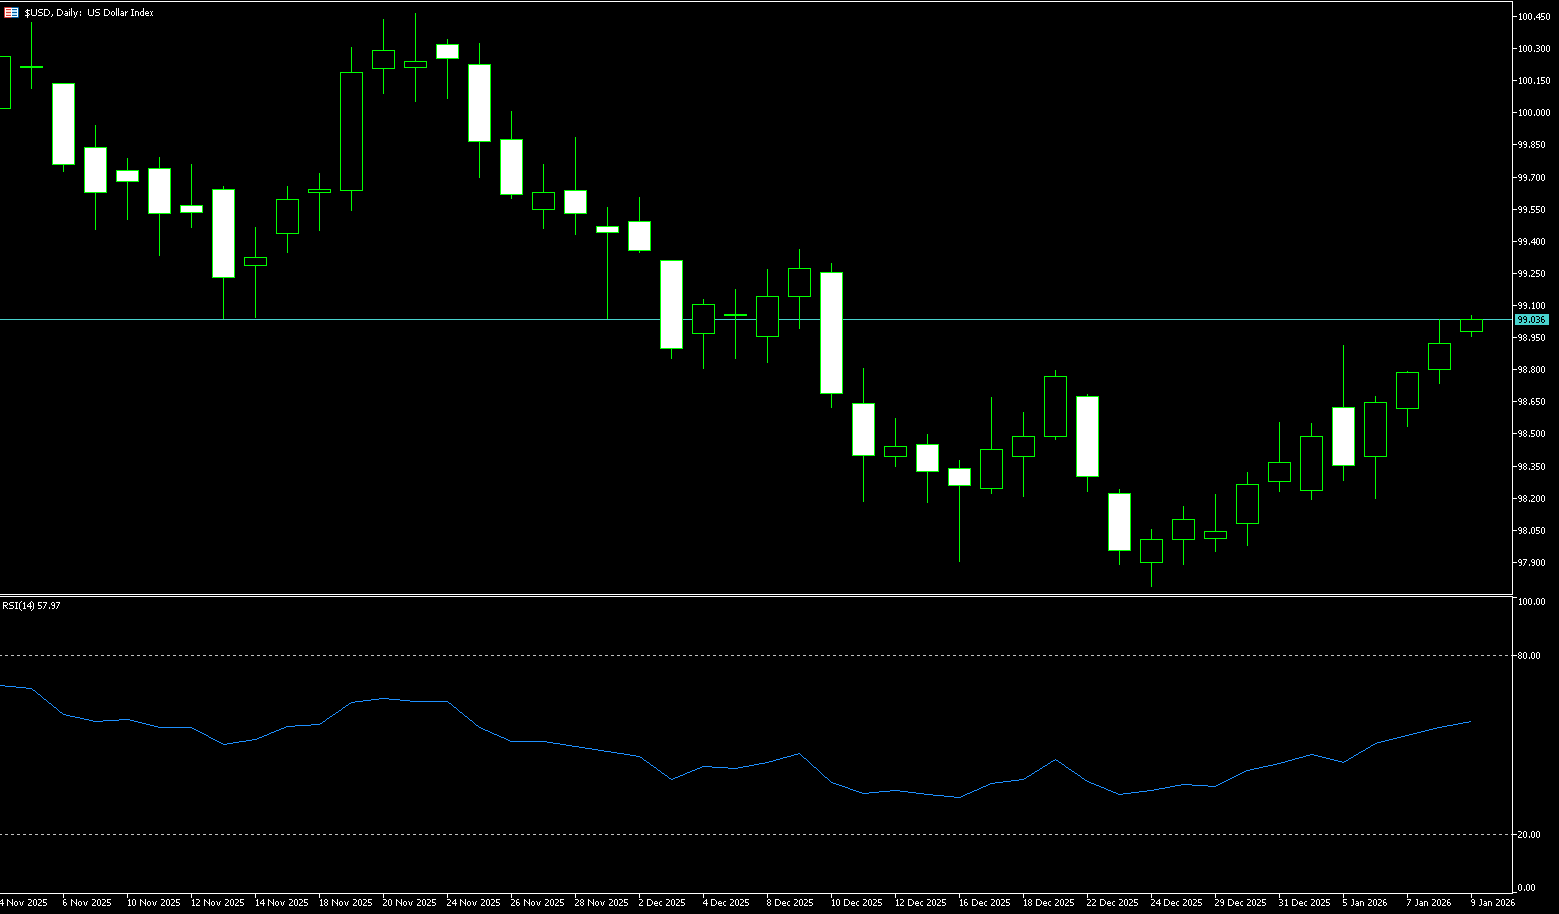
The US dollar recorded its biggest one-day drop in over a month on Tuesday as threats from the White House regarding Greenland's future in Europe triggered market concerns, causing US stocks, Treasuries, and the dollar to fall together, repeating the "sell-off in America" trading pattern seen last April. The dollar index fell as much as 0.7% to 98.26, its biggest drop since mid-December. Investors sold dollar assets due to concerns about exposure in the US market. The sell-off stemmed from concerns about long-term uncertainty, strained alliances, declining confidence in US leadership, potential retaliatory measures, and accelerated de-dollarization. He added that while the market hopes the US government will de-escalate threats as it has in the past, securing Greenland remains a core national security objective.
The current support zone for the dollar index is very clear, with the core support zone falling between 98.14 (this year's low) and 98.00 (psychological level), which highly coincides with recent pullback lows, indicating strong technical support. If this range is breached, the next support level will be around the previous important low of 97.75, which is also a temporary bottom in the long-term downtrend. From a resistance perspective, the most direct strong resistance zone is located at the double resistance area of 99.00 (the psychological level) and 99.02 (the 9-day simple moving average), while the previous high of 99.49 in this rebound is the ultimate target that the bulls need to challenge.
Today, consider shorting the US Dollar Index around 98.87; Stop loss: 98.98; Target: 98.40; 98.35
WTI Crude Oil
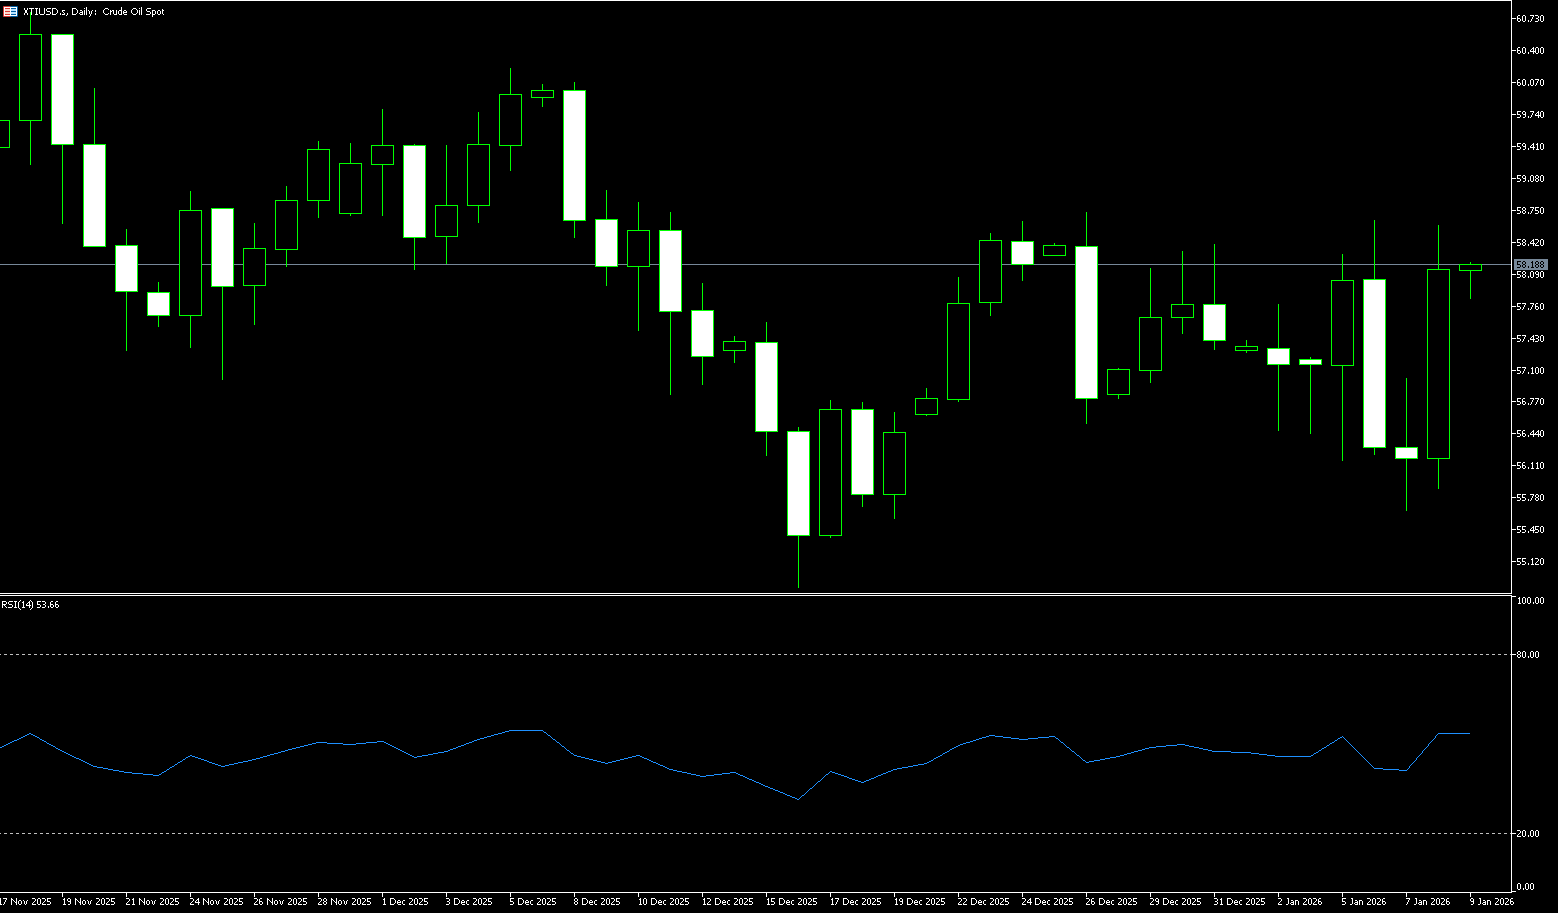
WTI crude oil rebounded to around $60.60 per barrel on Wednesday after President Trump stated that the US wanted to control Greenland through negotiations and would not use force, easing immediate geopolitical concerns. Earlier, the benchmark crude oil price fell by about 1.5% due to concerns about trade tensions and weak global demand fueled by Trump's renewed push for Greenland and new tariff threats against Europe. Market sentiment improved following his speech in Davos, despite persistent tensions between the US and Europe and the stalled trade agreement due to the European Parliament's freeze on its ratification vote. Prices were also supported after the International Energy Agency (IEA) raised its 2026 global oil demand growth forecast and slightly lowered its supply glut expectation, although a substantial surplus is still anticipated. The IEA stated that inventories could increase by 3.7 million barrels per day this year, continuing to put downward pressure on prices.
The daily candlestick chart shows that prices retreated after reaching a high of $62.19, consolidating around $60.00. Two key levels are clearly visible in the chart: The area around $61.23 (the high of January 13th) forms a short-term resistance zone, while the $62.19 level (the high of January 14th) was previously a significant resistance level, representing a resistance zone where the previous high and psychological threshold overlap. Below, $58.38 (the 20-day moving average) forms a phased support level. If this level is effectively broken, the next target is $57.50 (the low of January 9th), potentially signaling a reconfirmation of a downtrend from consolidation. In terms of indicators, the MACD shows that medium-term momentum remains bullish, but the "rise and fall" indicates a digestion phase after the release of momentum. The RSI (14) reading is in the neutral-to-strong range, neither overbought nor oversold, consistent with the typical characteristic of "a trend that has moved from upward to consolidation."
Today, consider going long on crude oil around 60.48; Stop loss: 60.30; Target: 61.50; 61.60
Spot Gold
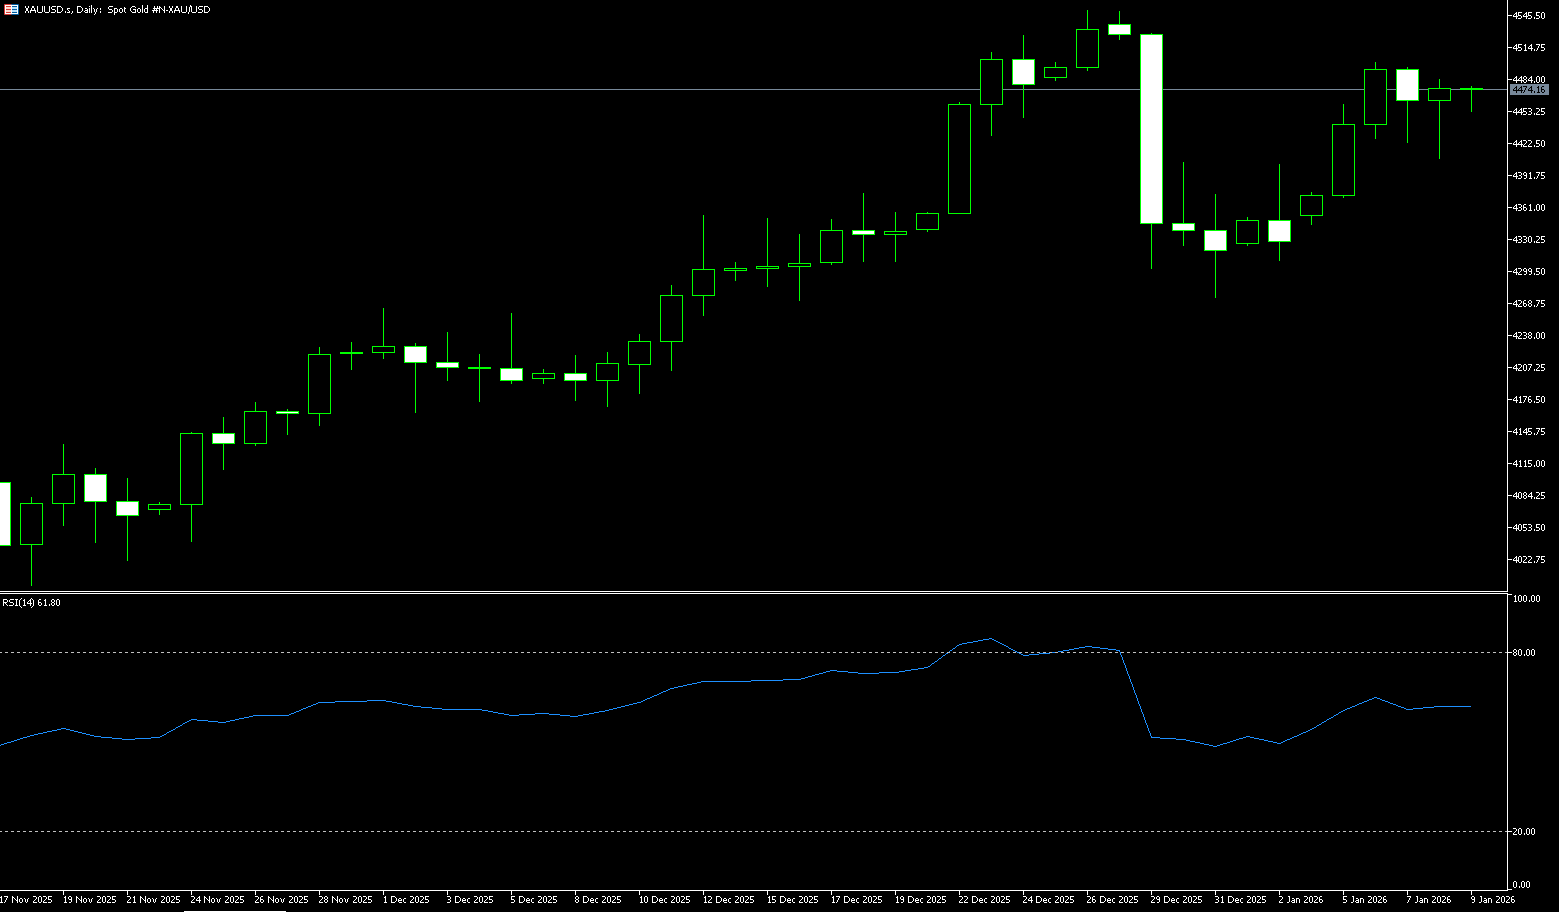
On Wednesday morning, spot gold hit a new record high for the third time this week, trading around $4,888 per ounce. Gold prices refreshed their record high on Tuesday at $4,766 per ounce, and may target $5,000 per ounce this week. Market concerns over US President Trump's new tariff threats against several European countries regarding Greenland exacerbated safe-haven demand. President Trump's threats to impose tariffs on Europe over Greenland frightened investors, causing major Wall Street stock indices to fall to near three-week lows, further strengthening investor demand for safe-haven assets such as gold. At the same time, the sharp weakening of the US dollar made dollar-denominated gold more attractive to overseas buyers, providing additional support for gold prices. Year-to-date gains have exceeded 10%. Furthermore, market expectations of future interest rate cuts by the Federal Reserve have reduced the opportunity cost of holding non-yielding assets such as gold, providing support for gold prices.
From a technical chart perspective, spot gold has exhibited a clear, stepped upward trend since its low of $3,886 last October. Each pullback has been brief and rapid, demonstrating strong bullish control. Currently, the price is approaching the key resistance zone of $4,900. A successful break and hold above this level could open up further upside potential towards the market consensus target of $5,000. Key support lies in the $4,700 (psychological level) - $4,690 (5-day moving average) area, a region that has historically acted as a dividing line between bullish and bearish trends, possessing strong medium-term defensive significance. A break below this level would target $4,640 (9-day moving average). Technically, the MACD remains in a bullish pattern, indicating continued strong upward momentum. However, the RSI (14) has reached 77.62, entering the overbought zone, indicating signs of overheating and profit-taking pressure in the short term. This means that even if the medium-term trend remains unchanged, a volatile pattern of "rising and falling back, then retracing for confirmation" may occur in the short term.
Consider going long on gold around 4,815 today; Stop loss: 4,810; Target: 4,850; 4,860
AUD/USD
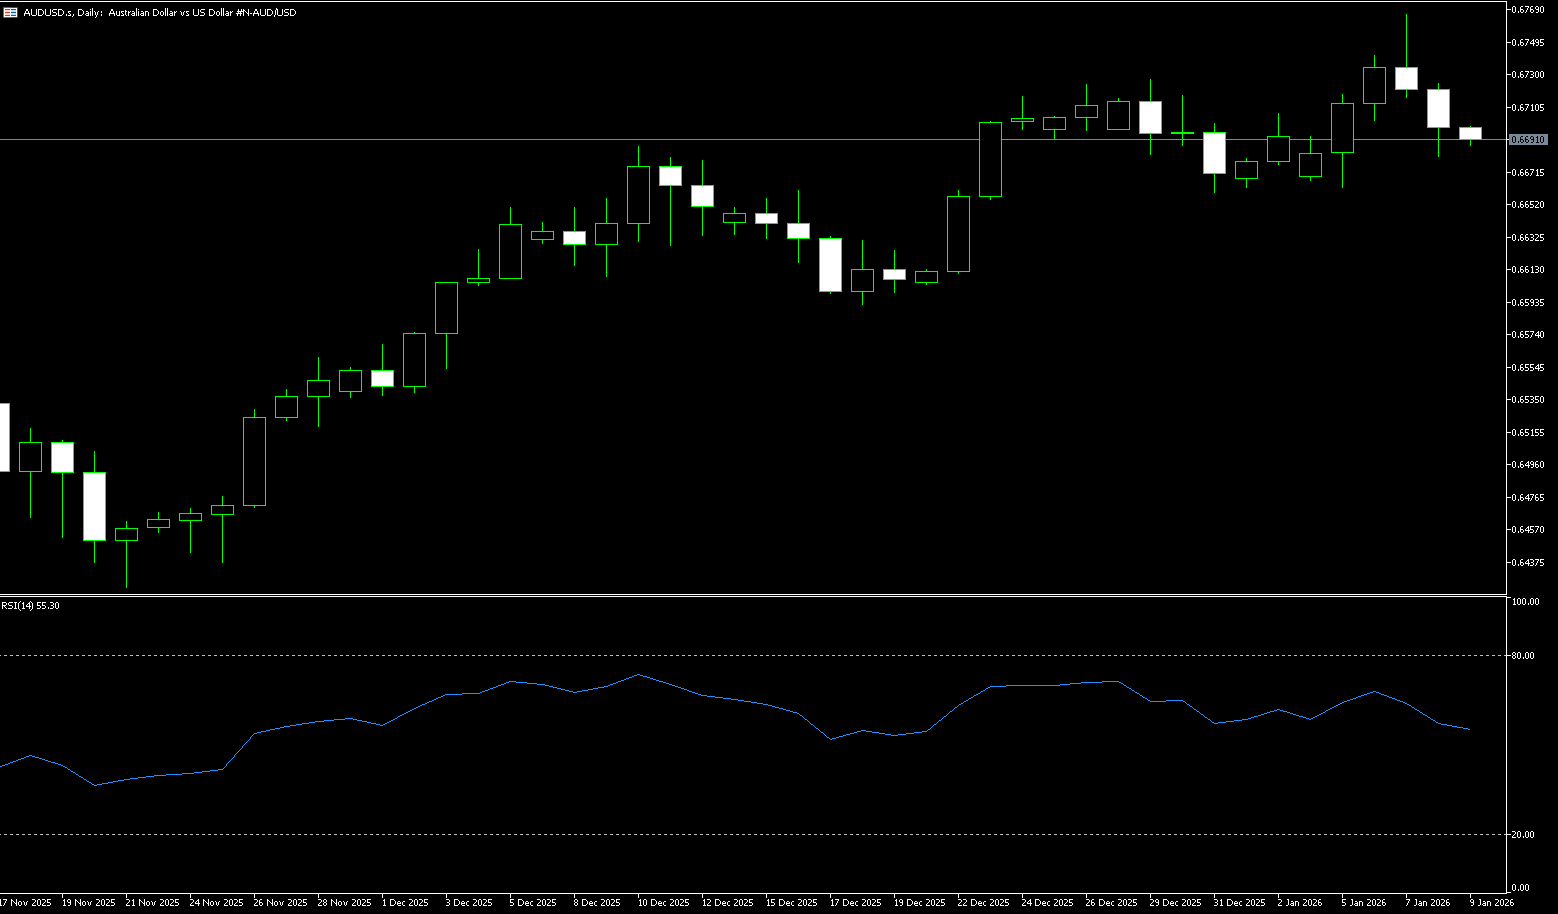
The Australian dollar rose to around US$0.6765 on Wednesday, reaching its highest level in fifteen months, as geopolitical tensions continued to put pressure on the US dollar, while investors awaited local employment data to be released this week. Employment is expected to increase by about 30,000 in December, and the unemployment rate is expected to rise slightly to 4.4%. This typically volatile labor market report could deliver a surprise, with a strong result potentially increasing expectations for a rate hike in February. Currently, the market expects a 27% probability of the Reserve Bank of Australia raising rates by 25 basis points in February, rising to 76% by May. Meanwhile, the US dollar remained under pressure as investors continued to reduce their exposure to the US market following President Trump's harsh rhetoric on Greenland, particularly against the backdrop of escalating tensions with Europe. Trump threatened new tariffs on European countries that opposed his plans, and European leaders are considering possible retaliatory measures.
The AUD/USD pair remains closely correlated with global risk sentiment and the path of China's economy. A clear break above 0.6800 is needed to generate a more convincing bullish signal. Next, AUD/USD is expected to face the 2026 upper limit of 0.6766 (January 7), followed by 0.6800 (a psychological level), and the 2024 high of 0.6942 (September 30) as a benchmark. On the other hand, sellers need to break below the weekly low of 0.6659 (December 31) and 0.6667 (last week's low) to expose a potential move towards the 0.6600 (psychological level) – 0.6414 (lowest level since June last year) range. Furthermore, momentum indicators show additional growth: the 14-day Relative Strength Index (RSI) is above the 60 mark, while the Average Directional Index (ADX) is near 29, indicating a fairly strong trend.
Consider going long on the Australian dollar today around 0.6750; Stop loss: 0.6740; Target: 0.6790; 0.6800
GBP/USD
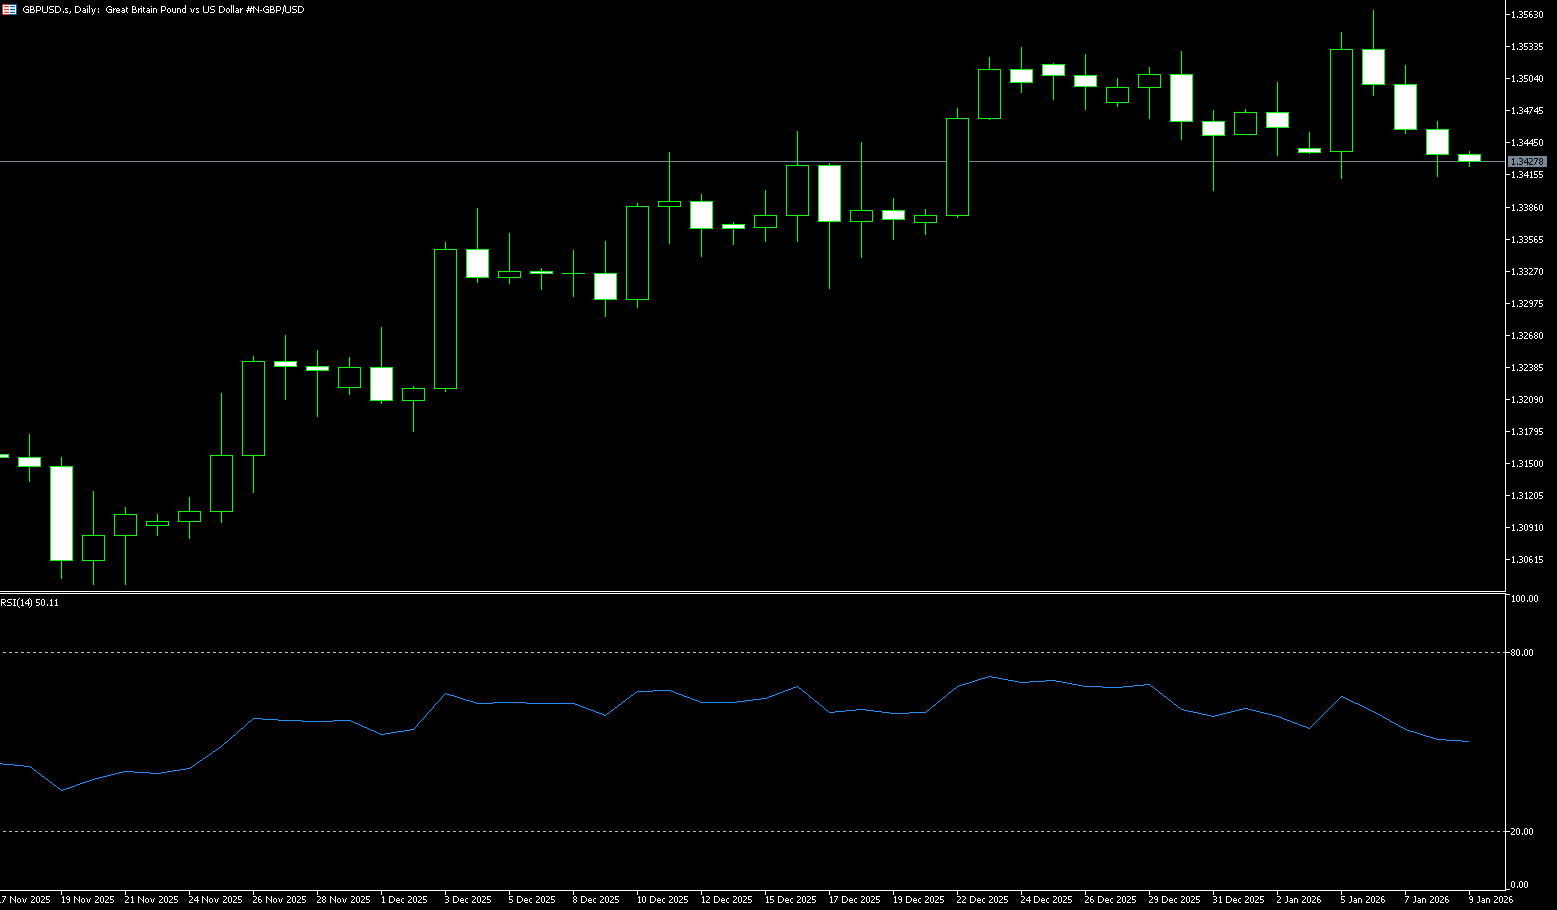
The pound traded above $1.3400 against the dollar, rising from a four-week low of $1.3344 hit on January 19, as investors digested the latest UK labor market data, while ongoing geopolitical tensions continued to put pressure on the dollar. The UK unemployment rate remained unchanged at 5.1% in the three months to November, near pandemic-era highs and slightly above the expected 5%. Meanwhile, annual wage growth excluding bonuses slowed to 4.5%, the weakest pace since the three months to April 2022. At the same time, US President Trump's threat to reimpose tariffs continued to put pressure on the dollar as global leaders gathered at the Davos meeting. Trump hinted that Europe was unlikely to "retaliate too much," after warning over the weekend that he might impose additional tariffs on eight European countries unless the U.S. was allowed to "buy" Greenland. Any escalation would disproportionately affect Britain and Germany, two of Europe's most sensitive exporters to the U.S. market.
GBP/USD is currently trading at 1.3435. The 20-day exponential moving average is stalling near 1.3455, and the pair is testing this dynamic upper limit. A close above this average would improve short-term momentum. The 14-day Relative Strength Index (RSI) is slightly up at 53.50 (neutral) but still reflects balanced momentum. Measured from the high of 1.3780 to the low of 1.3006, the 61.8% Fibonacci retracement is located at 1.3485, and the 1.3490 area (Tuesday's high) provides resistance to any rebound and limits upside potential. A close above the latter would indicate a weakening bearish trend and could extend the rebound to the 1.3567 level (January 6 high). Failure to break through would keep the pair within a range. Further weakness in GBP/USD could expose a move towards temporary support at the 45-day simple moving average of 1.3375, followed by Monday's low of 1.3344.
Consider going long GBP around 1.3423 today; Stop loss: 1.3410; Target: 1.3460; 1.3470
USD/JPY
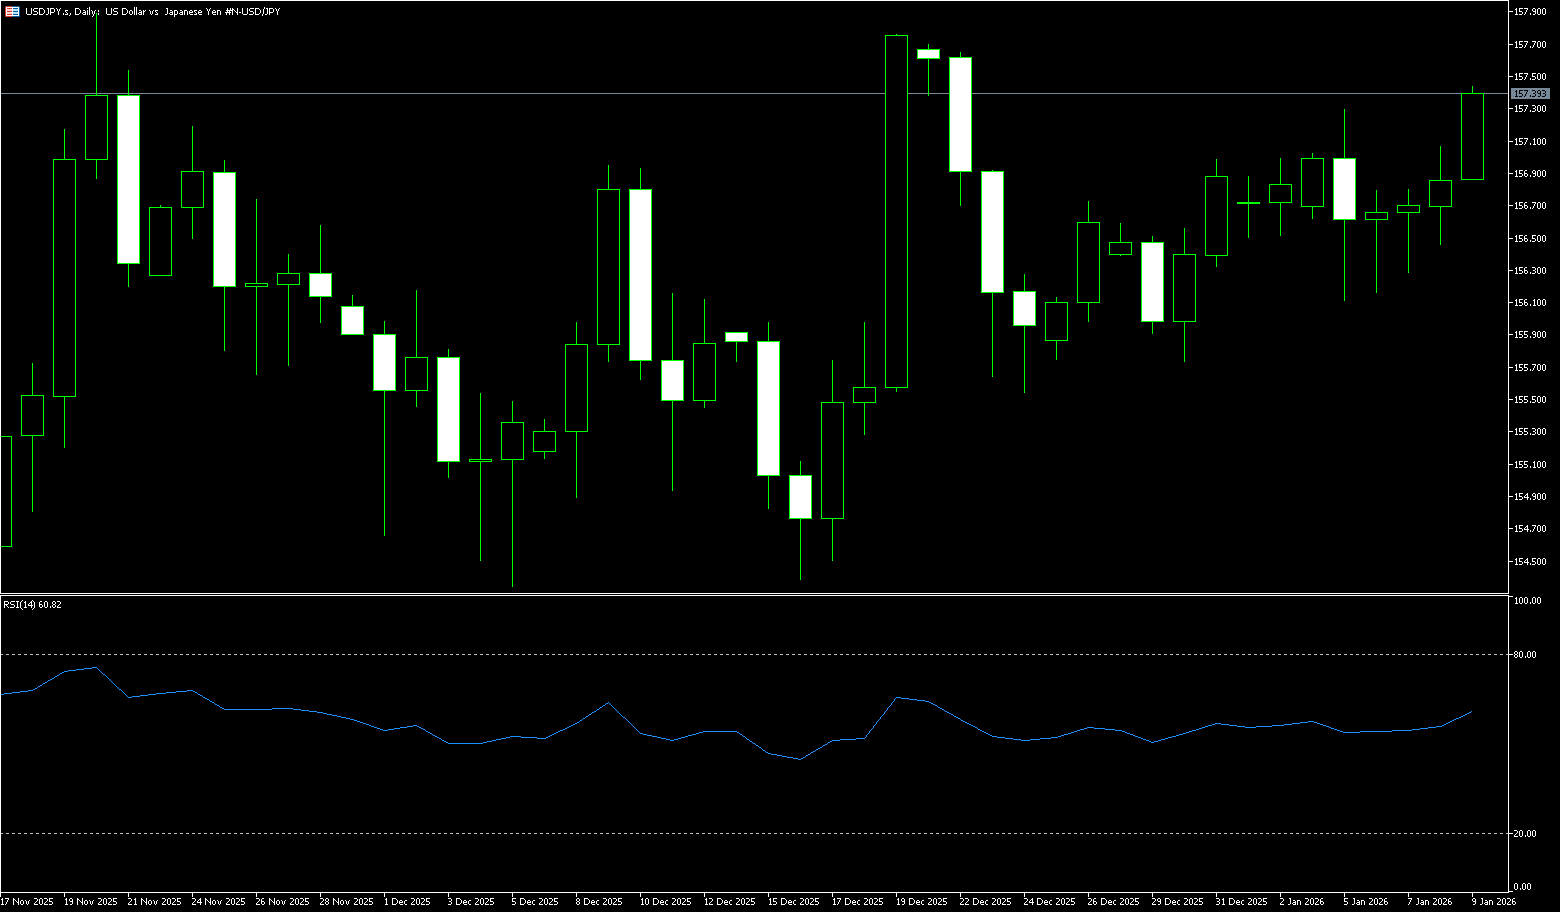
USD/JPY held steady around 158 per dollar on Wednesday but faced downward pressure after Prime Minister Sanae Takashi proposed an 8% reduction in the food sales tax, as it remains unclear how the government will compensate for lost revenue. Earlier this week, Takashi announced she would dissolve parliament on Friday and call a snap election on February 8 to garner support for her spending plans and broader policies. Investors are also focused on the Bank of Japan's policy meeting later this week, with expectations that interest rates will remain unchanged after a December rate hike. Traders are wary of potential yen intervention as concerns intensify about the impact of a weaker currency on domestic inflation. However, the yen is supported by a weaker dollar as escalating tensions between the US and Europe over Greenland damage confidence in US assets.
The dollar has underperformed across the board due to the ongoing dispute between the US and the European Union over Greenland sovereignty, putting pressure on the yen pair. Technically, even with the dollar index recording consecutive sharp declines in the past two trading days, the yen has not appreciated significantly, indicating that downward pressure on the yen remains substantial. Sanae Takashi's announcement of a snap election during a period of high public support is seen as a move to uphold her governing principles, reinforcing expectations of yen depreciation. However, constrained by the Japanese government's frequent window guidance, the yen is likely to fluctuate around the 160 level. Technically, USD/JPY has retraced to the breakout level of 157.89 and is trading within an upward channel, in a strong position within the channel, above the middle band. The Japanese yen is expected to continue its depreciation trend within an upward channel, with support at the 157.00 level, followed by the 156.50 level (50-day simple moving average). On the upside, watch the 158.31 level (9-day simple moving average) and the 158.88 level (January high from last year).
Today, consider shorting the US dollar near 158.50; stop loss: 158.66; target: 157.80; 157.60
EUR/USD
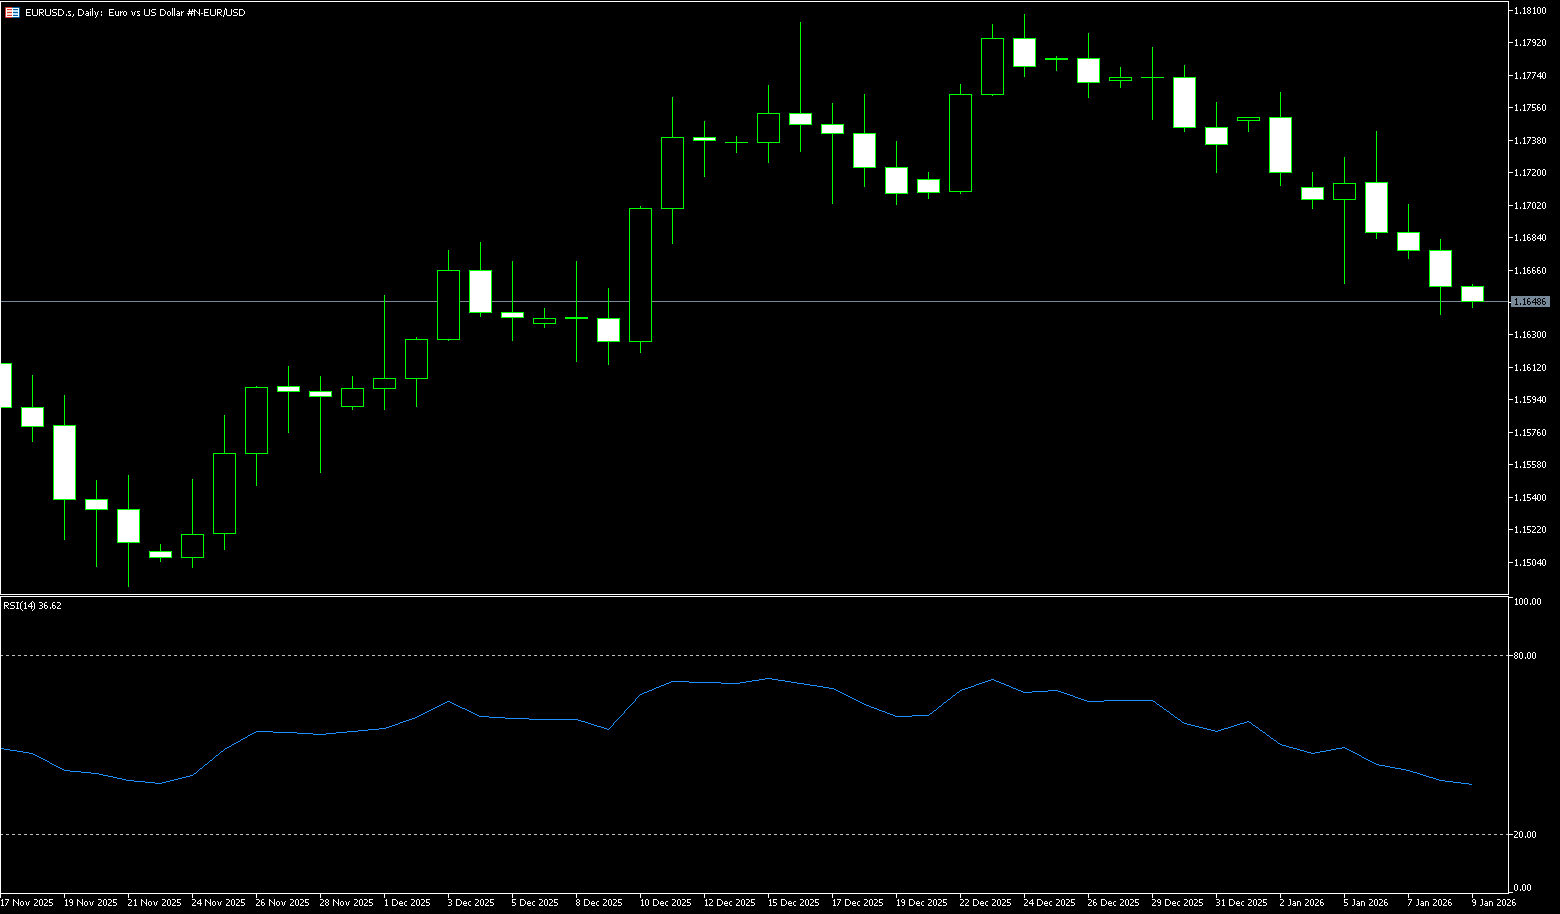
The euro is fluctuating below $1.1700, with investors cheering stronger-than-expected German economic data while geopolitical tensions continue to put pressure on the dollar. Germany's Zew economic sentiment index jumped to 59.6 in January, the highest level since July 2021, well above the expected 50, indicating optimism about an economic recovery in 2026 despite uncertainty surrounding US trade policy. Meanwhile, the dollar weakened after US President Donald Trump reiterated his threat to impose tariffs, warning of 10% tariffs on several European countries to force Denmark to sell Greenland to the US. Trump stated that Europe was unlikely to "go too far" as global leaders gathered in Davos, while the EU was considering broad retaliatory measures, including tariffs of up to €93 billion on US goods.
The euro/dollar pair rose to a new yearly high of 1.1768 this week and closed above 1.1700, opening the door for further gains. In the short term, momentum has shifted to a neutral-to-upward bias as the dollar has lost its safe-haven appeal in Trump's trade war with the EU. From a momentum perspective, the 14-day Relative Strength Index (RSI) shows buyers are gathering some strength as the index broke above the neutral level. Therefore, the path of least resistance is upward. The first resistance level for the euro/dollar is 1.1768 (Tuesday's high), followed by the psychological level of 1.1800. A break above this level would target 1.1848 (the high from September 18th last year). On the other hand, if the currency pair breaks below the 5-day simple moving average at 1.1660, traders will target the 100-day simple moving average at 1.1662, followed by Tuesday's low of 1.1632 and the psychological level of 1.1600.
Consider going long on the Euro today near 1.1675; Stop loss: 1.1665; Target: 1.1730; 1.1740
Disclaimer: The information contained herein (1) is proprietary to BCR and/or its content providers; (2) may not be copied or distributed; (3) is not warranted to be accurate, complete or timely; and, (4) does not constitute advice or a recommendation by BCR or its content providers in respect of the investment in financial instruments. Neither BCR or its content providers are responsible for any damages or losses arising from any use of this information. Past performance is no guarantee of future results.
More Coverage


Risk Disclosure:Derivatives are traded over-the-counter on margin, which means they carry a high level of risk and there is a possibility you could lose all of your investment. These products are not suitable for all investors. Please ensure you fully understand the risks and carefully consider your financial situation and trading experience before trading. Seek independent financial advice if necessary before opening an account with BCR.
BCR Co Pty Ltd (Company No. 1975046) is a company incorporated under the laws of the British Virgin Islands, with its registered office at Trident Chambers, Wickham’s Cay 1, Road Town, Tortola, British Virgin Islands, and is licensed and regulated by the British Virgin Islands Financial Services Commission under License No. SIBA/L/19/1122.
Open Bridge Limited (Company No. 16701394) is a company incorporated under the Companies Act 2006 and registered in England and Wales, with its registered address at Kemp House, 160 City Road, London, City Road, London, England, EC1V 2NX. This entity acts solely as a payment processor and does not provide any trading or investment services.

 English
 简体中文
简体中文
 繁體中文
繁體中文
 Bahasa
Melayu
Bahasa
Melayu
 Tiếng
Việt
Tiếng
Việt
 ไทย
ไทย
 日本語
日本語
 한국어
한국어
 ភាសាខ្មែរ
 español