0
US Dollar Index
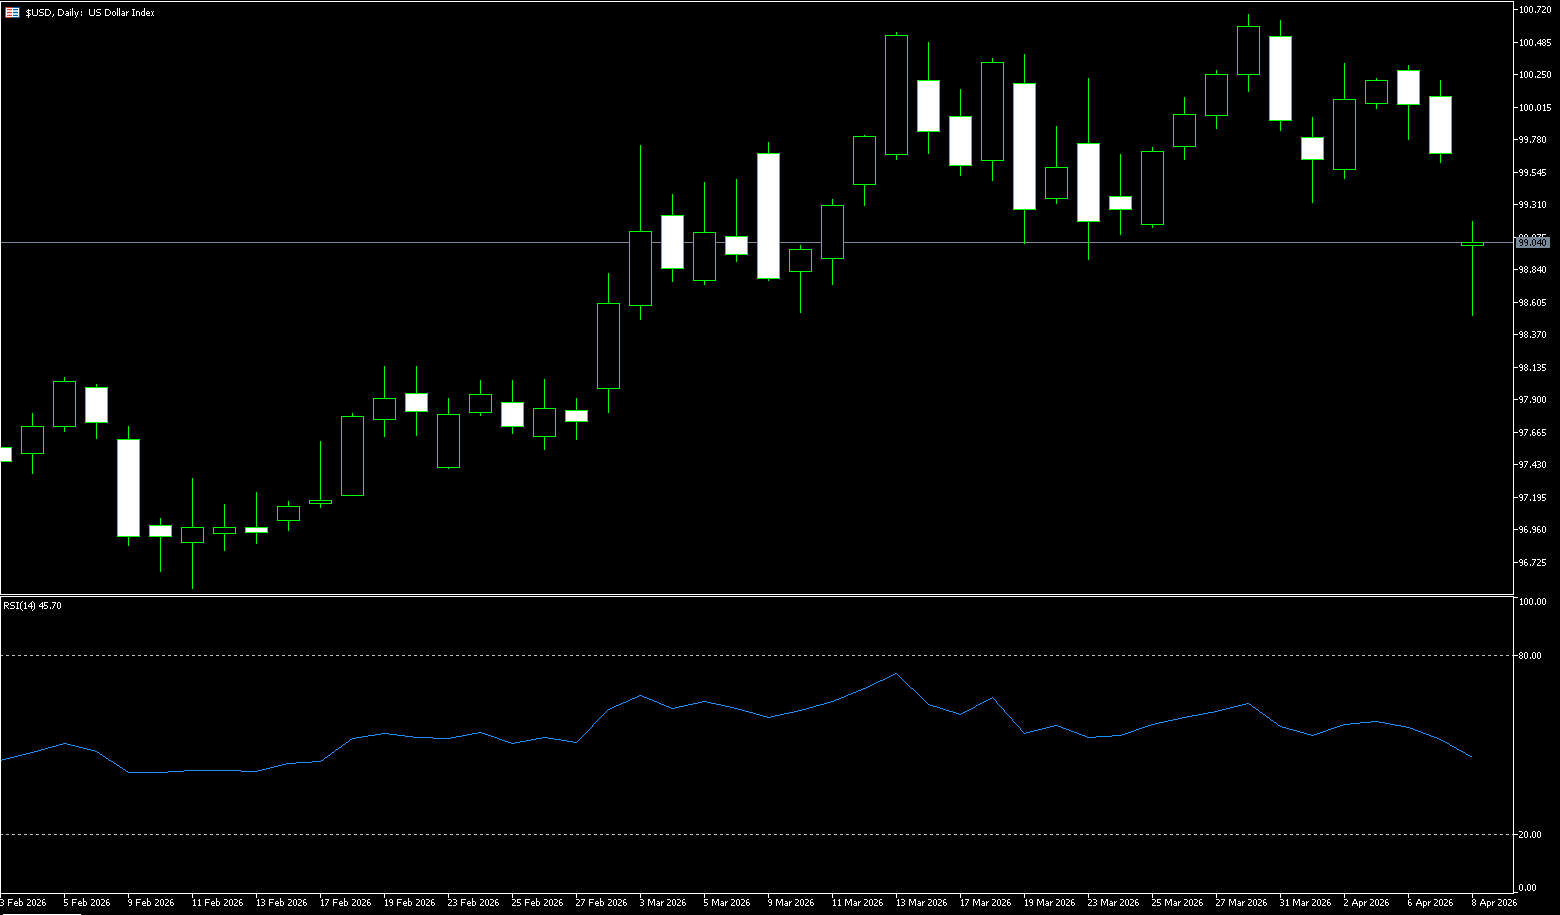
Trump announced a two-week ceasefire with Iran, which Iran accepted. US-Iran negotiations will begin on the 10th in Islamabad. The US dollar index continued to trade under pressure during Wednesday's Asian session, currently hovering near a three-week low of 98.85, continuing the decline from the previous trading day. The main factor driving the dollar's weakness is the temporary easing of tensions in the Middle East. US President Trump announced a two-week suspension of military action against Iran, a decision that significantly reduced market demand for safe-haven assets. As the conflict de-escalates in the short term, market risk appetite has rebounded, and the dollar's attractiveness as a safe-haven asset has clearly decreased. Looking at the developments, this suspension comes with a condition: Iran must reopen the Strait of Hormuz. Iran stated that, with coordination with its armed forces, it will allow safe passage through this crucial waterway for the next two weeks. This statement has alleviated market concerns about energy supply disruptions to some extent, thus weakening the dollar's safe-haven support logic.
From a market sentiment perspective, the current dollar trend is clearly influenced by both "weakening safe-haven attributes" and "increased policy uncertainty." On the one hand, easing geopolitical risks have weakened demand for the US dollar; on the other hand, the uncertainty surrounding the Federal Reserve's policy path has kept investors cautious. From a technical perspective, the daily chart shows that the US dollar index has entered a weak, oscillating pattern after falling from its highs, and has now broken below its short-term equilibrium range, indicating a shift from a strong to a weak trend. The 98.50 area (200-day moving average) forms key support; a further break below this level could open up further downside potential to 98.00 (a psychological level). Resistance levels are concentrated at 99.41 (30-day moving average) and the psychological level of 100, which also acts as technical resistance. In terms of momentum, bearish forces are gradually increasing, but a clear trend has not yet formed.
Today, consider shorting the US Dollar Index at 99.14, with a stop-loss at 99.25 and targets at 98.70 and 98.60.
WTI Crude Oil
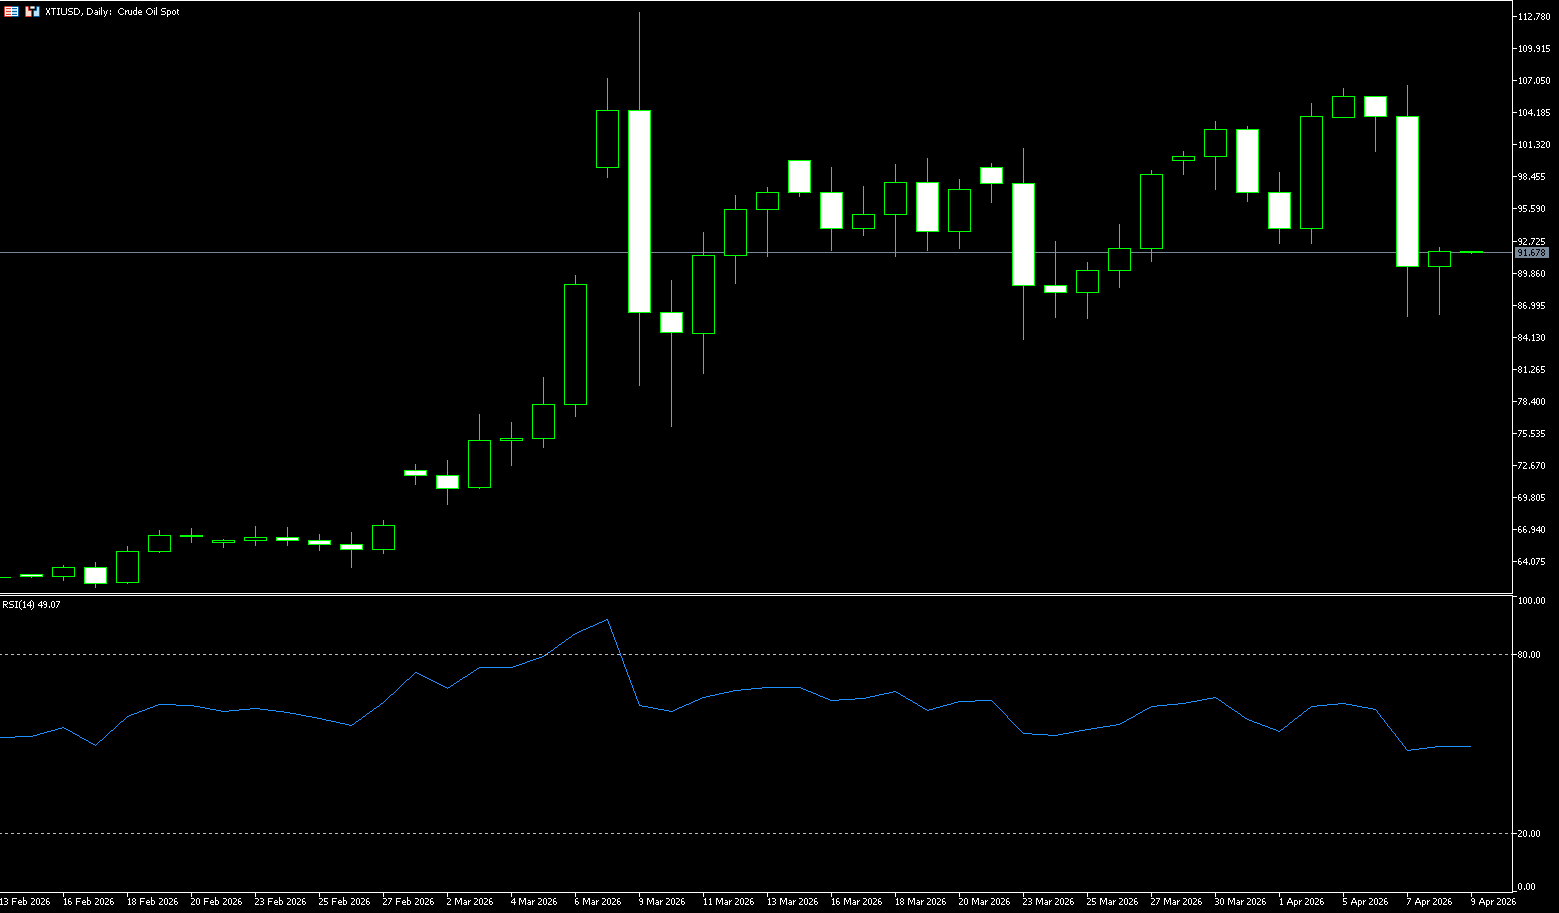
On Wednesday morning in Asian trading, WTI crude oil prices plunged over 15% to $86 due to the two-week ceasefire agreement reached between the US and Iran. It is currently trading around $90 per barrel. Both sides announced that negotiations would begin on April 10 in Islamabad, and that the Strait of Hormuz would be opened during the ceasefire, significantly easing geopolitical tensions. On Tuesday, local time, US President Trump announced on the social media platform "Truth Social" that after communicating with the Prime Minister and Army Chief of Staff of Pakistan and receiving a commitment from Iran to fully open the Strait of Hormuz, he decided to suspend devastating attacks on Iran, reaching a two-week bilateral ceasefire. Although the short-term risk premium has been significantly released, the market remains cautious about the subsequent recovery of supply due to the damage to the Middle East supply chain and the uncertainty of the restoration of key shipping lanes. Future oil price movements will depend on the progress of the ceasefire and the actual recovery of supply. In fact, oil prices had already been declining throughout the day before the official announcement.
Although prices have clearly fallen, WTI crude oil is still up about 55% compared to before the conflict, indicating that the market still retains a certain risk premium. This is mainly due to two factors: first, the ceasefire is only a temporary arrangement, and the two sides still have significant differences; second, infrastructure has been severely damaged, and even if a long-term agreement is reached, supply recovery will take time. From a technical perspective, the daily chart shows that oil prices have entered a high-level consolidation phase after a rapid rise, and have now fallen back to near a key support area. The key support levels are $86.15 (34-day simple moving average) and $86.00 (Wednesday's low). A decisive break below these levels could trigger a trend sell-off, further opening up downside potential to the $80.00 (psychological level). Resistance is concentrated around the $95.53 (20-day simple moving average) area, which has previously suppressed price rebounds multiple times. Once this level is regained, prices may retest the previous psychological high resistance area of $100. From a momentum perspective, the upward momentum has clearly weakened, and the market has entered a rebalancing phase after the release of pent-up emotions.
Today, consider going long on crude oil at 91.00, with a stop loss at 90.80 and targets at 93.00 and 93.50.
Spot Gold
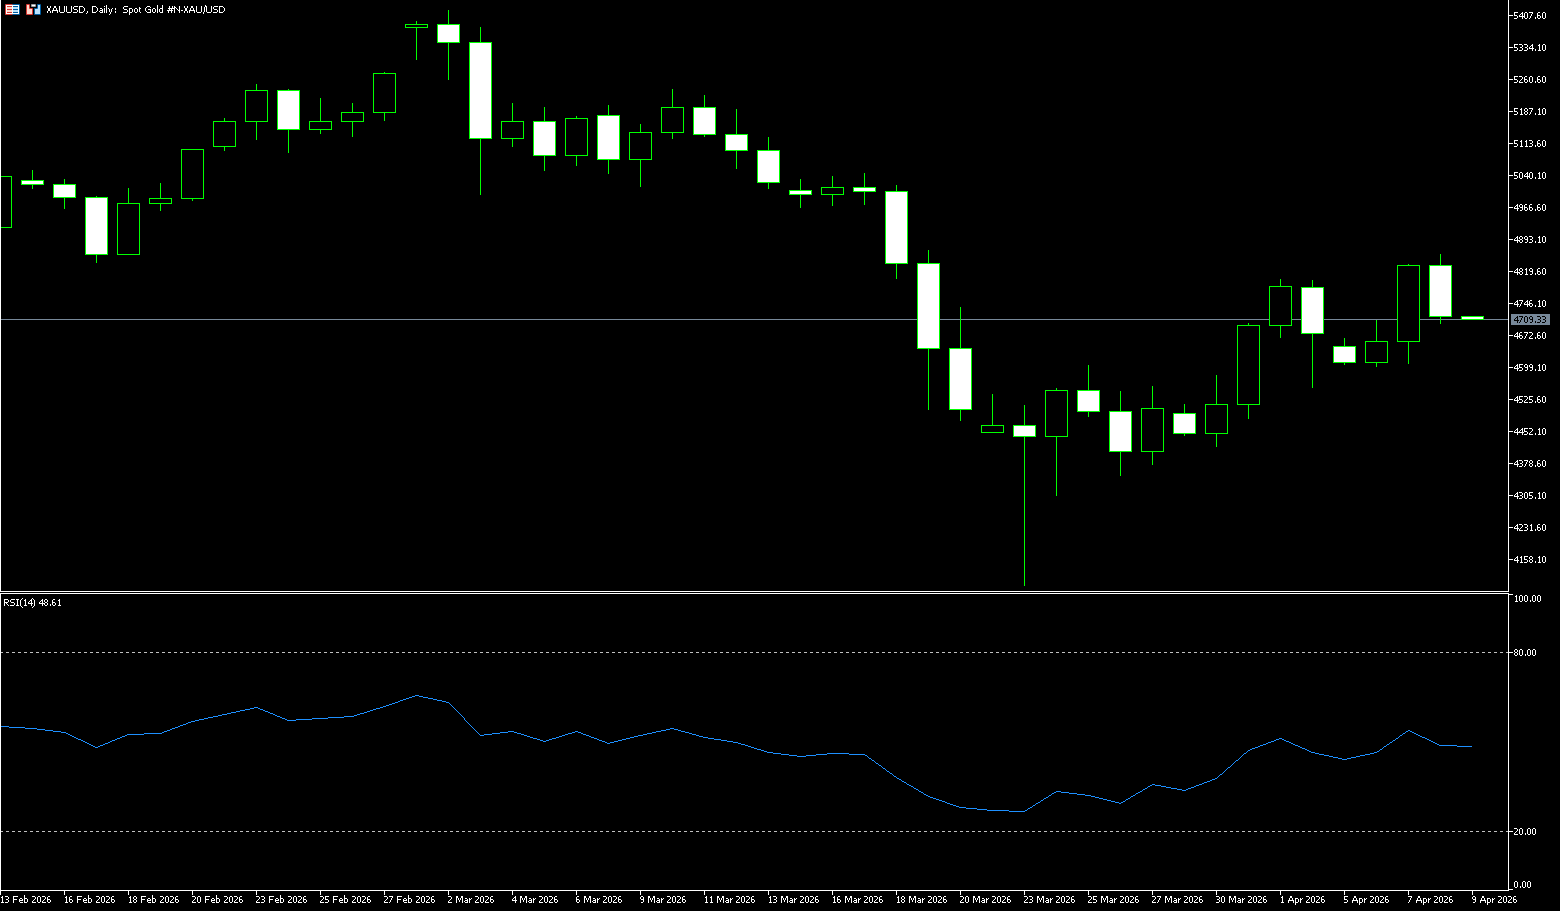
On Wednesday morning in Asian trading, spot gold rose more than 2.5%, trading around $4,857 per ounce. Trump announced a two-week ceasefire with Iran, which Iran accepted, and that US-Iran negotiations would begin on the 10th in Islamabad. Meanwhile, the market awaited the Federal Reserve meeting minutes and data. Just as the deadline was approaching (Eastern Time), US President Trump suddenly posted on the social media platform "Truth Social," announcing an agreement to suspend bombing and military strikes against Iran for a full two weeks. This bombshell news acted like a "peace bomb," quickly shattering market concerns about tensions in the Middle East, causing significant volatility in global financial markets. Oil prices plunged by more than $20 in a short period, while gold prices rebounded strongly by more than 2%, reaching a more than two-week high. In the coming period, investors need to closely monitor further developments in the Middle East, including the specific progress of US-Iran negotiations in Islamabad, and changes in risk appetite in the oil and stock markets.
Gold prices have fallen by about 12% since reaching a high of $5,598/oz on January 29th amid the Middle East conflict. Currently, prices are consolidating around $4,800/oz, showing a clear upward trend from recent lows. Technically, the daily chart shows gold remains in a strong upward channel, with prices maintaining high levels and the overall trend intact. Key support levels are at $4,733 (89-day simple moving average) and the $4,700 (psychological level), which represents the lower edge of the recent trading range. Resistance is concentrated around the $4,900 psychological level and the $4,929 (50-day simple moving average) area; a decisive break above these levels could open up further upside potential to the psychological level of $5,000. From a momentum perspective, bullish forces still dominate, but upward momentum has slowed. From a short-term perspective, the price is consolidating at a high level, fluctuating repeatedly within a range. If it stabilizes after testing support, further upward movement is possible; however, a break below $4,733-$4,700 could trigger a technical correction.
Today, consider going long on spot gold at $4,715, with a stop-loss at $4,710 and targets at $4,770 and $4,760.
AUD/USD
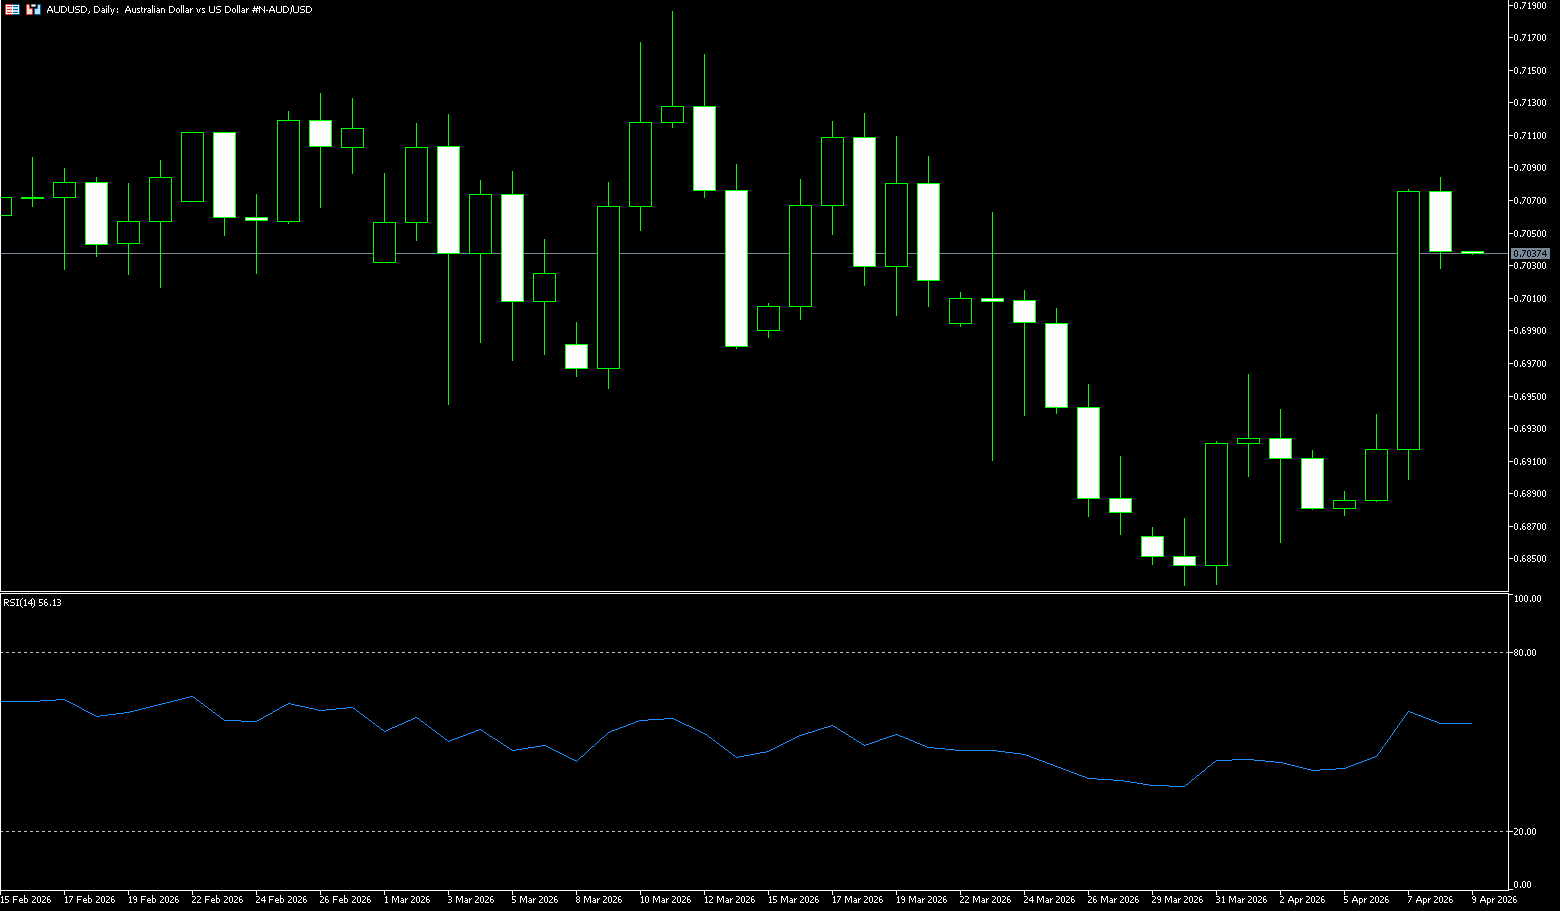
The Australian dollar jumped above $0.7070, hitting a three-week high, as global risk sentiment improved and the US dollar weakened after US President Trump announced a two-week suspension of military action against Iran. This move came ahead of a deadline that could have triggered escalation, with Trump announcing a "bilateral ceasefire" related to Iran's agreement to reopen the Strait of Hormuz. He also stated that the US had received a 10-point Iranian proposal that could serve as a basis for negotiations, with the two-week window aimed at ultimately reaching a broader agreement. The ceasefire could reshape the inflation outlook and potentially ease pressure on the Reserve Bank of Australia to further tighten policy. The market had anticipated a rate hike to 4.35% or higher at the May meeting, partly due to high energy prices following the closure of the Strait of Hormuz. However, analysts warned that even with a lasting agreement, supply conditions could take months to fully return to normal.
The Australian dollar remains supported by strong macroeconomic fundamentals, and the Reserve Bank of Australia has not backed down. The bias remains favorable. On the daily chart, the AUD/USD pair has climbed back above 0.7000. The short-term bias is slightly bullish, as the spot price holds above the 20-day simple moving average around 0.6975, coinciding with the 23.6% Fibonacci retracement level of 0.6976 measured from the 0.6421 low to the 0.7147 high, keeping the pair in a shallow correction rather than a full reversal. The 14-day Relative Strength Index (RSI) is around 57, above the 50 midline, suggesting weakening downward momentum and that buyers have not yet shown strong impetus. Immediate support is located at 0.6975-0.6976. A break below this area would expose the psychological level of around 0.6900. Initial resistance is at the psychological level of 0.7100. A daily close above this range would reopen the path to 0.7187 (this year's high). As long as the pair remains above 0.6975-0.6976, downside may attract buying within this range, maintaining a range-bound but slightly bullish pattern.
Consider going long on the Australian dollar today at 0.7030, with a stop loss at 0.7020 and targets at 0.7080 and 0.7090.
GBP/USD
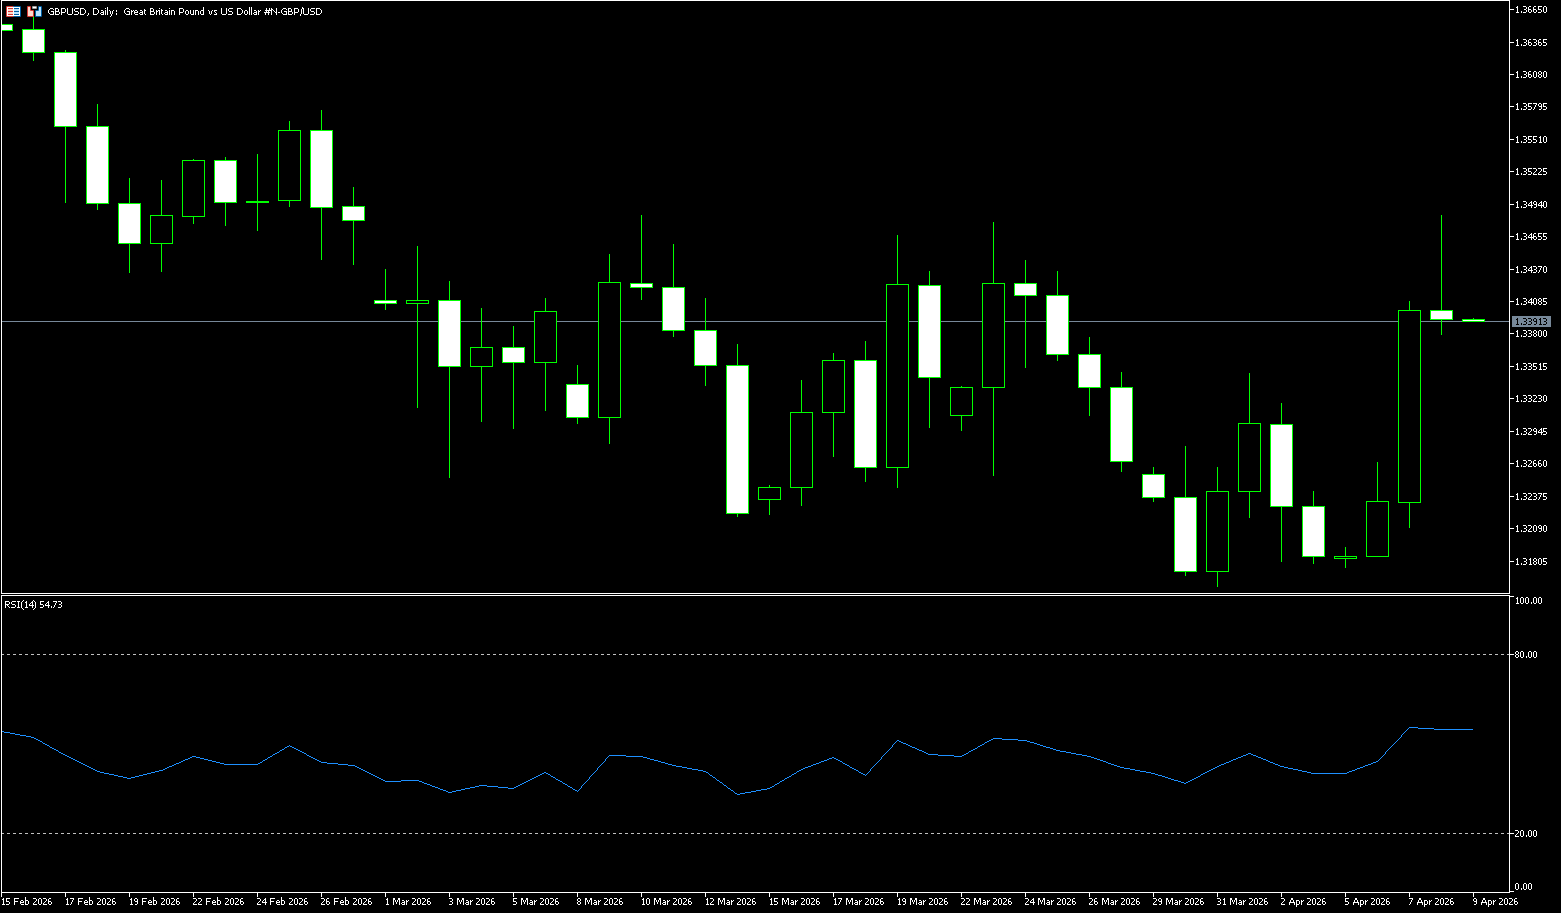
On Wednesday, the pound surged against the dollar, rising 1% in early European trading to near 1.3445 as market sentiment shifted towards risk assets. US President Trump's announcement of a pause in planned attacks on Iranian power plants, after Tehran agreed to reopen the Strait of Hormuz for two weeks, boosted risk appetite. S&P 500 futures rose more than 2.7% in European trading, reflecting strong demand for risk-sensitive assets. The dollar index, which tracks the dollar against six major currencies, fell 0.75% to near 98.75. The dollar faced strong selling pressure as safe-haven demand weakened and traders reduced their bets on a Federal Reserve (Fed) rate hike this year. According to the CME FedWatch tool, traders have ruled out a Fed rate hike this year, a stark contrast to expectations of at least one rate hike since the outbreak of war on February 28.
Currently, GBP/USD is trading around 1.3400. The pair has recovered above its 20-day simple moving average after a prolonged dip, and is cautiously bullish in the short term as prices stabilize above the recent consolidation zone around 1.3350. The recovery above the moving average was accompanied by improved momentum, with the RSI rising from below 50 to 56, indicating increased buying pressure since the late March lows. This combination suggests buyers have regained control, but the overall structure still reflects a recovery phase rather than a fully established uptrend. Initial resistance is located at the March 23 high of 1.3480; a break above this level would open up further upside potential to 1.3600. On the downside, short-term support lies at the 20-day simple moving average of 1.3308. A close below this area would neutralize the current bullish tone and expose the 1.3300 area. As long as spot prices remain above 1.3370, the technicals still support further gains to 1.3480 and higher.
Consider going long on GBP at 1.3388 today, with a stop-loss at 1.3375 and targets at 1.3440 and 1.3450.
USD/JPY
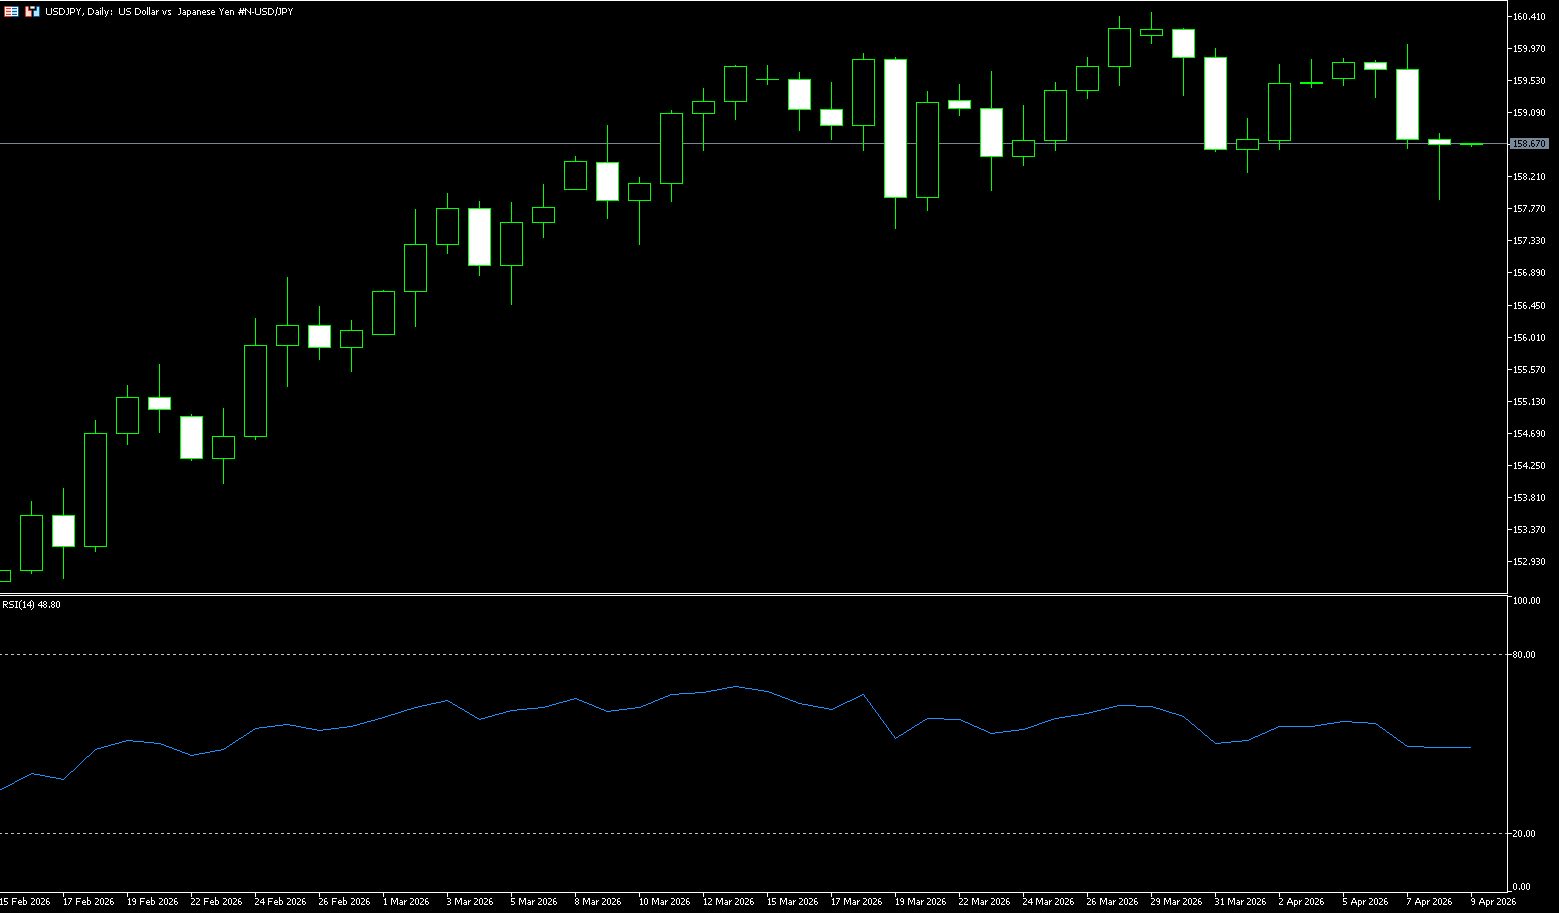
The yen rebounded strongly on Wednesday, rising above 158.35 per dollar and shaking off the key 160 level reached earlier in the week. USD/JPY reversed sharply on Tuesday, hitting an intraday high of around 160.50 before quickly falling below 159.00, ultimately closing at around 158.85. The currency pair briefly broke through 160.00 for the first time since July 2024, a level that had previously triggered direct intervention from Japan's Ministry of Finance. A late-session reversal erased all of the day's gains, and more. This followed a two-week ceasefire agreement reached between the US, Iran, and Israel to allow for potential peace talks. President Trump postponed planned strikes on Iranian civilian infrastructure for two weeks, which he called a "double ceasefire," while Iran agreed to reopen the Strait of Hormuz, and Israel agreed to suspend hostilities during this period. Meanwhile, Prime Minister Sanae Takaichi is seeking separate talks with US and Iranian leaders to work towards securing peace and meeting Japan's energy needs. The yen was also supported by intervention concerns as Japanese authorities warned of currency depreciation and the market anticipated a near-term interest rate hike by the Bank of Japan.
On Tuesday evening local time, just before the deadline in the Eastern Time zone, US President Trump suddenly announced on the social media platform "Truth Social" that he had agreed to a two-week suspension of bombing and military strikes against Iran. This bombshell news acted like a "peace bomb," quickly shattering market concerns about Middle East tensions and causing significant volatility in global financial markets. The US dollar index also fell sharply, hitting a more than two-week low. The yen rose above 158.35 per dollar on Wednesday, rebounding strongly and shaking off the key 160 level reached earlier this week. USD/JPY is currently trading around 158.55. The short-term bias is slightly bearish, as the price remains below the rising 20-day simple moving average (159.25), while the 14-day Relative Strength Index (RSI) is around 48, firmly below the 50 midline, indicating weakening upward momentum. Initial support lies at the psychological level of 158.00; a break below this level would expose deeper downside potential, targeting the 157.15 level (the 50-day simple moving average). The first resistance level is seen at the 20-day simple moving average of 159.25. A daily close above this level would confirm a bullish extension to 160.00 (a psychological level).
Consider shorting the US dollar at 158.80 today, with a stop-loss at 159.00 and targets at 158.00 and 157.80.
EUR/USD
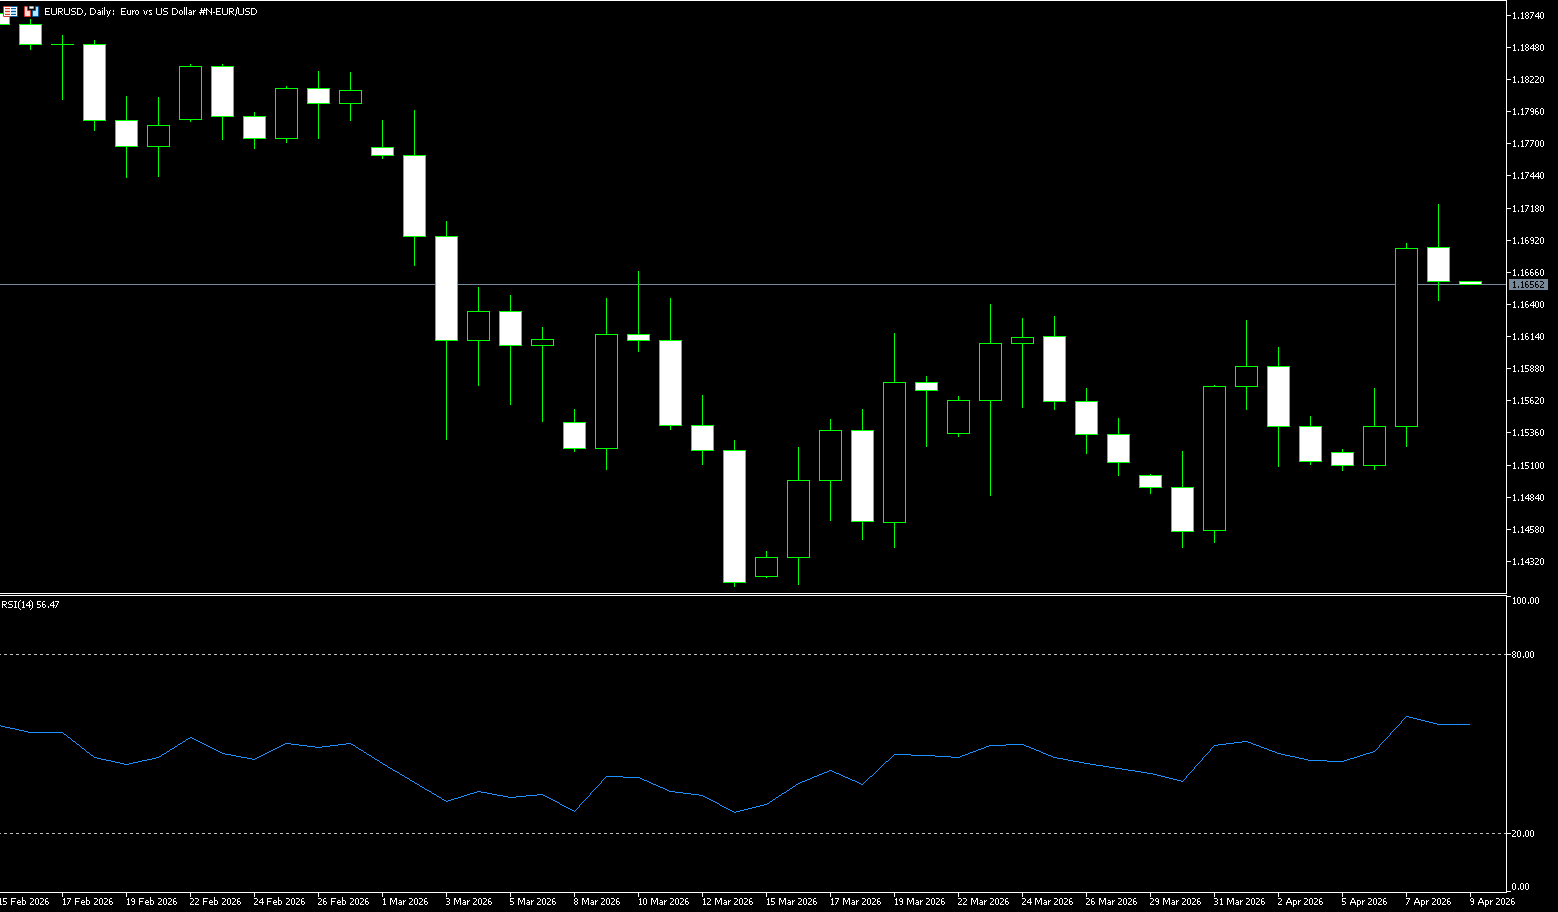
The euro/dollar pair surged to around 1.1660 in early Asian trading on Wednesday. The euro strengthened against the dollar after US President Trump agreed to a two-week ceasefire with Iran. A White House official said Trump stated on Tuesday that he had agreed to a two-week ceasefire with Iran on the condition that Iran agree to reopen the crucial Strait of Hormuz. According to CNN, Israel has also agreed to a ceasefire. Trump's announcement came after Pakistani Prime Minister Sheikh Baz Sharif proposed a ceasefire to facilitate diplomatic negotiations between the US and Iran. Traders will be closely watching developments regarding the US-Iran ceasefire. Signs of easing tensions in the Middle East could support risk assets, such as shared currencies like the euro, in the short term.
From a technical perspective, the euro/dollar pair is bullish, as prices are holding above the psychological level of 1.1600 and the 34-day simple moving average (SMA) at 1.1606, with short-term buyers holding onto the recent rally. Momentum indicators have turned positive, but are only slightly above the midline, while the Relative Strength Index (RSI) hovers above 55, indicating moderate upward pressure rather than overextended gains. On the daily chart, the euro/dollar remains bullish, as the spot price is holding below the 50-day SMA clustered around 1.1682 and the 1.1700 level, forming a limited upward pattern. A break above this level would target 1.1765 (the February 6 low). Conversely, a drop below 1.1600 would shift focus to retesting the support at 1.1588 (Wednesday's low).
Consider going long on the Euro today at 1.1650, with a stop-loss at 1.1640 and targets at 1.1700 and 1.1710.
Disclaimer: The information contained herein (1) is proprietary to BCR and/or its content providers; (2) may not be copied or distributed; (3) is not warranted to be accurate, complete or timely; and, (4) does not constitute advice or a recommendation by BCR or its content providers in respect of the investment in financial instruments. Neither BCR or its content providers are responsible for any damages or losses arising from any use of this information. Past performance is no guarantee of future results.
Lebih Liputan


Pendedahan Risiko:Instrumen derivatif diniagakan di luar bursa dengan margin, yang bermakna ia membawa tahap risiko yang tinggi dan terdapat kemungkinan anda boleh kehilangan seluruh pelaburan anda. Produk-produk ini tidak sesuai untuk semua pelabur. Pastikan anda memahami sepenuhnya risiko dan pertimbangkan dengan teliti keadaan kewangan dan pengalaman dagangan anda sebelum berdagang. Cari nasihat kewangan bebas jika perlu sebelum membuka akaun dengan BCR.
BCR Co Pty Ltd (No. Syarikat 1975046) ialah syarikat yang diperbadankan di bawah undang-undang British Virgin Islands, dengan pejabat berdaftar di Trident Chambers, Wickham’s Cay 1, Road Town, Tortola, British Virgin Islands, dan dilesenkan serta dikawal selia oleh Suruhanjaya Perkhidmatan Kewangan British Virgin Islands di bawah Lesen No. SIBA/L/19/1122.
Open Bridge Limited (No. Syarikat 16701394) ialah syarikat yang diperbadankan di bawah Akta Syarikat 2006 dan berdaftar di England dan Wales, dengan alamat berdaftar di Kemp House, 160 City Road, London, City Road, London, England, EC1V 2NX. Entiti ini bertindak semata-mata sebagai pemproses pembayaran dan tidak menyediakan sebarang perkhidmatan perdagangan atau pelaburan.

 English
 简体中文
简体中文
 繁體中文
繁體中文
 Bahasa
Melayu
Bahasa
Melayu
 Tiếng
Việt
Tiếng
Việt
 ไทย
ไทย
 日本語
日本語
 한국어
한국어
 ភាសាខ្មែរ
 español