


0
Currency & Commodity Analysis:
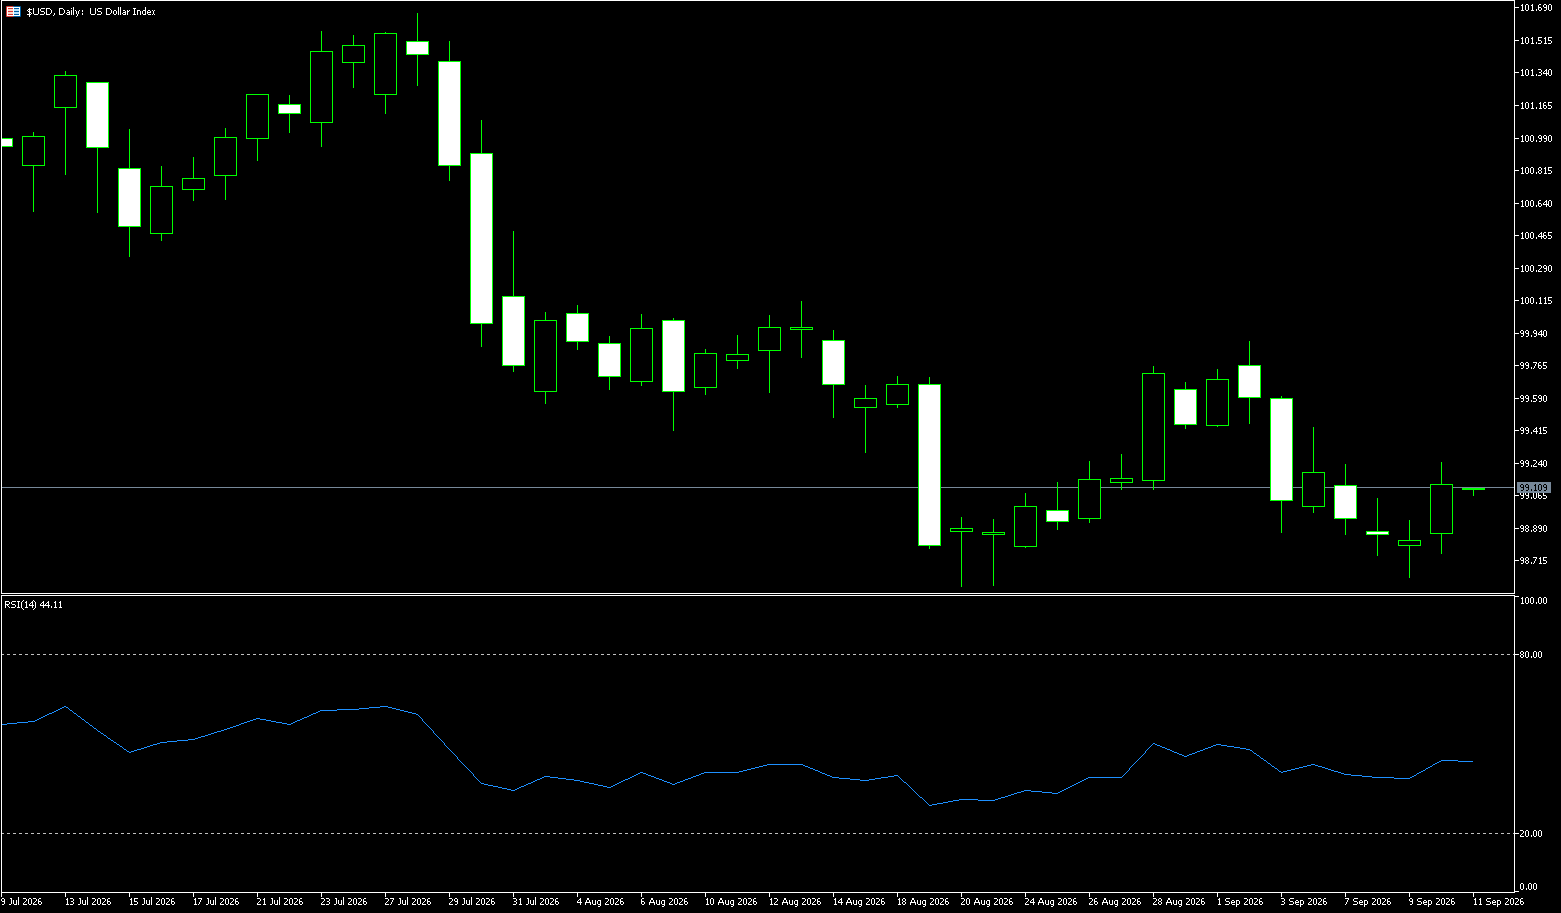
US Dollar Index
The US Dollar Index rose 0.17% on Monday to close at 102.09, having touched an intraday high of 102.53—its highest level since April 2025. Although market expectations for a Federal Reserve rate hike at the end of the month cooled significantly, the dollar was bolstered by concerns over Eurozone debt and US data indicating sticky inflation. On Tuesday, the index hovered just below the 102 mark—near its highest level since April 2025—as the euro faced pressure from mounting political uncertainty and fiscal concerns in Europe. The common currency fell as much as 0.8% on Monday due to worries over France's high debt and political gridlock, while an upcoming snap election in Spain added further headwinds. The dollar was also supported by surging Treasury yields, with long-term US bond yields hitting their highest levels in over two decades. This volatility occurred amidst a global bond sell-off driven by rising fiscal risks and persistent inflation concerns. ISM data showed that cost pressures in the US services sector rose at their fastest pace in over four years last month. Meanwhile, the market assigns a probability of approximately 78% that the Federal Reserve will keep interest rates unchanged this month, following US employment data that came in below expectations.
Supported by a still-hawkish Federal Reserve, persistent geopolitical uncertainty, and resilient US Treasury yields, the dollar began the week in a position of strength. However, inflation data—and any signs that price pressures remain stubborn enough to justify another Fed rate hike in December—will likely determine whether the dollar can extend its rally and break through current multi-month highs or if the recent upward momentum will begin to fade. Ultimately, the outlook for the dollar is no longer primarily shaped by employment data but is instead determined by the trajectory of inflation. As long as price pressures remain inconsistent with the Federal Reserve's 2% target, the US Dollar will retain its relative advantage, even if the labor market continues to cool gradually. Consequently, initial upside resistance lies at 102.53 (the week's early high) and near 102.52 (the upper Bollinger Band); should buying pressure intensify, demand could push the index toward the 103 mark. On the downside, initial support appears near Tuesday's low of 101.75, followed by the 9-day simple moving average (SMA) at 101.58 acting as deeper trend support; a more significant pullback could target the 55-day SMA near 101.48.
Consider shorting the US Dollar Index today at 101.95; Stop Loss: 102.05; Targets: 101.60, 101.50.
WTI Spot Crude Oil
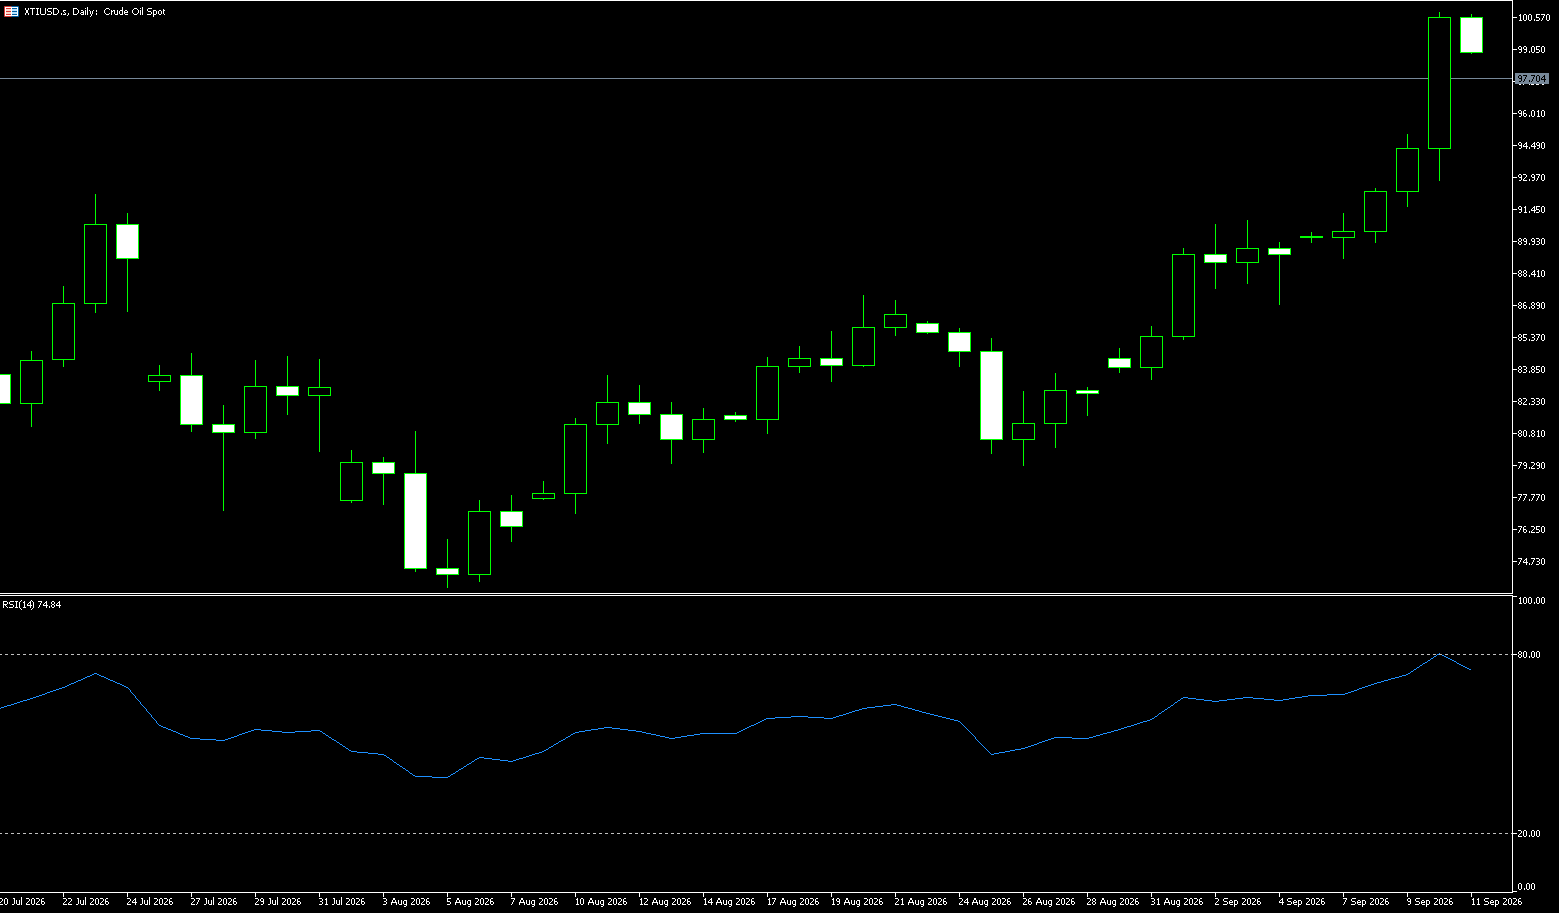
During early Asian trading on Tuesday, U.S. crude oil traded near $89 per barrel. Prices had fallen more than 2% on Monday due to increased crude exports from the Middle East and G7 pledges to boost supply; however, concerns over potential supply disruptions stemming from the conflict involving Iran persisted, limiting the decline. Shipping data indicates that for about half of September, crude export volumes from Gulf producers exceeded pre-war levels. As of September 30, the 7-day moving average of Gulf crude exports stood at 18.3 million barrels per day (bpd), with 14 days in September recording figures above pre-war levels (the average for the 12 months prior to the war was approximately 18 million bpd). Vortexa data also shows that the 14-day moving average of Middle East crude and condensate exports reached 18.6 million bpd, effectively recovering to pre-conflict levels. This growth was driven primarily by Saudi Arabia shipping crude from both Red Sea and Gulf ports, as well as Iraq loading Basra crude within the Strait of Hormuz following Iranian approval in August. However, ship-to-ship transfer capacity in the Gulf of Oman is nearing its limit, constraining further export growth.
Crude oil is currently caught in a tug-of-war between supply recovery and geopolitical risks. Factors exerting downward pressure in the short term—pushing WTI crude toward the $90/barrel mark—include the rebound of Middle East exports to pre-conflict levels, the G7's release of 100 million barrels from strategic reserves, and Saudi Aramco's reduction of selling prices for Asia. In the near term, the $90/barrel level remains a critical watershed for WTI crude: if the supply recovery trend persists, prices could face further downward pressure; conversely, should the situation in the Middle East deteriorate again or actual supply disruptions intensify, the risk premium could rapidly rebuild. Until clear signals emerge regarding US-Iran negotiations, crude oil is likely to remain range-bound, with high volatility driven by news flow expected to continue. From a technical perspective, a decisive break below the $85.63 level (Bollinger Band lower rail) and the $84.33 zone (100-day moving average) would pave the way for a further decline toward the 61.8% Fibonacci retracement level at $80.73. On the upside, a break above the $90 mark (a key psychological level) would first target $92.00 (a round-number level), followed by the resistance area near the 23.6% Fibonacci retracement level at $94.13.
Consider going long on crude oil at $89.85 today; stop-loss: $89.70; targets: $90.50, $91.00.
Spot Gold
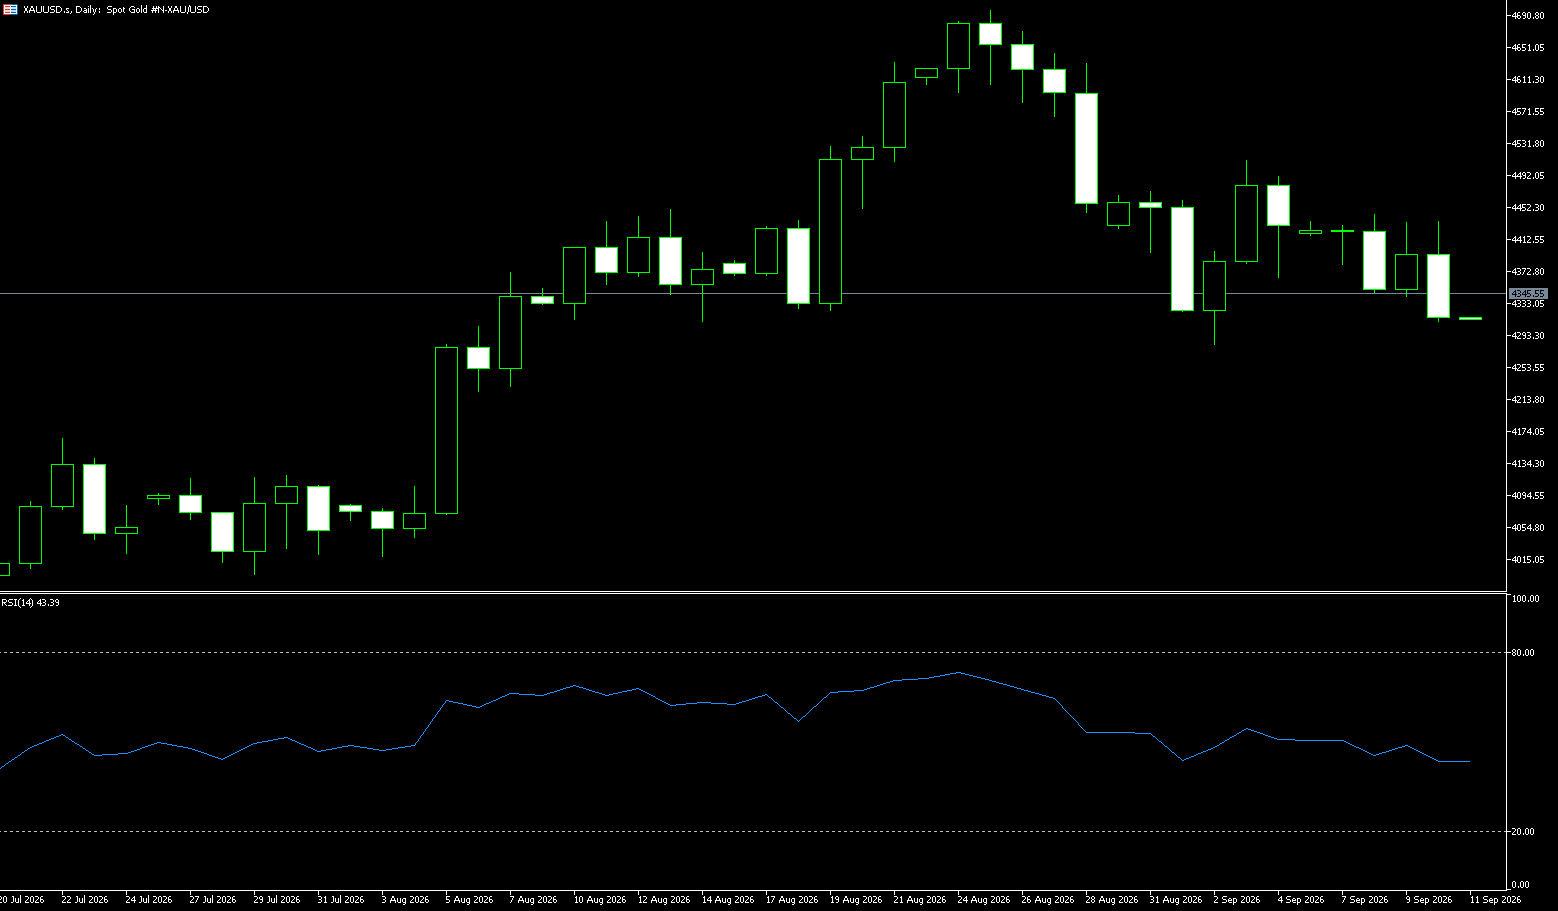
During early Asian trading on Tuesday (October 6, Beijing Time), spot gold was trading near $4,160 per ounce. Gold prices fell on Monday as pressure from a strengthening US dollar and high US Treasury yields was offset by waning market expectations for a Federal Reserve rate hike this month. In the short term, gold prices may dip before buyers step in aggressively, driven by the dollar's continued climb and persistently high yields. A rising US Dollar Index makes the dollar-denominated metal more expensive for investors holding other currencies. Gold is currently caught in a tug-of-war between bulls and bears. While the probability of an October rate hike has dropped to 22%—providing some support for gold—the likelihood of a December hike remains high at 84%, and the broader policy outlook still leans toward tightening. A strong dollar and 10-year and 30-year US Treasury yields hitting fresh 24-year highs are the primary factors weighing on gold prices. Institutional long-term forecasts for gold prices in 2027 remain... The outlook remains optimistic, though gold prices may dip in the short term before buyers enter the market in force. Key catalysts determining gold's short-term direction will include the FOMC meeting minutes and upcoming inflation data.
The 4-hour chart shows spot gold consolidating below its key moving averages, keeping the short-term bias tilted to the downside. Buyers have struggled to sustain gains above the psychological $4,200 level—a zone that closely aligns with the 50-period Simple Moving Average (SMA) at $4,197 and acts as the initial resistance. A sustained break above this area could pave the way for a test of the 100-period SMA at $4,265, followed by the $4,300 round-number mark. A decisive move above these moving averages is required to strengthen the bullish outlook. The Relative Strength Index (RSI) hovers near 39, reflecting neutral-to-weak momentum, while the Moving Average Convergence Divergence (MACD) remains slightly above zero, indicating a mild attempt at a rebound. On the downside, the psychological $4,100 level and the $4,110 mark (last week's low) provide immediate support. A clear break below these levels could intensify selling pressure and expose the $4,000–$4,050 support zone.
Consider going long on gold at $4,160 today; stop-loss at $4,155; targets: $4,195 and $4,210.
AUD/USD
During early Asian trading on Tuesday (October 6, Beijing time), spot gold traded near $4,160 per ounce. Gold prices fell on Monday as pressure from a strengthening US dollar and elevated Treasury yields was offset by waning market expectations for a Federal Reserve rate hike this month. Gold prices may decline in the short term before buyers step in en masse, driven primarily by the dollar's continued ascent and persistently high yields. A rising US Dollar Index makes the dollar-denominated metal more expensive for investors holding other currencies. Gold is currently caught in a tug-of-war between bulls and bears. While the probability of an October rate hike has dropped to 22%—providing some support for gold—the likelihood of a December hike remains high at 84%, and the broader policy outlook leans toward tightening. A strong dollar and 10-year and 30-year US Treasury yields hitting fresh 24-year highs are the primary factors weighing on gold prices. Institutional long-term forecasts for gold in 2027 remain optimistic, though prices may dip in the near term before attracting significant buying interest. Key catalysts determining gold's short-term direction will include the FOMC meeting minutes and upcoming inflation data.
The 4-hour chart shows spot gold consolidating below its key moving averages, maintaining a bearish short-term bias. Buyers have struggled to sustain gains above the psychological $4,200 level—a zone that closely aligns with the 50-period Simple Moving Average (SMA) at $4,197 and acts as the initial resistance. A sustained breakout above this area could pave the way for a test of the 100-period SMA at $4,265, followed by the $4,300 round-number mark. A decisive move above these moving averages is required to strengthen the bullish outlook. The Relative Strength Index (RSI) is hovering around 39, reflecting neutral-to-weak momentum, while the Moving Average Convergence Divergence (MACD) remains slightly above zero, indicating a mild attempt at a rebound. On the downside, the psychological level of $4,100 and the $4,110 mark (last week's low) provide immediate support. A decisive break below this level could intensify selling pressure and expose the $4,000–$4,050 support zone.
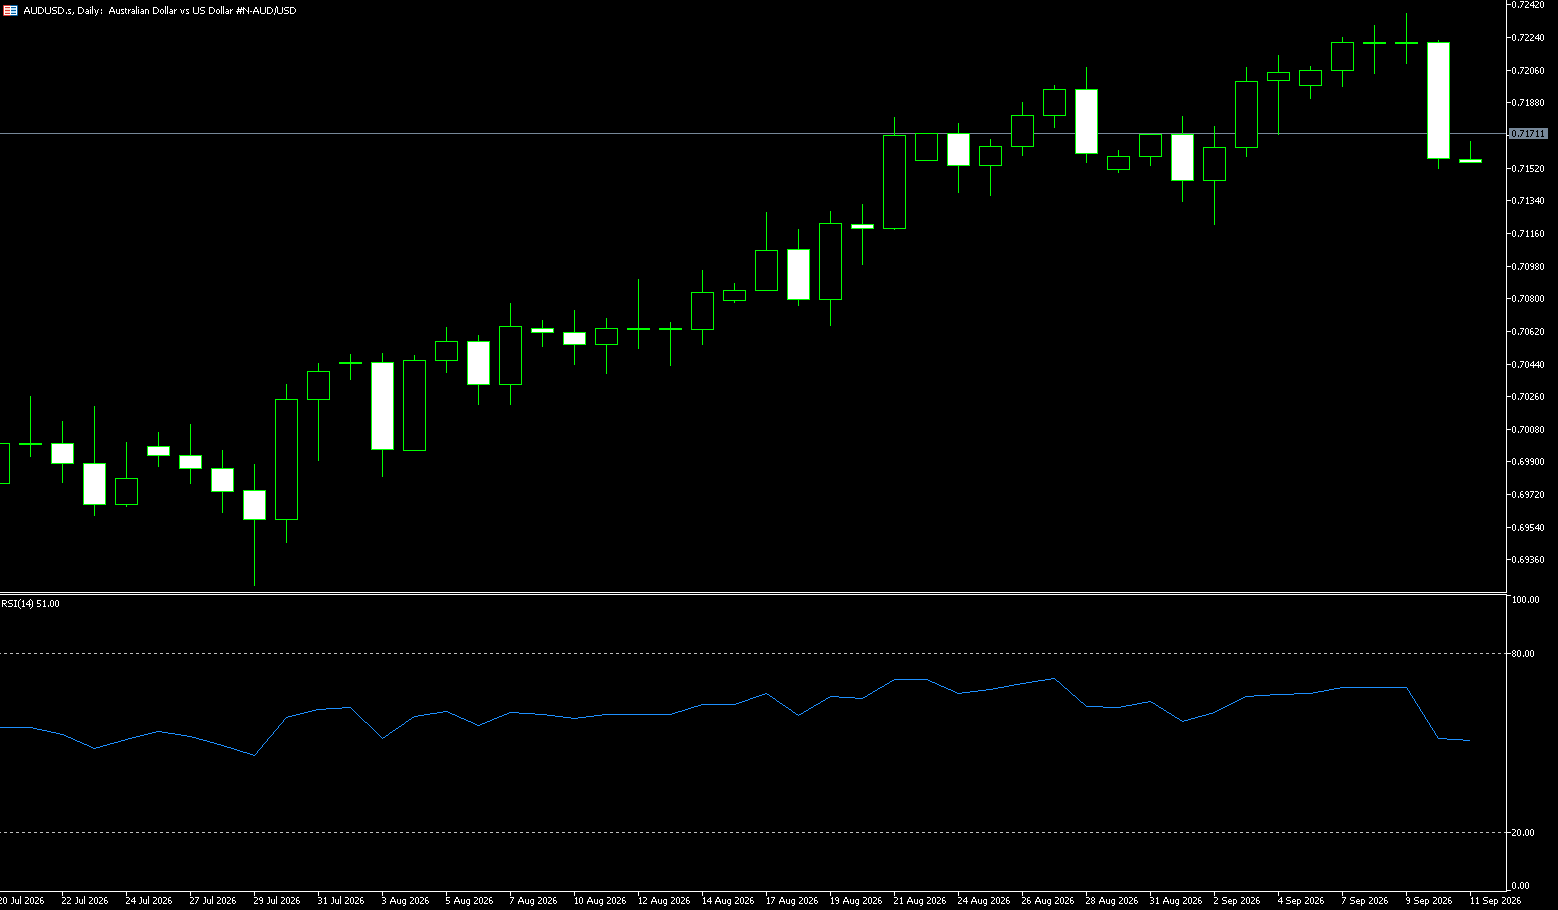
Consider going long on AUD at 0.6970 today; Stop-loss: 0.6960; Targets: 0.7030, 0.7020.
GBP/USD
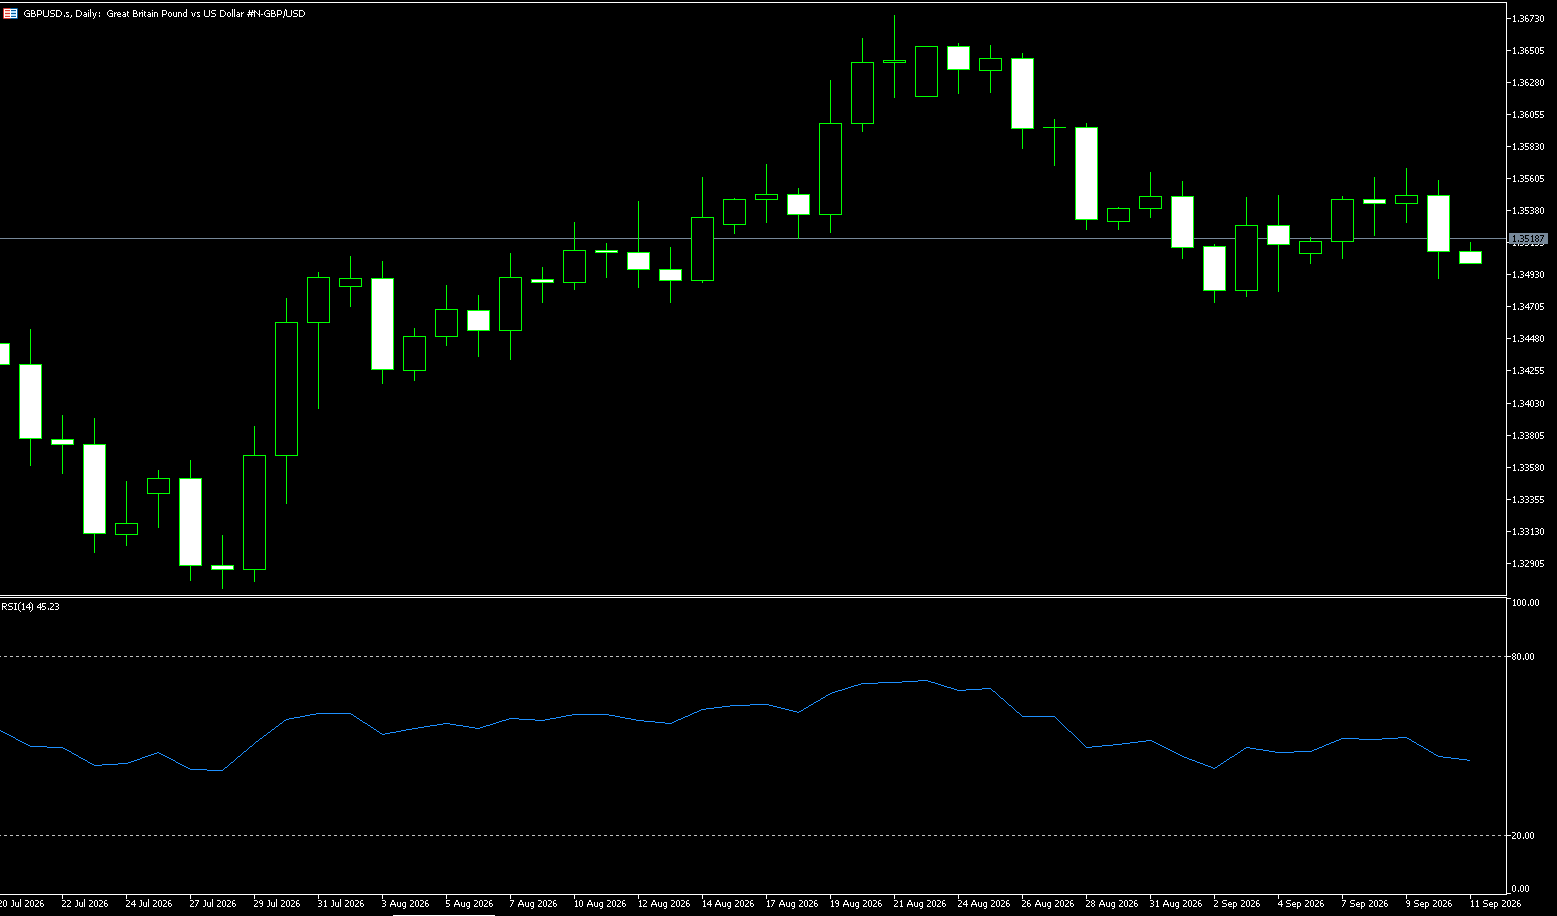
GBP/USD extended its consolidation phase during Tuesday's Asian session, trading above the 1.3250 mark and remaining within the familiar range established over the past two weeks. Investors have been pricing in a tighter monetary policy from the Bank of England—viewed as supportive for the pound—due to persistent inflation driven by elevated energy prices. Meanwhile, the US dollar took a breather following a strong rally to its highest level since April 2025, providing a tailwind for the GBP/USD pair. That said, ongoing geopolitical uncertainty and elevated US bond yields continue to underpin the dollar's bullish tone. Regarding the latest developments in the Middle East crisis, Yemen's Houthi rebels stated on Monday that they had conducted three military operations using ballistic missiles, cruise missiles, and drones against airports, oil facilities, and military targets in Saudi Arabia. Concurrently, a deepening fiscal crisis in France has triggered a sell-off in fixed-income markets, keeping US bond yields near multi-year highs. This, in turn, continues to provide a tailwind for the safe-haven US dollar and limits the upside potential for GBP/USD.
Recent range-bound price action can be characterized as a bearish consolidation phase following the decline from the August swing high. Furthermore, on the 4-hour chart, the pair is trading below the 89-period simple moving average (SMA) at 1.3293—acting as dynamic resistance—suggesting that any attempted rebound remains fragile. The 100-period SMA at 1.3316 represents a key level that bulls must clear to alleviate downward pressure and pave the way for higher levels; a breakout would target the 1.3352 level (52-period SMA). The 14-hour Relative Strength Index (RSI) is hovering near 46, indicating that downward pressure persists without the pair having entered clearly oversold territory. On the downside, a break below 1.3180 (the October 1st low) would reconfirm the bearish bias and expose the GBP/USD pair to a further decline toward the 1.3102 level (the lower Bollinger Band).
Consider going long on GBP at 1.3265 today; stop-loss: 1.3255; targets: 1.3320, 1.3330.
USD/JPY
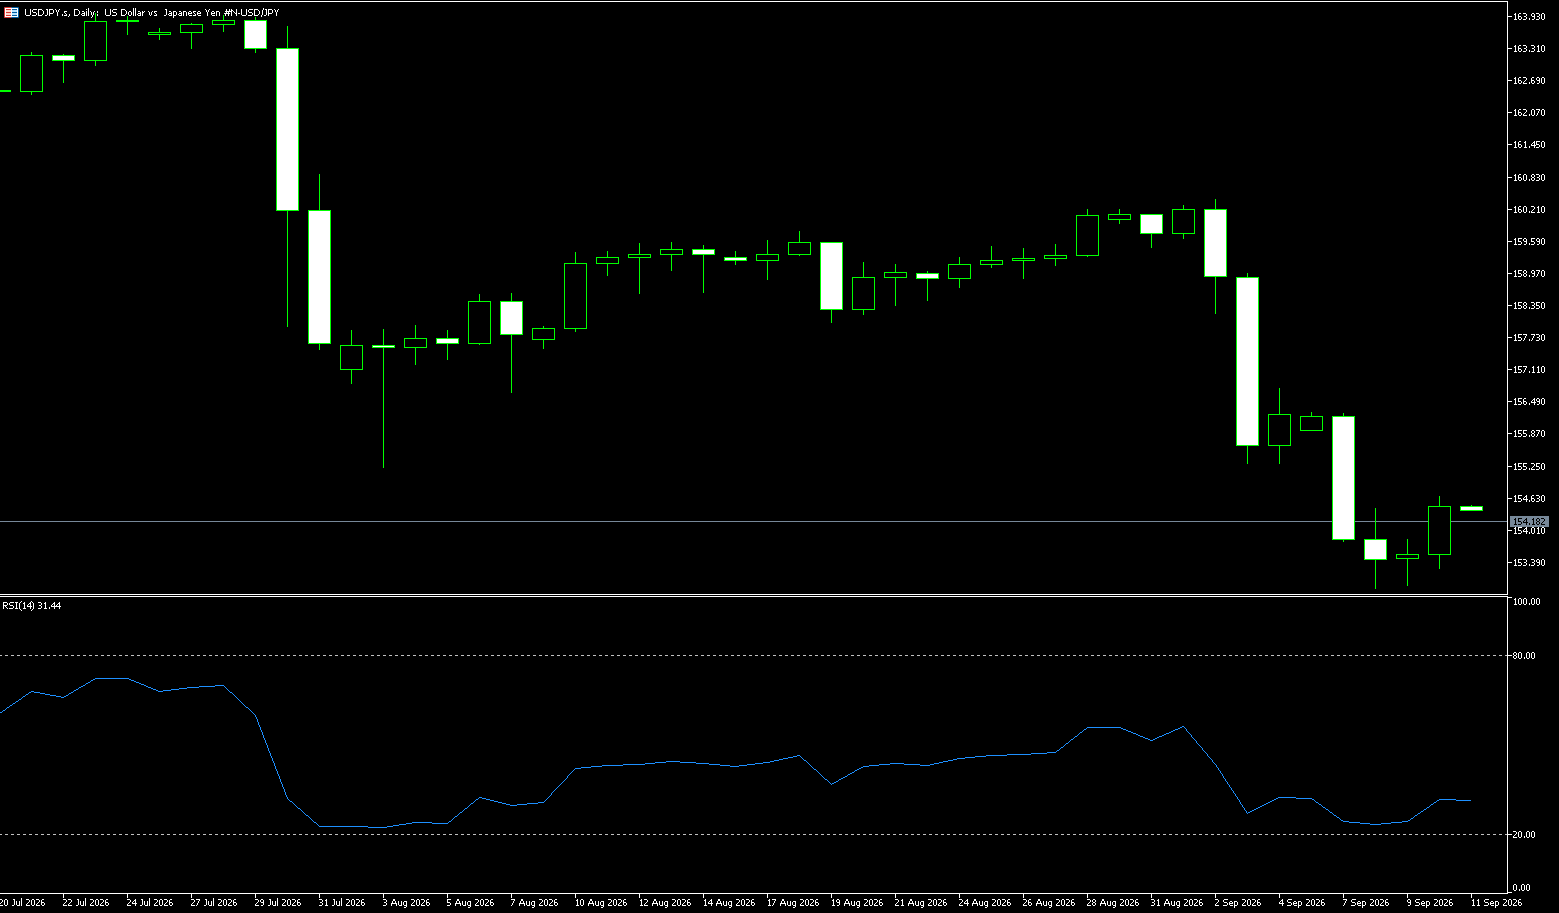
The yen traded near 158.00 against the dollar on Tuesday, remaining range-bound as Prime Minister Sanae Takaichi pushed forward with expansionary fiscal policies amidst concerns regarding currency weakness and government financing. In her parliamentary address, Takaichi pledged to lower consumption taxes on food products while emphasizing that the government would secure funding without issuing additional bonds—a move aimed at reassuring financial markets. Meanwhile, investors are awaiting a series of economic reports due this week, including August data on wages, the current account, and household spending, as well as September figures for consumer confidence and machine tool orders. Last week, the summary of opinions from the Bank of Japan's September meeting revealed growing concerns about inflation exceeding the central bank's 2% target, raising the likelihood of another rate hike this year; however, little clarity was provided regarding the timing ahead of the October and December policy meetings.
From a technical perspective, the USD/JPY pair pulled back below 158.00 to 157.90 on the daily chart, a level that coincides with the 5-day moving average at 157.86. Regarding momentum, the daily RSI has climbed to a high of approximately 82, signaling short-term overbought conditions and a reduced risk-to-reward ratio for chasing the rally; a pullback—often seen around data releases—could occur at any time. Nevertheless, unless the trend structure is broken, the prevailing theme remains an upward oscillation. The high from last Thursday, just below 158.50, constitutes the first level of resistance; a break above this would place the 159.00 psychological level as the next hurdle. On the downside, the 157.50 level attracted buying interest when the data was released, and Thursday's low held slightly above 157.00; meanwhile, the area near 156.50—where the lows from September 28 and September 30 converge—forms a key support zone.
Consider shorting the USD at 158.30 today; stop-loss: 158.45; targets: 157.50, 157.40.
EUR/USD
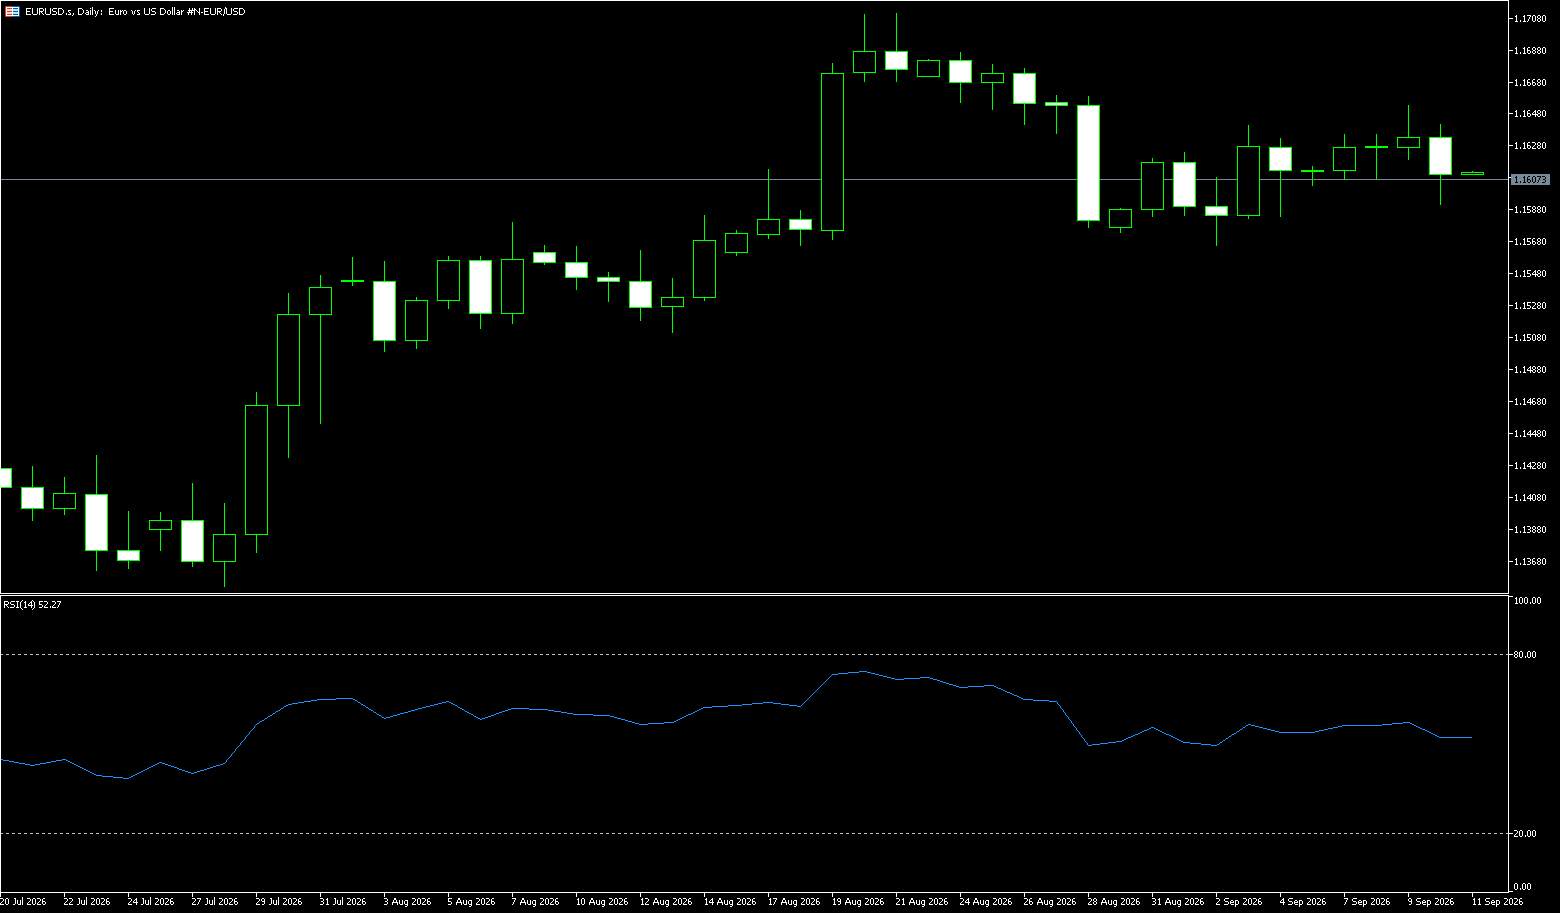
During Tuesday's session, the EUR/USD pair rebounded to around 1.1260. The Euro had previously fallen close to a 17-month low against the dollar as market concerns regarding France's debt situation intensified. Last month, the minority government announced a €54 billion cost-cutting plan to avert a catastrophic credit rating downgrade or sovereign default. France's rising debt costs have sparked anxiety as the government struggles to rein in strained public finances ahead of next year's presidential election; this has, in turn, exerted selling pressure on the Euro. Additionally, political turmoil in Spain may also weigh on the Euro. Spanish Prime Minister Pedro Sánchez has called for a snap election on November 29, aiming to bolster parliamentary support after lawmakers rejected a proposal to address the housing crisis—an issue that has triggered nationwide protests. Europe took center stage early this week as the region was buffeted by fiscal and political concerns. "France is at the center of these concerns; however, Spain is also preparing for early elections, which has heightened investor anxiety," added Catherine.
On the daily chart, EUR/USD maintains a distinctly bearish tone, remaining below both the 9-day moving average (1.1306) and the 14-day moving average (1.1358). The price is under pressure near the lower Bollinger Band, while the 14-day Relative Strength Index (RSI) hovers around 24—deep in oversold territory. This indicates persistent selling pressure but also raises the risk of a corrective rebound from nearby support levels. To the upside, initial resistance lies at the 9-day moving average (1.1306), followed by the 14-day moving average (1.1358); together, these levels form a broad ceiling for any attempted rally. To the downside, immediate support at the 1.1200 psychological level aligns with the lower Bollinger Band at 1.1190; a sustained break below this floor could push the pair further down toward the 1.1150 level in the short term.
Consider going long on EUR at 1.1250 today; Stop Loss: 1.1240; Targets: 1.1290, 1.1300.
Stock Analysis:
Australia ASX 200 Index
Market Overview:
The ASX 200 index rose 49 points (0.6%) on Tuesday to close at 8,736, marking its third consecutive day of gains. Strong US stock index futures offset pressure from rising government bond yields. Traders digested the latest US economic data while awaiting the minutes from the Federal Reserve's September meeting. Domestically, Australian job advertisements rose for the fifth consecutive month, signaling robust labor demand despite the Reserve Bank of Australia's interest rate hikes. However, consumer confidence fell for the second straight month in October, as higher fuel and borrowing costs limited upside potential. The business services, healthcare, and financial sectors led the gains; heavyweight BHP Group rose 1.5%, while Rio Tinto climbed 1.4%. Meanwhile, the "Big Four" banks saw gains ranging from 0.1% to 0.9%.
In contrast, Codan Ltd fell 4.7%, and the technology sector underperformed, with Wisetech Global down 2.9%, Nextdc down 2.5%, and Technology One down 1.9%. Investors are now focusing on September industry updates and final August building approvals.
Sector Performance:
Top Gainers: Materials (Mining) +1.0%, REITs +1.14%, Healthcare, and Banking. BHP and Rio Tinto rose, and lithium stocks strengthened; heavyweight resource stocks were the core drivers of this rally, with the Big Four banks posting modest gains.
Top Decliners: The Information Technology sector significantly underperformed the broader market; Wisetech, Nextdc, and Technology One fell as high-growth tech stocks came under pressure. Small-cap stocks were generally weak, showing a clear divergence from large-cap blue chips; this indicates that capital favors low-volatility, heavyweight stocks, and that risk appetite has not fully recovered. Technical Analysis:
The ASX 200 index opened at approximately 8715. During the session, it retraced to a low of 8699 (holding the 8700 support level) before buying interest drove a fluctuating upward trend. After hitting a high, it pulled back slightly towards the close, ultimately finishing at 8735.7—above the 20-day moving average. This "bullish recovery candle" (closing near the day's high after an initial dip) preserves the short-term rebound structure, though upward momentum was not exceptionally strong, and there were signs of profit-taking late in the session. Tuesday's close: 8735.7 (+49.3 points, +0.57%), marking a third consecutive day of gains. Following last Thursday's sharp drop, the index has rebounded for three days; this is classified as a "Wave B" rebound following a decline, rather than a trend reversal.
Technical Outlook for Wednesday (Oct 7)—Core Range & Prediction: Overall outlook is "fluctuating with a bullish bias," but this remains a rebound rally facing heavy overhead resistance; the primary expectation is an initial rise followed by range-bound trading under pressure, rather than a massive one-sided rally. Support: 8690–8700; Strong Resistance: 8810 (200-day moving average, a critical watershed level). Scenario A (Bullish bias, moderate probability): Holds 8700 support at the open and tests 8780; a breakout above 8780 on high volume would lead to a challenge of the 8810 level. Prerequisites: US stock futures and iron ore/commodities remain strong, and the AUD/USD exchange rate does not surge rapidly (which would weigh on resource stocks). The 8810 level acts as the medium-term watershed for strength vs. weakness; only by firmly establishing itself above 8810 would the medium-term bearish outlook shift, opening the way to 8850. A mere touch of 8810 would likely result in resistance and a pullback. Scenario B (Oscillation and Pullback – Baseline Scenario): Oscillating within the 8700–8780 range; facing resistance and pulling back after an initial rise. Profit-taking following three consecutive rebounds makes a pullback likely; expect a close as a small bearish candle or a Doji. Scenario C (Weakening and Breakout – Bearish Scenario): A direct drop below 8690 with a close beneath that level signals the failure of the current rebound; the index will retest 8666, with a further target of 8603. Trigger conditions: Rising US Treasury yields, hawkish Federal Reserve minutes, or a sharp drop in iron ore prices.
Trading Strategy (Short-term Perspective)
Range Trading Approach (Primary Strategy – Currently Most Suitable)
Bullish Strategy
• Entry (Long): Consider a light long position only after the price pulls back to the 8700–8690 range, stabilizes, and prints a reversal/stabilization candlestick.
• Take Profit: First target 8770–8780; second target 8805–8810 (reducing position size is recommended near 8810).
• Stop Loss: Exit if there is a decisive break below 8680 (e.g., closing below the level or a large bearish candle piercing through).
Bearish Strategy (Betting on the End of the Rebound)
• Entry (Short): Consider a light short position if the rebound stalls in the 8770–8780 zone (facing resistance, long upper shadows, or signs of stalling momentum).
• Take Profit: 8720; second target 8690.
• Stop Loss: Exit if the price rises above 8810. Key Risk Warnings:
1. External Fundamental Risks (Major Variable): Focus on the Federal Reserve's September meeting minutes this Wednesday. A hawkish tone leading to rising US Treasury yields would directly weigh on global risk assets, putting pressure on the ASX 200. Fluctuations in iron ore and commodity prices directly impact heavyweight mining stocks, causing index volatility. A rapid appreciation of the Australian dollar could dampen earnings expectations for the resources sector.
2. Technical Risks: The current market movement is characterized as a corrective rebound following a decline rather than the start of a new upward trend; the rebound could end at any time, so do not mistake it for a trend reversal and take heavy long positions. There is a divergence between small-cap stocks and large-cap blue chips; an index rise does not imply a broad rally across individual stocks.
3. Trading Risks: Leveraged stock index trading involves high volatility and significant overnight gap risk. The Australian market opening is influenced by overnight US market movements, making it susceptible to price gaps that could instantly breach stop-loss levels. Strict position management is essential; avoid taking excessively large positions in a single trade.
Shanghai Composite Index (China)
Market Overview:
On Tuesday, the Shanghai Composite Index rose 0.31% to close at 3,842.2 points, while the Shenzhen Component Index fell 0.11% to 12,887.6 points, as the latest stimulus measures failed to significantly boost investor confidence. Policymakers introduced mortgage subsidies and expanded central bank funding support, while the State Council pledged to roll out a "package of practical and effective additional policies." Although these represent China's most significant stimulus measures since September 2024, investors are still seeking stronger support to address persistent weakness in domestic demand. Meanwhile, the latest official and private PMI data provided some reassurance to investors.
Industrial and Commercial Bank of China (+1.35%) and Kweichow Moutai (+1.81%) led the gains, while NAURA Technology (-2.06%) and Suzhou Dongshan Precision (-2.15%) lagged behind. For the month of September, the Shanghai Composite Index fell 3.61%, and the Shenzhen Component Index dropped 8.04%. China's financial markets will be closed from October 1 to October 7 for the National Day holiday.
Sector Performance:
Top Gainers (Defensive positioning + recovery from lows): Banking and Insurance (heavyweight financial sectors that provide market support; capital flocks to low-valuation, high-dividend stocks when the index is under pressure); Oil/Petrochemicals and Coal (resource-based defensive plays; safe-haven inflows driven by geopolitical tensions); Utilities and High-Dividend sectors (risk aversion, low volatility); Selected Innovative Drugs and low-valuation pharmaceutical sub-sectors (rebound from oversold levels, betting on valuation recovery).
Top Losers (Risk of selling pressure): High-flying Semiconductor and AI Computing themes (significant prior gains and crowded positioning make them prone to profit-taking amid shrinking volume); Non-ferrous Metals and Rare Earths (fluctuations linked to commodities and external market expectations); Autos and high-valuation Consumer sub-sectors (profit-taking pressure).
Technical Analysis:
Review of Tuesday's technical trends (Candlesticks, Volume, and Price): The index showed a weak, fluctuating trend on Tuesday, testing lower support levels multiple times during the session. It closed with a small bearish candle or a "Doji" pattern. Trading volume contracted compared to the previous session—a characteristic of a "zero-sum game" (trading within existing funds)—reflecting a "wait-and-see" sentiment and a lack of fresh capital to fuel a rebound. Short-term Moving Averages: The index traded below the 5-day moving average; the 5-day and 10-day averages exerted bearish pressure, creating a resistance zone overhead. Market Structure: While sectors providing market support offered some resistance, thematic sectors saw rapid rotation and poor sustainability. Rallies faced immediate selling pressure and pullbacks; the market exhibited typical low-volume oscillation and weak, defensive characteristics. Short-term Support: Near previous lows, serving as the critical battleground for bulls and bears this week. Core Conclusion (Tuesday): The index is experiencing weak oscillation on low volume with no signal of a bottoming-out reversal. It is in a "bottom-grinding" phase following a decline, with a tug-of-war between bulls and bears near support levels; any rebound requires confirmation via increased trading volume. Wednesday Technical Outlook & Scenario Analysis — Core Scenario Predictions: **Bullish Scenario (Low Probability)** – The index stabilizes after pulling back to support in early trading, rises above the 5-day moving average on increased volume, and the KDJ indicator forms a "golden cross." It challenges the resistance of the 20-day moving average, entering a short-term rebound/recovery phase. **Prerequisites:** Significant increase in trading volume; simultaneous strengthening of heavyweight stocks and thematic sectors. A rebound without volume is viewed as a "bull trap." **Base-Case Scenario (Highest Probability)** – Continued narrow-range oscillation; repeated testing of support levels; the index fluctuates between the support level and the 5-day moving average. Trading volume remains sluggish; sectors rotate rapidly; focus on individual stocks rather than the overall index. Indicators remain flat at low levels, awaiting a clear directional move. **Bearish Scenario** – Decisive break below key support levels, closing below support; a decline accompanied by increased volume opens up room for a new round of correction; MACD green bars expand again.
Trading Strategy:
1. **Long Position Conditions (Buy on dips; do not chase highs)**
• Pullback to the 3820 area; intraday lows are not breached; no significant volume-driven sell-off. Consider a small test position; prioritize defensive sectors such as undervalued high-dividend stocks, banking, or oil & gas.
• **Entry/Stop-loss:** Exit immediately if the price drops below 3800; do not hold losing positions.
2. **Position Reduction / Wait-and-See Conditions**
• Price surges toward 3860 but volume fails to keep pace; signs of "stalled rally on high volume" or long upper shadows appear—reduce positions to lock in profits.
• Market opens high and surges immediately without incremental capital inflow—do not chase; high risk of a subsequent pullback.
Key Risk Warnings:
1. **Volume Risk:** Persistent low volume limits the sustainability of any rebound; prices are prone to falling back after a spike, and "bottom-fishing" carries a high risk of getting trapped.
2. **External Disturbances:** Volatility in overseas markets, exchange rates, and commodities can spill over into the A-share market, triggering rapid intraday gap movements. 3. Technical Trap: A "doji" candlestick at a low level or an intraday rebound from a low—occurring amidst shrinking trading volume—likely represents mere resistance rather than a bottom reversal; do not conclude that a market bottom has been reached based on a single candlestick.
Disclaimer: The information contained herein (1) is proprietary to BCR and/or its content providers; (2) may not be copied or distributed; (3) is not warranted to be accurate, complete or timely; and, (4) does not constitute advice or a recommendation by BCR or its content providers in respect of the investment in financial instruments. Neither BCR or its content providers are responsible for any damages or losses arising from any use of this information. Past performance is no guarantee of future results.
More Coverage






2026 © - All Rights Reserved by BCR Co Pty Ltd
Risk Disclosure:Derivatives are traded over-the-counter on margin, which means they carry a high level of risk and there is a possibility you could lose all of your investment. These products are not suitable for all investors. Please ensure you fully understand the risks and carefully consider your financial situation and trading experience before trading. Seek independent financial advice if necessary before opening an account with BCR.
BCR Co Pty Ltd (Company No. 1975046) is a company incorporated under the laws of the British Virgin Islands, with its registered office at Trident Chambers, Wickham’s Cay 1, Road Town, Tortola, British Virgin Islands, and is licensed and regulated by the British Virgin Islands Financial Services Commission under License No. SIBA/L/19/1122.
Open Bridge Limited (Company No. 16701394) is a company incorporated under the Companies Act 2006 and registered in England and Wales, with its registered address at Kemp House, 160 City Road, London, England, EC1V 2NX. Open Bridge Limited acts solely as a payment processor for BCR Co Pty Ltd and does not provide any financial, trading, or investment services on its behalf. Open Bridge Limited's role is limited to payment processing.


 English
 简体中文
简体中文
 繁體中文
繁體中文
 Bahasa
Melayu
Bahasa
Melayu
 Tiếng
Việt
Tiếng
Việt
 ไทย
ไทย
 日本語
日本語
 한국어
한국어
 ភាសាខ្មែរ
 español