


0
Currency & Commodity Analysis:
US Dollar Index
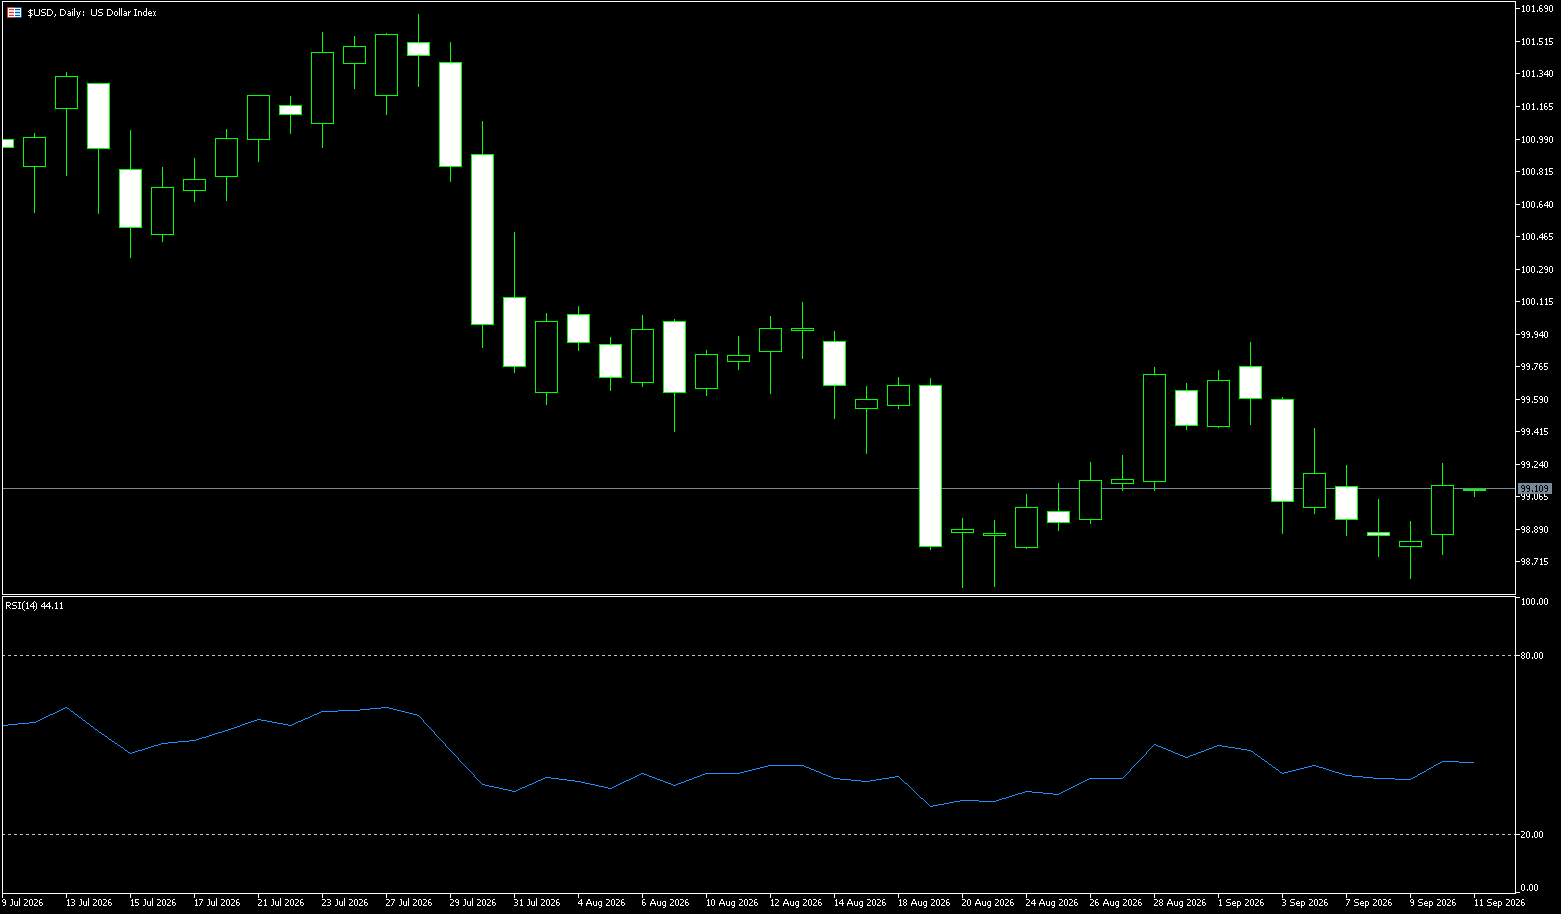
The US Dollar Index stabilized above the 102 level on Wednesday, having faced downward pressure during the previous trading session. Traders are also monitoring comments from Federal Reserve officials; following the release of lower-than-expected Personal Consumption Expenditures (PCE) inflation and employment data last week, policymakers have increasingly hinted at a more dovish stance regarding interest rates. Markets currently assign a probability of nearly 80% to the Fed keeping policy unchanged this month. Meanwhile, investors remain focused on the bond market following a recent sell-off driven by concerns over persistent inflation, rising fiscal risks, and high levels of AI-related debt issuance. Overall, the US dollar is caught in a tug-of-war between "cooling policy expectations" and "solid fundamental support": although the probability of a Fed rate hike in October has dropped to around 20%, the market has priced in an approximately 85% chance of a hike before year-end. Coupled with elevated US Treasury yields, demand for geopolitical safe-haven assets, and fiscal concerns in Europe, these factors underpin the dollar's strength; the short-term bullish outlook remains intact after the index reclaimed the 102 mark.
From a technical perspective, the US Dollar Index maintains a short-term bullish structure on the daily chart. The 101.75–101.65 zone—previously a resistance level that was broken—has now transformed into support, with the overnight technical pullback finding buying interest precisely in this area. The 14-day RSI stands at 69.58, indicating strong buying momentum but also signaling that the index has entered overbought territory, suggesting that the short-term rally could pause or undergo a shallow pullback at any moment. Regarding resistance, the initial level is 102.54 (Monday's high); a breakout here could pave the way to challenge the 103.00 psychological mark. On the support side, the 101.75–101.65 range serves as the first line of defense, followed by the area near 101.40, with stronger support located at the 101.00 psychological level. On the 4-hour chart, the index reclaimed the 102.00 level after rebounding from near 101.76, and short-term momentum indicators have turned upward again after retreating from highs. If the FOMC minutes lean hawkish and drive a break above 102.54, the upward trend will be confirmed; conversely, if the minutes lean dovish, the index may pull back to test the 101.75–101.65 support zone.
Consider shorting the US Dollar Index at 102.40 today; stop-loss: 102.50; targets: 101.90, 101.80.
WTI Spot Crude Oil
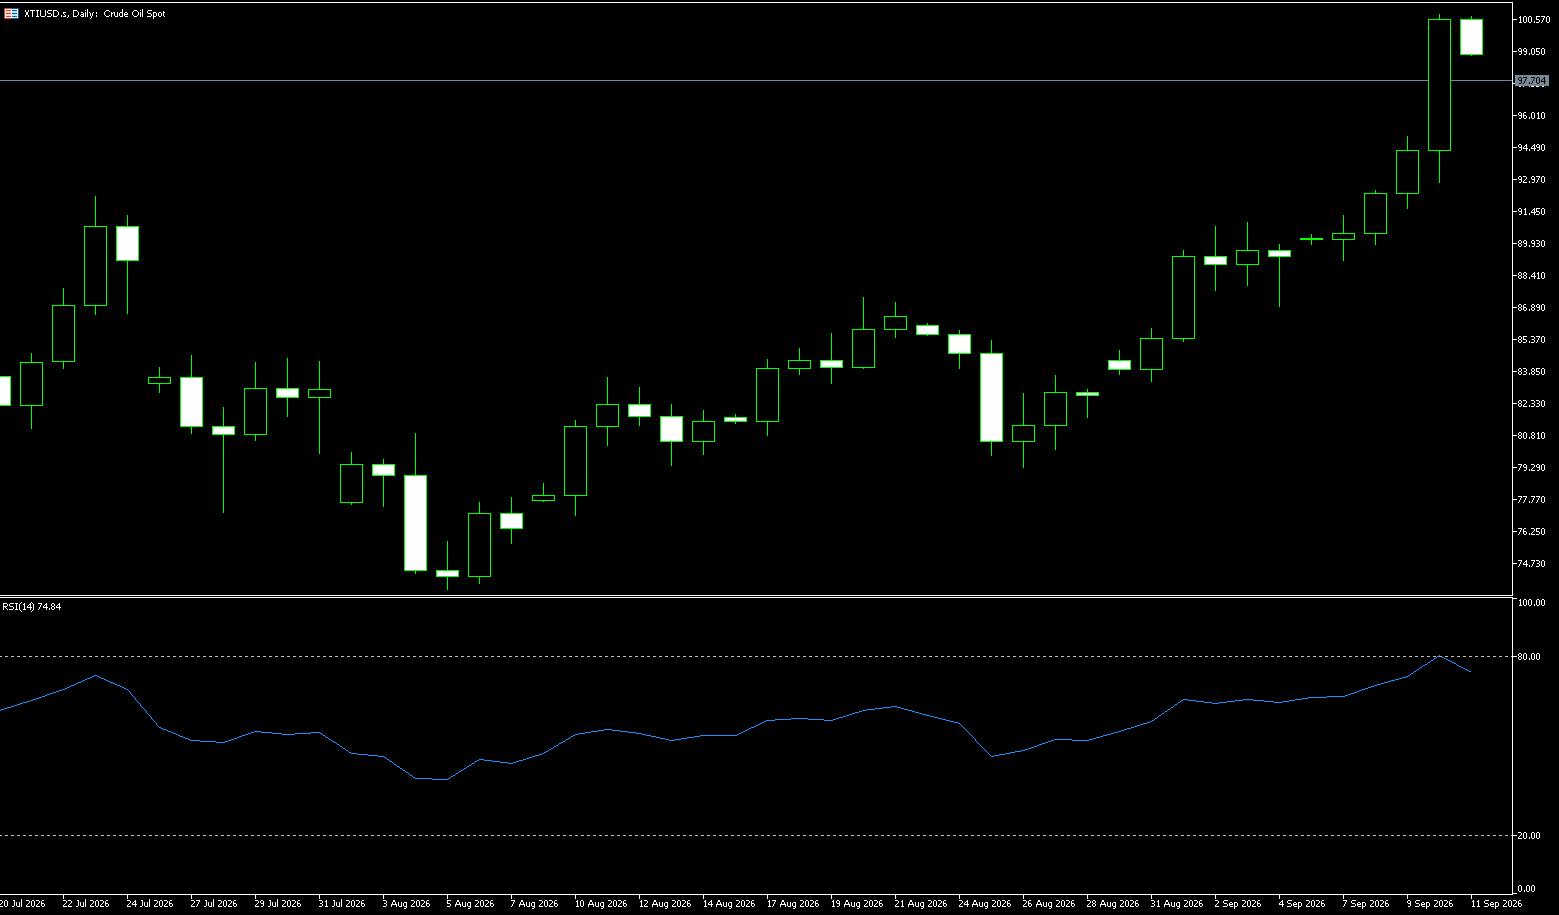
Crude oil prices broke above $89 per barrel on Wednesday, rebounding from five-week lows, as persistent risks to Middle East energy flows overshadowed signs of rising supply in the region. The underlying supply-demand dynamics of the oil market are far more nuanced than simple flow figures suggest. Overall, the oil market is caught in a fierce tug-of-war between a "geopolitical risk premium" and the reality of supply recovery. Reports of increasingly frequent tanker attacks near the Strait of Hormuz continue to provide risk-related support for prices, while the rapid restoration of pipeline capacity and rebounding Gulf flow volumes repeatedly cap gains; consequently, WTI prices remain locked in a battle around the $90 mark. Looking ahead, the short-term direction hinges on the relative strength of these opposing forces: should conflict escalate further or a substantial supply disruption occur, WTI could break above $90.50 and challenge levels beyond $93.00. Conversely, if pipeline capacity is fully restored and flow volumes continue to rise—compounded by bearish demand-side factors—prices could retreat to $87.00 or lower.
From a technical perspective, WTI is consolidating within the $87.50–$90.50 range on the daily chart, with the price center shifting lower from the previous week's highs above $93.00; short-term moving averages are intertwined, signaling an undecided trend. The RSI has flattened after retreating from overbought territory to a neutral zone, indicating a temporary balance between bulls and bears and a lack of directional momentum. Regarding resistance, the $90.50 level represents a zone of heavy selling pressure from the recent rebound; a decisive break above this could pave the way to retest $91.50 or even $93.50 (the early October high). On the support side, immediate support lies near this week's low of $88.50, followed by the $87.00 psychological level, with stronger support situated around $85.50 (the 110-day moving average). On the 4-hour chart, the price has established a pattern of higher lows following the rebound from $87.60, and short-term momentum indicators are operating in bullish territory; a high-volume breakout above $90.50 could extend the short-term rally, whereas a failure to break through—followed by a drop below $88.50—could lead to a retest of the $87.00 support level.
Consider going long on crude oil at 88.20 today; stop-loss: 88.00; targets: 90.00, 91.00.
Spot Gold
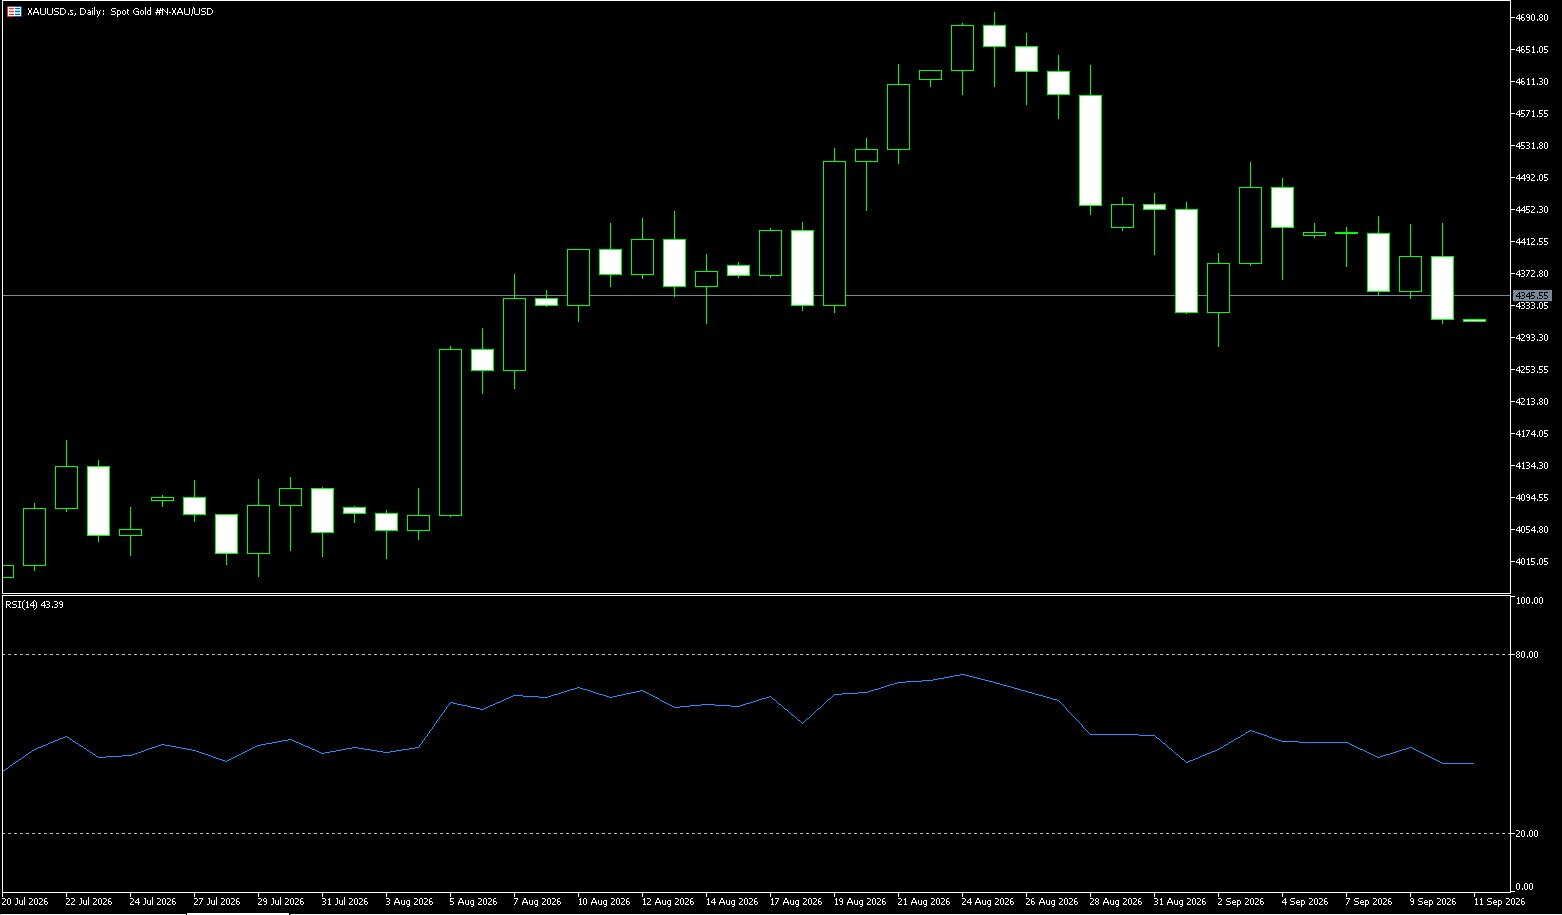
Gold maintained a bearish intraday bias during early European trading on Wednesday, with attention focused on the two-month low near $4,100 touched the previous day. Renewed buying interest in the US dollar following Tuesday's pullback is seen as a key factor weighing on the commodity, as traders await the FOMC meeting minutes for fresh impetus. US macroeconomic data released last week indicated a slowdown in inflation and a slight cooling of the labor market, easing pressure on the Federal Reserve to raise interest rates. However, the CME Group's FedWatch tool shows that traders anticipate an approximately 85% probability of a rate hike by the US central bank in December. Consequently, the market is looking to the upcoming FOMC minutes for clues regarding further rate hikes and policy signals, which will play a pivotal role in driving the US dollar and non-yielding gold.
The recent range-bound price action since early last week can be characterized as a bearish consolidation phase, following the retreat from August's monthly highs. Furthermore, on the 4-hour chart, gold remains below the 50-period simple moving average (SMA) at $4,171 and the 61.8% Fibonacci retracement level, reinforcing the negative outlook. Meanwhile, the Moving Average Convergence Divergence (MACD) remains in positive territory with a reading of 3.35, suggesting mild bullish momentum. However, the Relative Strength Index (RSI) stands at 41.67—a relatively low level—indicating that any rebound is likely to face resistance while the precious metal remains capped by these overhead levels. However, before anticipating a further decline to the more significant structural support level of $3,938, one should exercise caution and wait for the price to break and firmly establish itself below $4,100—a level marking both the lower boundary of the trading range and the 78.6% Fibonacci retracement. On the upside, immediate resistance lies at the 61.8% retracement level of $4,228, followed by the 100-period simple moving average at $4,247 and the 50% retracement level at $4,317. Only a sustained breakout above this cluster of resistance levels would alleviate the current bearish tone.
Consider going long on gold today at $4,105, with a stop-loss at $4,100 and targets at $4,150 and $4,160.
AUD/USD
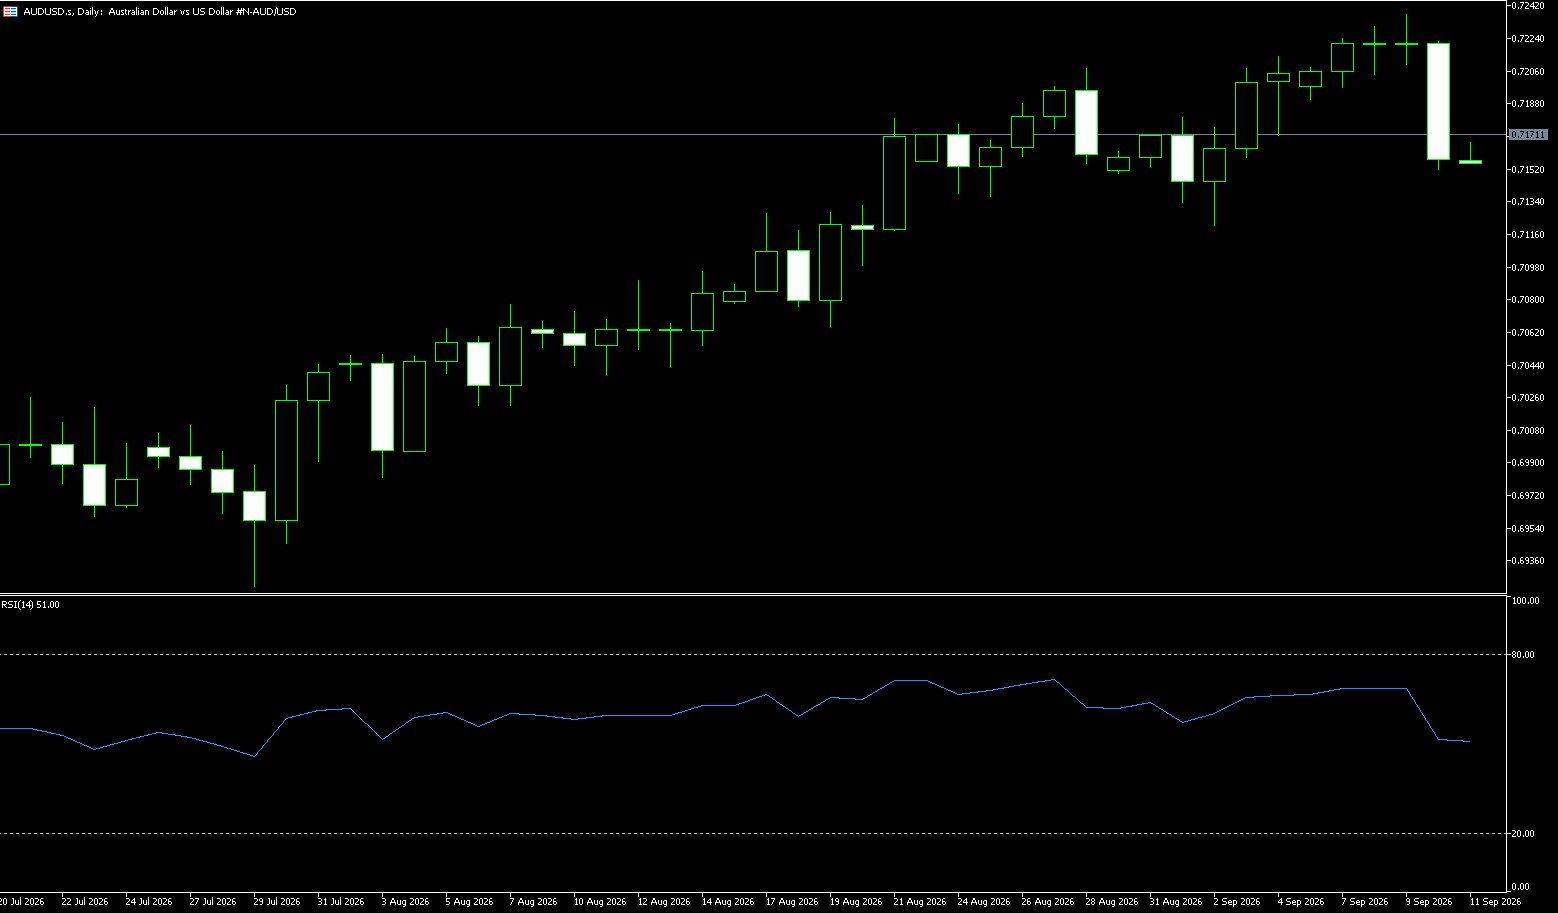
After a three-day rebound, the Australian dollar remains just below the $0.70 mark as investors await updates from key central banks for clues regarding the policy outlook. The Federal Reserve is set to release the minutes of its September meeting this week and hear from several policymakers; the market currently assigns an approximately 80% probability to no rate hike this month, following a labor market report that fell short of expectations. Meanwhile, the Australian dollar has found some support amidst broad US dollar weakness—particularly against the euro, which has seen the sharpest decline as pressure in European bond markets eased. Domestically, Australian consumer confidence fell for the second consecutive month in October, as higher borrowing costs squeezed household finances and exacerbated cost-of-living pressures. Markets now estimate a 75.7% probability that the Reserve Bank of Australia (RBA) will hold interest rates steady in November, with a 24.3% chance of another hike. Next week, market attention will shift to the RBA's meeting minutes for further policy signals.
On the daily chart, AUD/USD is trading at 0.6970, maintaining a short-term bearish bias as the spot price remains below the long-, medium-, and short-term simple moving averages (SMAs). Resistance at the 0.7100 round-number level suggests that the current rebound remains capped; meanwhile, the Relative Strength Index (RSI-14) hovers near 36, keeping downside momentum in focus, while the Average Directional Index (ADX) sits at 39, indicating a strengthening trend. To the downside, initial support is found near the 0.6932 level (5-day SMA), followed by a deeper floor at the 0.6900 round-number level. To the upside, immediate resistance is defined by the 0.7000 psychological level and the 200-day SMA at 0.7034, followed by the 100-day SMA level at 0.7052.
Consider going long on AUD at 0.6950 today; Stop Loss: 0.6940; Targets: 0.7000, 0.7010.
GBP/USD
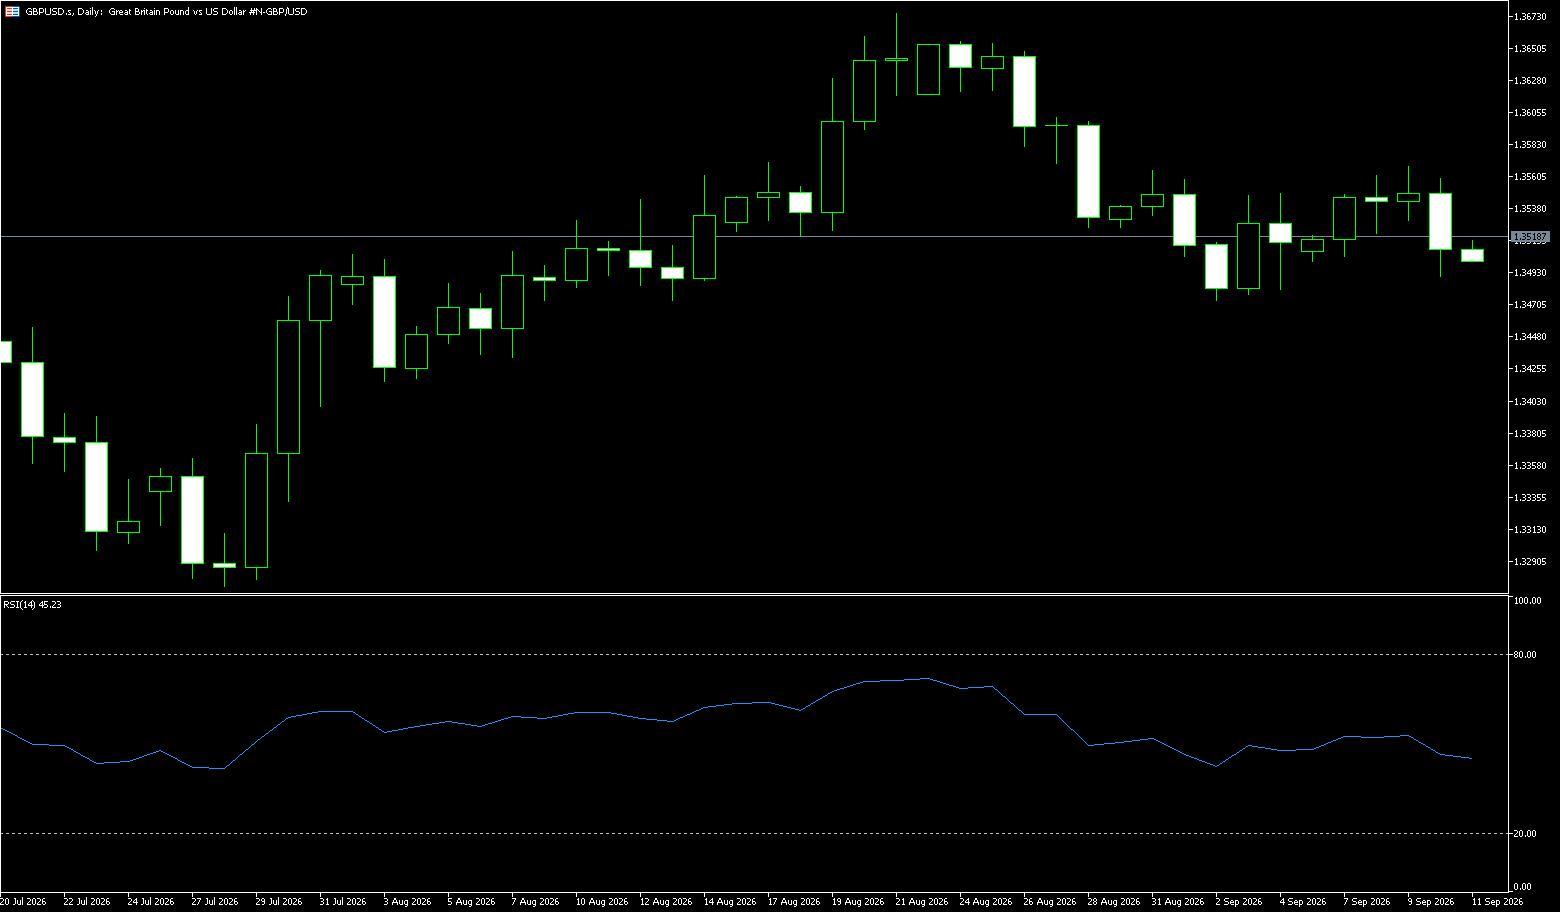
GBP/USD declined during the early European session on Wednesday, trading near 1.3220. The US Dollar outperformed the British Pound, placing the pair under pressure. Currently, the CME FedWatch Tool indicates an approximately 81% probability that the Federal Reserve will keep interest rates unchanged at its policy meeting later this month. Financial markets have recently scaled back hawkish bets on the Fed due to weak September non-farm payroll data and signals from the Fed that there is no urgent need for further rate hikes. While a rebound in oil prices—sparking inflation concerns—has provided support to the US Dollar, GBP/USD retreated to around 1.3235 during the Asian session on Wednesday, giving back some of the gains made in the previous trading day. Bank of England policymaker Mann warned that inflation has become "embedded" in the UK economy and could rise to 4% around year-end, providing some support for the pound. Downside potential for the pound is constrained by two factors: first, unexpectedly weak US non-farm payroll data for September continues to dampen market pricing for a Federal Reserve rate hike in October, meaning the US dollar's interest rate advantage may not necessarily widen further; second, domestic inflationary pressure in the UK is providing "policy support" for the currency.
From a technical perspective, the GBP/USD pair maintains a bearish tone on the daily chart. The exchange rate remains capped by the cluster of moving averages formed by the 14-day MA (approx. 1.3265) and the 20-day MA (approx. 1.3323), with prices continuing to drift lower beneath them. The 14-day RSI stands at 38.30—below the 50 midline—indicating that downward pressure persists rather than signaling an imminent reversal. Regarding resistance, the psychological 1.3300 level acts as the first hurdle, with denser technical resistance located at the 20-day MA (1.3323); as long as the pair trades below this cluster, any rebound is likely to face selling pressure. Only a daily close above 1.3394 (the 30-day MA) would invalidate the current downtrend. On the support side, the recent low zone and the 1.32 round number form the downside defense; a breach of this area could lead to a test of the 1.3150 level.
Consider going long on GBP at 1.3202 today; Stop Loss: 1.3190; Targets: 1.3250, 1.3260.
USD/JPY
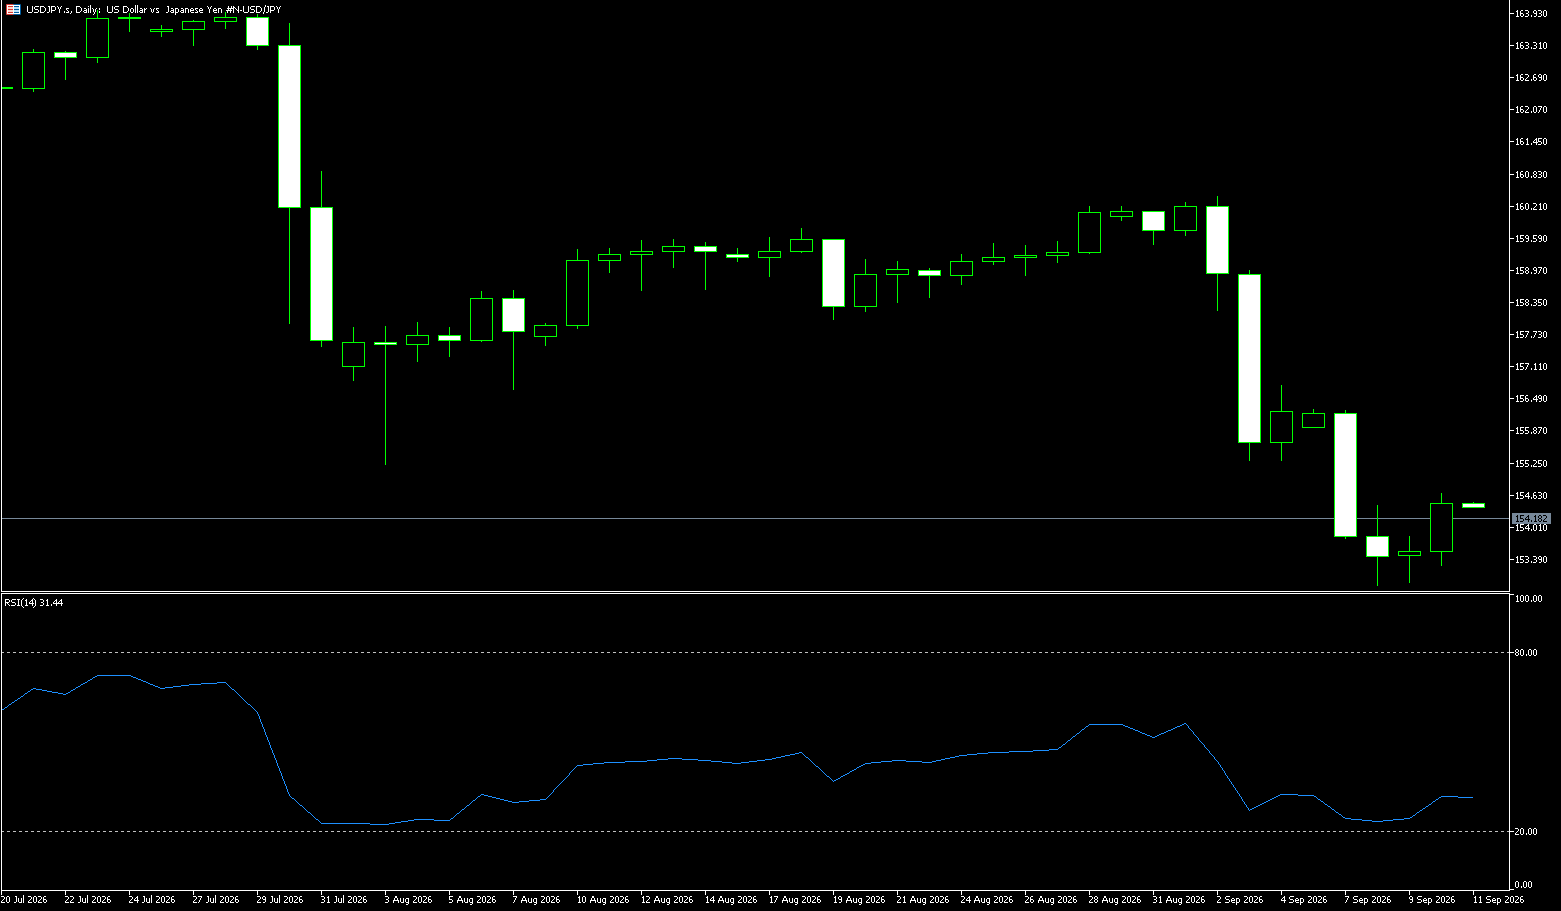
The Japanese yen depreciated to around 158.10 per dollar on Wednesday—nearing a two-week low—as the yield spread between the US and Japan continued to favor the greenback. The currency remains under pressure due to low domestic interest rates and Japan's heavy debt burden, alongside calls for expansionary fiscal policy. In a parliamentary speech, Sanae Takaichi pledged to cut consumption taxes on food products while emphasizing that the government would secure funding without issuing additional bonds, aiming to reassure financial markets. Meanwhile, data showed Japan's real wages rose 1.5% year-on-year in August—marking the eighth consecutive month of growth—which further bolstered market expectations for a Bank of Japan rate hike. Bank of Japan board member Ayano Sato also expressed support for a gradual, phased increase in interest rates.
From a technical perspective, on the daily chart, the USD/JPY pair remains constrained by the resistance zone formed by the 89-day moving average (approx. 158.90) and the September 24 high (approx. 159.04), having faced resistance there multiple times. The 14-day RSI stands at 555, indicating moderately bullish momentum that has yet to break the bearish structure defined by the long-term moving average; overall, the pair remains in a range-bound pattern. Regarding resistance, the area around the 9-day moving average (approx. 158.90) and the September 24 high (approx. 159.04) serves as the initial barrier, followed closely by the upper Bollinger Band at 159.77. On the support side, the 14-day moving average at 157.73 provides immediate support, with a stronger defense at the 157.00 psychological level; should selling pressure regain dominance and push the price below the recent 157 mark, the pair could head toward the 156.50 area—where the lows from September 28 and September 30 converge—forming a key support zone.
Consider shorting the USD at 158.25 today; stop-loss: 158.45; targets: 157.50, 157.40.
EUR/USD
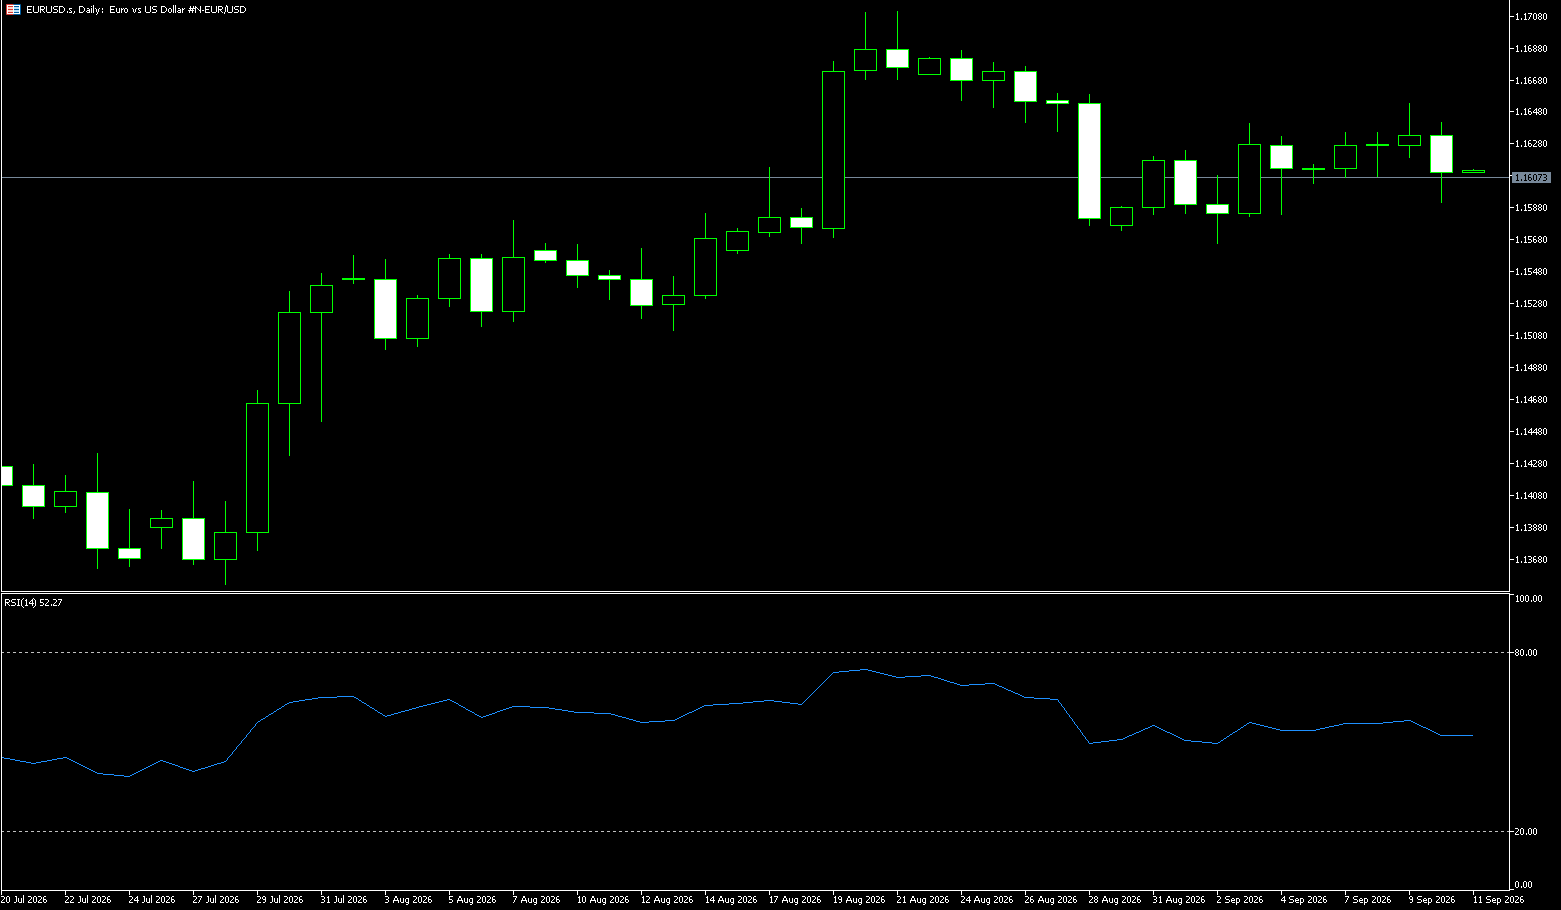
On Wednesday, the EUR/USD pair declined, erasing Tuesday's gains, weighed down by rising oil prices and a broad strengthening of the US dollar ahead of the release of the latest Federal Reserve meeting minutes. The pair traded near session lows of 1.1195—retreating from Tuesday's high of 1.1275—and remained unmoved by strong German industrial production data. Official data from Germany's statistics office showed a 2% rebound in factory output for September, largely offsetting the 1.2% decline in August and exceeding the market expectation of a 0.5% increase. Industrial production grew by 2.3% on an annualized basis, recovering from a 1.6% contraction the previous month. Markets largely overlooked this data as mild risk-aversion sentiment prevailed and renewed tensions in the Middle East drove oil prices higher. Brent crude has climbed back above $100 per barrel—a level that poses a significant headwind for Eurozone economic growth.
On the daily chart, EUR/USD trades at 1.1195, maintaining a short-term bearish bias as the spot price remains below the 9-day Simple Moving Average (SMA) of 1.1291. Price action remains under pressure following a series of lower closes; meanwhile, the 14-day Relative Strength Index (RSI) is approaching 24, indicating oversold conditions that could slow the decline without yet altering the prevailing bearish structure. To the upside, immediate resistance lies at the 9-day SMA (1.1291) and the 1.1300 psychological level; this zone has capped rebound attempts and marks the key level bulls must reclaim to alleviate current downward pressure. A breakout would target the 14-day SMA at 1.1341. With no nearby technical support levels in the immediate data set, traders may focus on the week's low of 1.1161 and price action near the 1.1100 psychological level for signs of a potential bottom or a continuation of the downtrend.
Consider going long on the Euro today at 1.1185; Stop-loss: 1.1175; Targets: 1.1240, 1.1250.
Stock Analysis:
Australia ASX 200 Index
Market Overview:
The Australian ASX 200 index remained virtually flat on Wednesday, closing at 8,728 points; gains in utilities, healthcare, and industrial services were offset by losses in technology, transportation, and financials. Market sentiment turned subdued following three consecutive days of gains; while Wall Street hit record highs on Tuesday driven by a tech rally, US stock index futures subsequently pulled back. Local data showed a sharp decline in Australian industrial activity in September, with businesses citing tighter access to financing, persistent cost pressures, and a resurgence of fuel-driven inflation. Mining giant BHP Group fell 0.7% after agreeing to sell its Kambalda nickel concentrator and related assets to Gold Fields, a deal expected to close in 2027. This move follows BHP's 2024 decision to suspend its broader Western Australian nickel operations due to a market surplus.
Three of the "Big Four" banks saw their share prices fall, with losses ranging from 0.8% to 1.3%. Conversely, Evolution Mining rose 2.5%, Northern Star Resources gained 1.9%, Pilbara Minerals (PLS) climbed 1.8%, and Lynas Rare Earths increased 1.6%.
Sector Performance:
Top Gainers: Mining (BHP, Rio Tinto) remained resilient, supported by iron ore prices; gold-related stocks showed relative resilience, benefiting from gold price performance; the banking sector saw minor fluctuations.
Top Decliners: The technology sector remained under pressure, with WiseTech and NEXTDC weakening; parts of the healthcare sector experienced a pullback. Technical Analysis:
The ASX 200 closed at 8,727.7 on Wednesday, down slightly by 8 points (-0.09%). The index traded within a narrow range throughout the day with limited volatility, reflecting a period of consolidation on lower volume following a previous rise. Regarding price structure: the index rose to 8,736 on Tuesday but lacked the momentum to sustain an early-session rally on Wednesday, subsequently pulling back to close slightly below Tuesday's level. The retreat after facing resistance indicates a slowdown in short-term bullish momentum; however, the absence of a high-volume breakdown suggests the market is simply consolidating at high levels. RSI (14) stands at 40.65—a neutral-to-low reading that indicates neither oversold nor overbought conditions—suggesting a balance between bulls and bears while the market awaits a clear direction. Market Logic: Local Australian consumer confidence continues to decline (Westpac-Melbourne Institute Consumer Sentiment Index at 80.4 in October), raising market concerns that the Reserve Bank of Australia (RBA) might further hike rates to curb consumption. However, overnight strength in US equities and iron ore prices provided support, limiting the index's decline and resulting in range-bound, seesaw trading. Key Conclusion for Wednesday: Bulls are taking a brief pause without a decisive breakdown; the market remains range-bound, awaiting external catalysts, with a short-term trend that is neutral-to-weak.
Thursday Technical Outlook (Short-term/1-trading-day perspective): Primary Technical Theme: The market is currently in a consolidation phase, seeking direction without a clear unilateral trend; focus should be placed on a potential breakout from the 8,680–8,768 range. Scenario Forecast for Thursday—Optimistic Scenario (40% probability): Driven by overnight strength in US equities and iron ore, the ASX 200 attempts a rebound on Thursday, testing the 8,768 level. A move to challenge 8,830 would only be possible if the index successfully holds above 8,768; otherwise, it is likely to retreat again if it fails to sustain that level. **Baseline Scenario: Range-bound Fluctuation (45% probability)** – In the absence of significant external news, the index continues to oscillate between 8,680 and 8,768, maintaining a tug-of-war between bulls and bears. The RSI remains near 40 as the market awaits catalysts from upcoming data. **Bearish Scenario (15% probability)** – Triggered by a sharp drop in US stock futures and a pullback in iron ore prices, the index breaks the 8,680 support level and tests 8,630; a breach of 8,630 would shift the short-term trend to bearish, opening the door for a deeper correction.
**Trading Strategy (Short-term Perspective)**
**Range-trading Approach (Primary Strategy – Currently Most Suitable)**
1. **Bullish Strategy**
• Consider entering long positions only after a pullback to the 8,680 area shows stabilization and a reversal candlestick pattern forms;
• Target: 8,740–8,768; Stop-loss: Below 8,660 (exit immediately if 8,660 is breached);
• If the market opens high and surges toward 8,768, do not chase the rally; consider reducing positions if upward momentum stalls.
2. **Bearish Strategy**
• Consider initiating a light short position if the price faces resistance and pulls back near 8,768;
• Target: 8,700 → 8,680; Stop-loss: Above 8,790;
• If the price breaks above 8,768 on high volume and holds, short positions must be closed (stop-loss); do not hold onto losing trades.
**Key Risk Warnings:**
1. **External Risks (Major Variable):** Overnight US market performance, US Treasury yields, and iron ore/gold prices. As the ASX 200 is an externally oriented index, overnight volatility in overseas assets directly impacts the next day's opening gap, potentially triggering stop-loss orders.
2. **Domestic Interest Rate Risk:** The market continues to price in the possibility of further RBA rate hikes. A rebound in inflation data would weigh on the banking and consumer sectors, dragging the broader market down rapidly. 3. Risk of structural divergence across sectors: While the broader market fluctuated, individual stocks showed starkly divergent performance; small-cap stocks were hit harder by sluggish consumer confidence. Do not equate the strength or weakness of the index directly with that of individual stocks.
Hong Kong Hang Seng Index
Market Overview:
The Hang Seng Index fell 0.6% (or 145 points) to 24,134 on Wednesday, erasing some of the gains from the previous session's rebound, as renewed rises in oil prices stoked concerns about inflation and interest rates. Brent crude prices climbed above $101 per barrel after a storm threatened US Gulf of Mexico oil facilities and Iran-backed Houthi rebels attacked targets in Saudi Arabia, heightening fears regarding global energy supplies. Rising oil prices offset positive signals from Wall Street, even as markets continued to lower expectations for another Federal Reserve rate hike this month. Trading in Hong Kong remained subdued—limiting support from mainland buying—as mainland markets and the Southbound Stock Connect remained closed for the National Day holiday.
Healthcare and technology stocks, which had rebounded on Tuesday, faced renewed selling pressure; notable decliners included Tencent (-0.8%), WuXi Biologics (-3.3%), GenScript Biotech (-14.4%), Xiaomi (-1.1%), and InSilico Medicine Cayman (-8.7%).
Sector Performance:
Top Gainers: High-dividend utilities/telecoms (e.g., China Mobile, CLP Holdings); local Hong Kong real estate and rental properties; machinery/industrial equipment.
Top Decliners: Innovative drugs/CXO biotech; AI hardware, semiconductors, and PCBs; large-cap internet/tech stocks (e.g., Tencent, Alibaba, Meituan). Technical Analysis:
The Hang Seng Index (HSI) closed at 24,280.56. On Wednesday, the index opened lower and trended downward amidst intraday volatility; it traded sideways at the lows during the afternoon session. By the close, it had surrendered most of the gains from Tuesday, forming a small bearish candle—a pattern indicating a pullback and "shakeout" after the rebound encountered resistance. The intraday high was near 24,346, while the low dipped to 23,990; the closing price settled in the lower-middle section of the trading range. Short-term highs are gradually shifting lower, reflecting a weak, range-bound pattern; while no decisive trend breakout has occurred, the bulls lack sufficient strength for a counterattack. The HSI closed at 24,130.5 points (-0.62%, -150.06 points). Mainboard turnover was HK$94.7 billion, a slight decrease from the previous day's HK$98.2 billion. The Hang Seng Tech Index closed at 4,194.49 points (-0.68%). Market summary: The rebound lacks momentum, and heavyweight tech stocks are under pressure; capital is rotating out of AI hardware and innovative pharmaceuticals into defensive sectors. This represents a pullback within a trading range rather than a sharp, one-sided decline; however, bulls lack the momentum for an active offensive, and the bears currently hold the initiative.
Technical Outlook for Thursday (Oct 8): Expect continued range-bound trading with a bearish bias. The market will likely test support levels first; holding the 23,900 level could trigger a minor technical rebound, whereas a drop below 23,900 would lead to a further test of the 23,600 level. Optimistic scenario (low probability): A recovery in overseas markets overnight allows the HSI to open high and stabilize above 24,300, potentially challenging the 24,500 level. Prerequisites: A simultaneous increase in trading volume and a stabilization of heavyweight internet/tech stocks. Baseline Scenario (High Probability): Open slightly lower or flat; initially dip to test the 23,900 support level. If support holds, the price will rebound with volatility, face resistance at 24,200–24,300, and then pull back, resulting in a narrow trading range for the day. Bearish Scenario: Driven by external risks and capital outflows, the price breaks directly below 23,900 on high volume, targeting the 23,600 area. Core Range: 23,900–24,300; Thursday's market action will center on this range.
Trading Strategy:
Bullish Approach (Test Long, Light Position)
• Entry Conditions: Stabilize near 23,900; hourly chart shows a signal that the decline has halted; trading volume stops hitting new lows. Enter a light long position.
• Targets: 24,200 → 24,300
• Stop-loss: Exit if the price drops below 23,850 (strict stop-loss; do not hold losing positions).
Bearish Approach (Trend-following)
• Entry Conditions: Rebound to the 24,250–24,300 resistance zone; momentum stalls and fails to break through on high volume. Enter a light short position.
• Targets: 24,000 → 23,900; if it breaks below 23,900, look toward 23,600.
• Stop-loss: Exit if the price rises above 24,350.
Key Risk Warnings:
1. Overseas Interest Rate Risk: Fluctuations in US Treasury yields and oil prices directly impact foreign capital flows into Hong Kong stocks. Rising oil prices can push up inflation expectations and suppress valuations, potentially triggering a gap opening in the Hang Seng Index.
2. Sector-specific Structural Risk: AI chips and innovative pharmaceuticals face significant short-term profit-taking pressure; single-day volatility in heavyweight stocks could drive substantial swings in the index. 3. Liquidity Risk: When trading volume in Hong Kong stocks is sluggish, sharp drops and sudden rallies can easily occur, and slippage widens; leveraged accounts holding Bull/Bear Contracts (CBBCs) or futures are highly susceptible to triggering stop-loss orders.
Disclaimer: The information contained herein (1) is proprietary to BCR and/or its content providers; (2) may not be copied or distributed; (3) is not warranted to be accurate, complete or timely; and, (4) does not constitute advice or a recommendation by BCR or its content providers in respect of the investment in financial instruments. Neither BCR or its content providers are responsible for any damages or losses arising from any use of this information. Past performance is no guarantee of future results.
More Coverage





2026 © - All Rights Reserved by BCR Co Pty Ltd
Risk Disclosure:Derivatives are traded over-the-counter on margin, which means they carry a high level of risk and there is a possibility you could lose all of your investment. These products are not suitable for all investors. Please ensure you fully understand the risks and carefully consider your financial situation and trading experience before trading. Seek independent financial advice if necessary before opening an account with BCR.
BCR Co Pty Ltd (Company No. 1975046) is a company incorporated under the laws of the British Virgin Islands, with its registered office at Trident Chambers, Wickham’s Cay 1, Road Town, Tortola, British Virgin Islands, and is licensed and regulated by the British Virgin Islands Financial Services Commission under License No. SIBA/L/19/1122.
Open Bridge Limited (Company No. 16701394) is a company incorporated under the Companies Act 2006 and registered in England and Wales, with its registered address at Kemp House, 160 City Road, London, England, EC1V 2NX. Open Bridge Limited acts solely as a payment processor for BCR Co Pty Ltd and does not provide any financial, trading, or investment services on its behalf. Open Bridge Limited's role is limited to payment processing.


 English
 简体中文
简体中文
 繁體中文
繁體中文
 Bahasa
Melayu
Bahasa
Melayu
 Tiếng
Việt
Tiếng
Việt
 ไทย
ไทย
 日本語
日本語
 한국어
한국어
 ភាសាខ្មែរ
 español