


0
Currency & Currency Analysis:
US Dollar Index
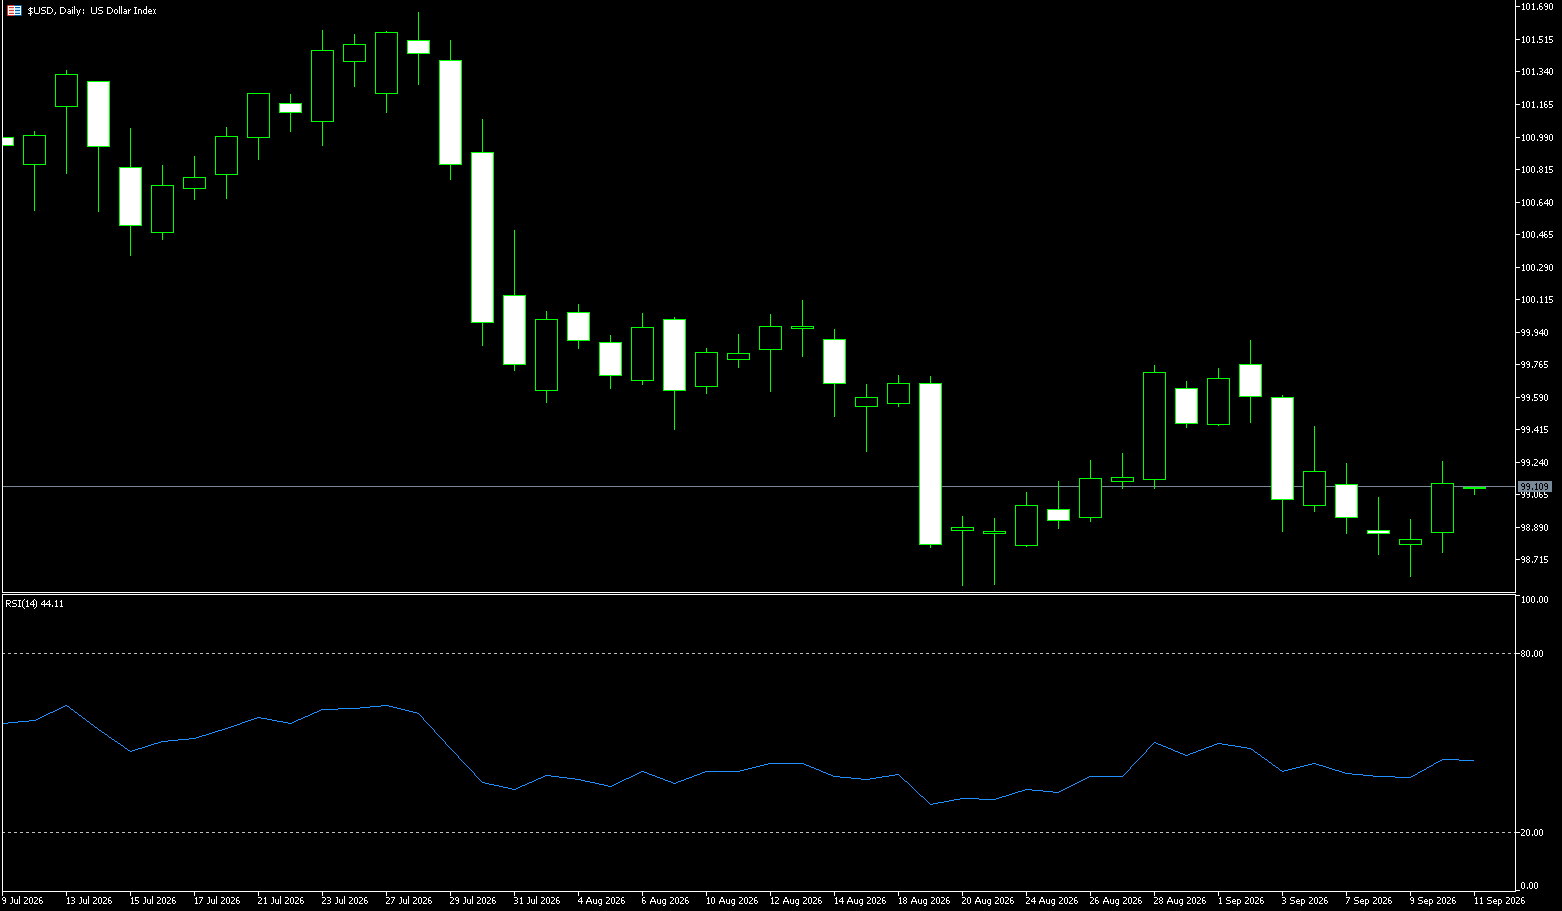
On Thursday, the US Dollar Index held above the 102 level, nearing its highest point since April 2025. The latest Federal Open Market Committee (FOMC) minutes revealed a hawkish stance among policymakers amidst persistent inflation risks. Minutes from the September meeting showed that all 19 policymakers supported the September rate hike, with the majority deeming another hike before year-end appropriate. Markets widely expect the Fed to keep policy unchanged this month, with the probability of a December rate hike currently estimated at around 78%. Investors are awaiting the latest US weekly jobless claims data for further insight into labor market conditions. Concerns over a potential escalation of tensions between the US and Iran, combined with ongoing risks to Middle East oil shipments, have kept crude oil prices and inflationary pressures high; consequently, the US dollar continues to benefit from safe-haven demand.
In the short term, gold faces a "triple threat": a strong US Dollar Index, high US Treasury yields, and expectations of a December Fed rate hike. While a decision to keep interest rates unchanged at the October meeting might offer a brief respite, internal divisions and hawkish rhetoric revealed in the meeting minutes would likely limit the extent of any rebound. Should the 10-year US Treasury yield surge again, the gold price could test the psychological $4,000 level. In the medium term, however, supporting factors are equally evident. The People's Bank of China’s continuous gold purchases over 23 months, escalating geopolitical conflicts, fiscal concerns in France alongside a weak euro, high oil prices, and stubborn inflation could all reignite demand for gold as a safe-haven and store of value in the future. The $4,000 mark serves as a critical dividing line between bullish and bearish trends; holding this level could pave the way for a year-end rebound, whereas a breakdown below it might trigger a deeper correction. From a technical perspective, the US Dollar Index maintains a short-term bullish structure on the daily chart. Regarding resistance, the initial level is at 102.88 (upper Bollinger Band); a breakout here could lead to a test of the 103.00 psychological level. On the downside, the first line of support is at 101.76 (10-day moving average), followed by the 101.34 area (14-day moving average), with stronger support located at the 101.00 psychological level.
Consider shorting the US Dollar Index at 102.20 today; stop-loss: 102.30; targets: 101.70, 101.80.
WTI Crude Oil
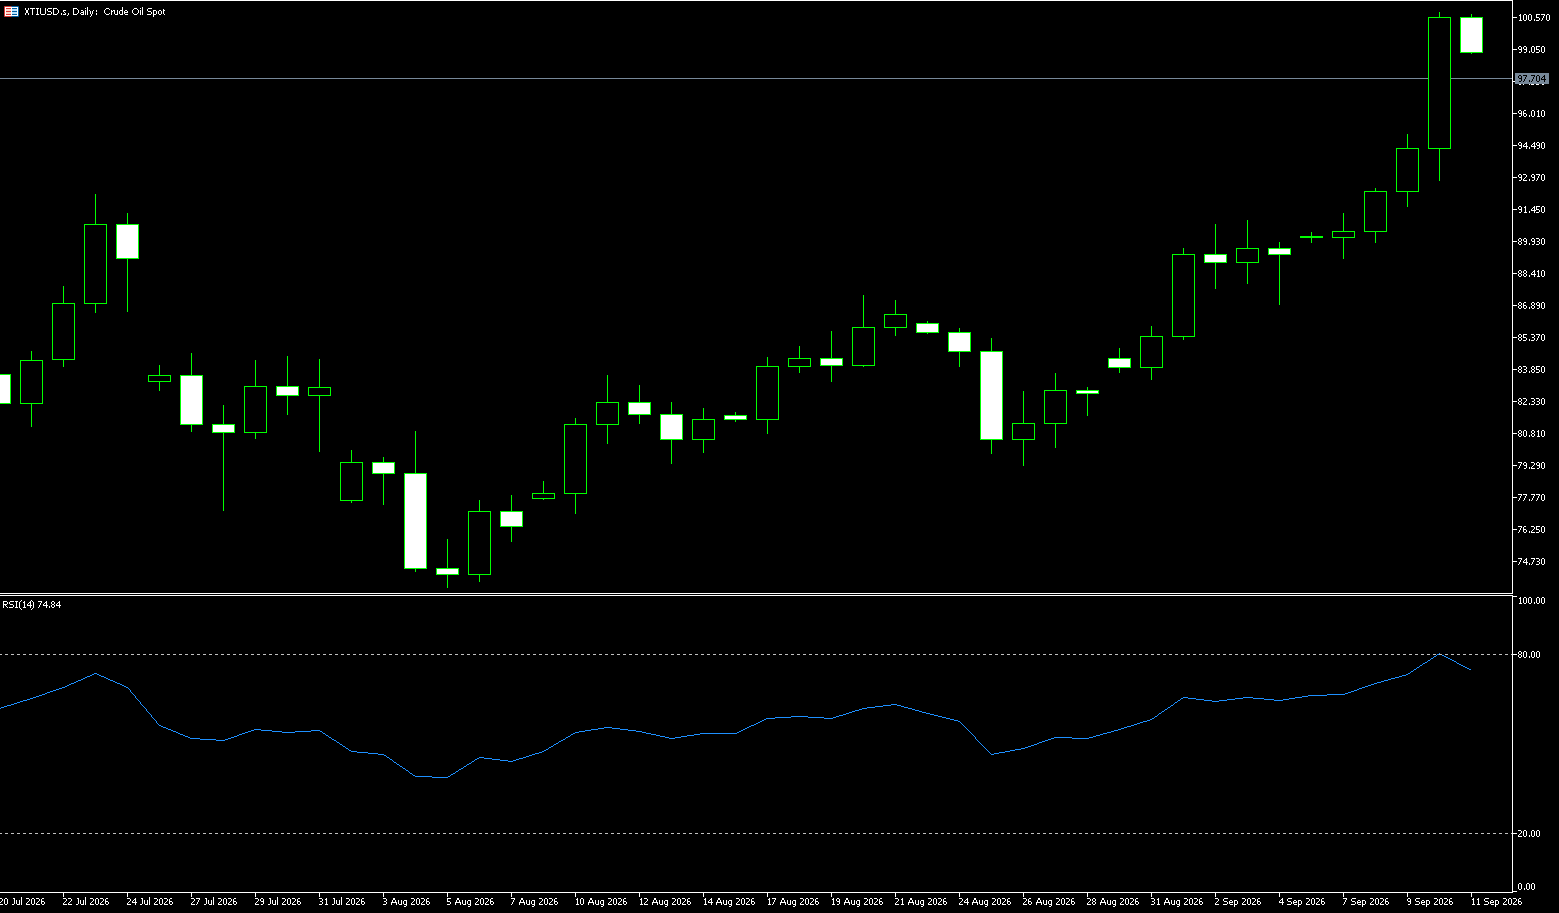
On Thursday, crude oil prices rose toward $90 per barrel, recovering some of the losses from the previous session following reports that the Trump administration had directed the Pentagon to draft plans for strikes against Iran—actions that could be implemented before the midterm elections. This development defied widespread expectations that President Donald Trump would avoid escalating tensions with Tehran prior to the November vote. Meanwhile, oil producers in the Gulf of Mexico shut down over 510,000 barrels per day of crude production—equivalent to about a quarter of the region's output—due to Tropical Storm Isaias. In the Middle East, oil exports have gradually returned to pre-war levels in recent weeks, yet tanker attacks in the Strait of Hormuz continue to threaten supplies. Additionally, Iranian-backed Houthi rebels attacked targets within Saudi Arabia, prompting the Riyadh-led coalition to launch a new round of airstrikes against Houthi strongholds in Yemen.
From a daily chart perspective, the short-term technical setup for WTI crude shows signs of softening despite some stability. The price has reclaimed the $90 level (a key psychological threshold), indicating a recovery of the previous upward momentum; the fact that the price remains above the 50-day moving average ($87.67) suggests the medium-term structure has not yet turned fully bearish. The RSI stands at approximately 49.72—having dipped below the neutral 50 mark but remaining well above oversold territory—signaling a period of weak oscillation due to waning momentum rather than an extreme oversold condition. On the daily chart, the primary resistance lies near the 20-day moving average ($92.59); if the price can firmly establish itself above this level, it may go on to test the area around $95.80 (the September 24 high). On the downside, the initial level to watch is the 50-day moving average at $87.67, followed by the lower Bollinger Band near $85.35; a breach of the latter could see the market seeking further support near the $80 mark.
Consider going long on crude oil at $90.20 today. Stop-loss: 90.00; Targets: 91.50, 92.00.
Spot Gold
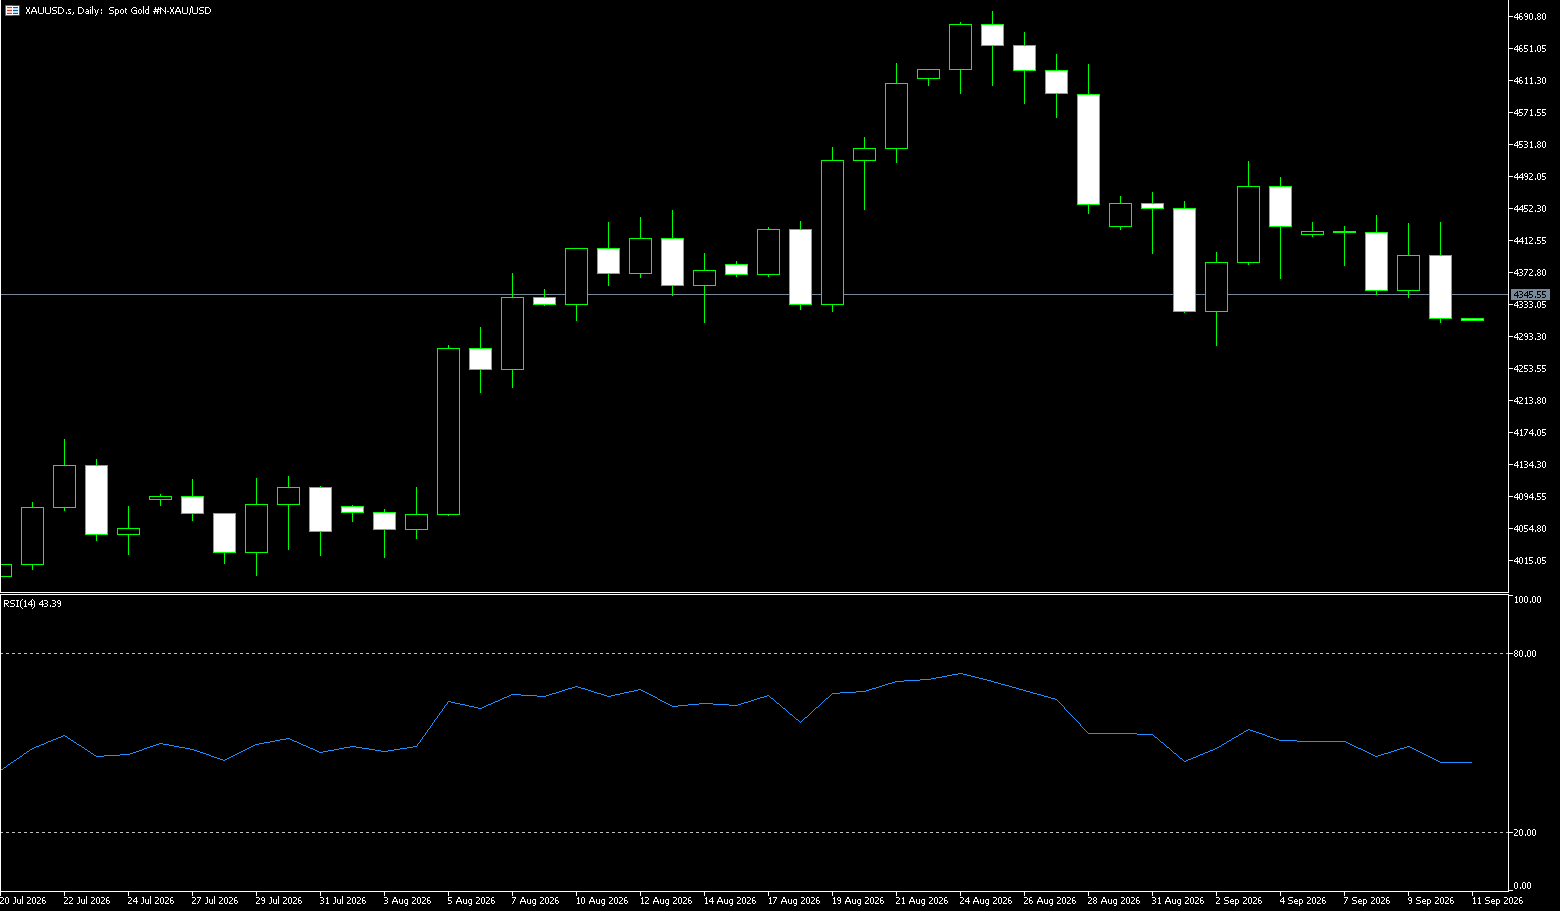
On Thursday, gold prices hovered around $4,130 per ounce, remaining close to the two-month low hit on Wednesday, as investors assessed the minutes of the Federal Reserve's September meeting for clues regarding the interest rate outlook. The US dollar held near an 18-month high, while US Treasury yields remained close to levels not seen in over two decades. The minutes revealed that all 19 policymakers supported the September rate hike, with the majority deeming another hike before year-end appropriate. According to the CME FedWatch Tool, the market currently assigns a probability of nearly 17% for an October rate hike and over 85% for a hike in December. Rising interest rates diminish the appeal of non-yielding gold. Meanwhile, geopolitical tensions continue to support some demand for safe-haven assets. Shipping data indicates that the number of vessels passing through the Strait of Hormuz has dropped to its lowest level in over two months as regional hostilities escalate.
In the short term, gold faces a triple headwind: a strong US dollar index, high US Treasury yields, and expectations of a Federal Reserve rate hike in December. While a decision to keep rates unchanged at the October meeting might offer a brief respite, the internal divisions and hawkish rhetoric revealed in the meeting minutes... This will limit the extent of any rebound. If the 10-year US Treasury yield surges again, the gold price could test the psychological support level of $4,000. Medium-term support factors remain significant: the People's Bank of China’s continuous gold buying over 23 months, escalating geopolitical conflicts, fiscal concerns in France alongside a weak euro, high oil prices, persistent inflation, and the "crowding-out" effect on the bond market caused by the US fiscal deficit and massive capital raises (such as SpaceX’s) could all reignite demand for gold as a safe-haven and store of value. Gold prices could recover to $4,400 by year-end. The $4,000 level acts as a critical dividing line between bullish and bearish trends; holding this level suggests a potential year-end rebound, while a break below it could trigger a deeper correction. However, before anticipating a drop to Wednesday's support level of $3,966, one should exercise caution and wait for a confirmed break and stabilization below $4,100—a level representing both the lower bound of the trading range and the 78.6% Fibonacci retracement level. On the upside, immediate resistance lies at the 10-day moving average ($4,160), followed by the psychological $4,200 mark and the 14-day moving average zone ($4,205). Only a sustained breakout above these layers of resistance would alleviate the current bearish sentiment.
Consider going long on gold at $4,125 today; stop-loss at $4,120; targets: $4,170, $4,180.
AUD/USD
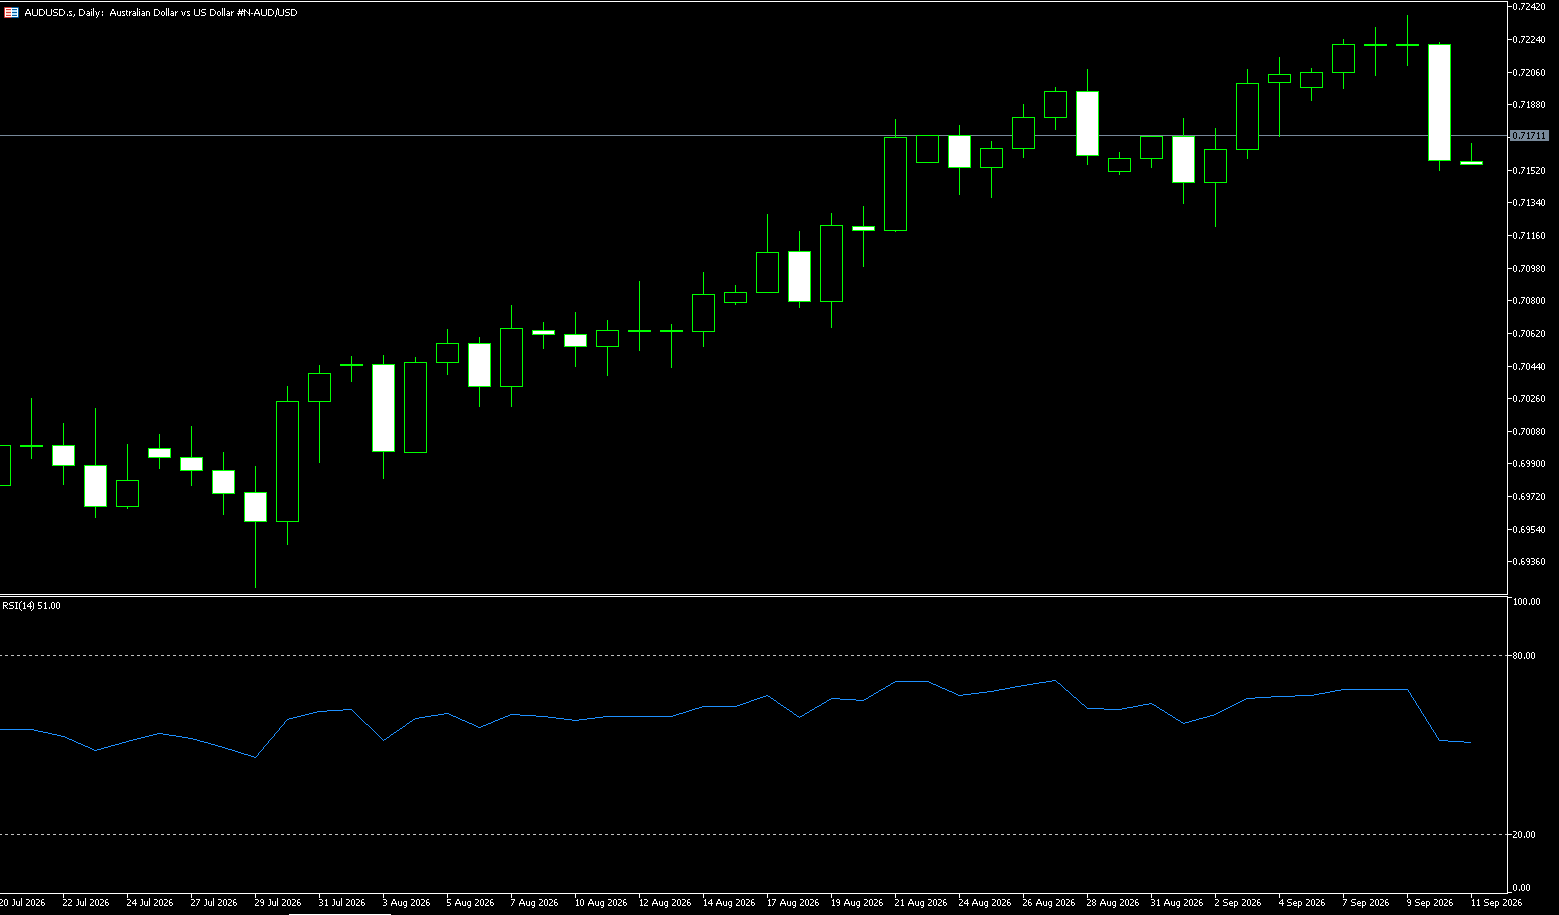
The Australian dollar remains below $0.70, hovering near multi-week lows, after the Federal Reserve's meeting minutes struck a hawkish tone that boosted the US dollar. The minutes revealed that policymakers view inflation as the primary risk to the economic outlook; some participants deemed further rate hikes appropriate, while others considered current policy only moderately restrictive. Nevertheless, the market remains skeptical about a Fed rate hike in October, with current pricing indicating only a 19% probability of a 25-basis-point increase. In Australia, following last week's rate hike to 4.60%, the market assigns a 25% probability to another hike by the Reserve Bank of Australia in November. Attention will focus on the central bank's meeting minutes due October 13, followed by September employment data next week; the unemployment rate is a key focus, having risen to a five-year high of 4.6% in August. If the unemployment rate remains flat or rises further, market expectations for additional policy tightening could diminish. The third-quarter Consumer Price Index (CPI) report, due later this month, is also crucial, with core inflation expected to remain elevated.
On the daily chart, AUD/USD is trading at 0.6960, maintaining a short-term bearish tone as the spot price remains below the 0.7000 psychological level and the 20-day Simple Moving Average (SMA) at 0.7039. The price is currently hovering just above the 78.6% Fibonacci retracement level of 0.6945, indicating a fragile attempt to stabilize near this support; meanwhile, the 14-day Relative Strength Index (RSI) at 33.78 is approaching oversold territory, suggesting the current downward trend is relatively strong. To the downside, immediate support lies at 0.6903 (October 1 low) and the 0.6900 round-number level, with deeper support found at 0.6886 (lower Bollinger Band). To the upside, initial resistance appears at the 0.7000 psychological level and the 61.8% Fibonacci retracement level of 0.7008, followed by a resistance cluster formed by the 20-day SMA (0.7039) and the 50% Fibonacci retracement level (0.7052).
Consider going long on AUD at 0.6950 today; Stop Loss: 0.6940; Targets: 0.7000, 0.7010.
GBP/USD
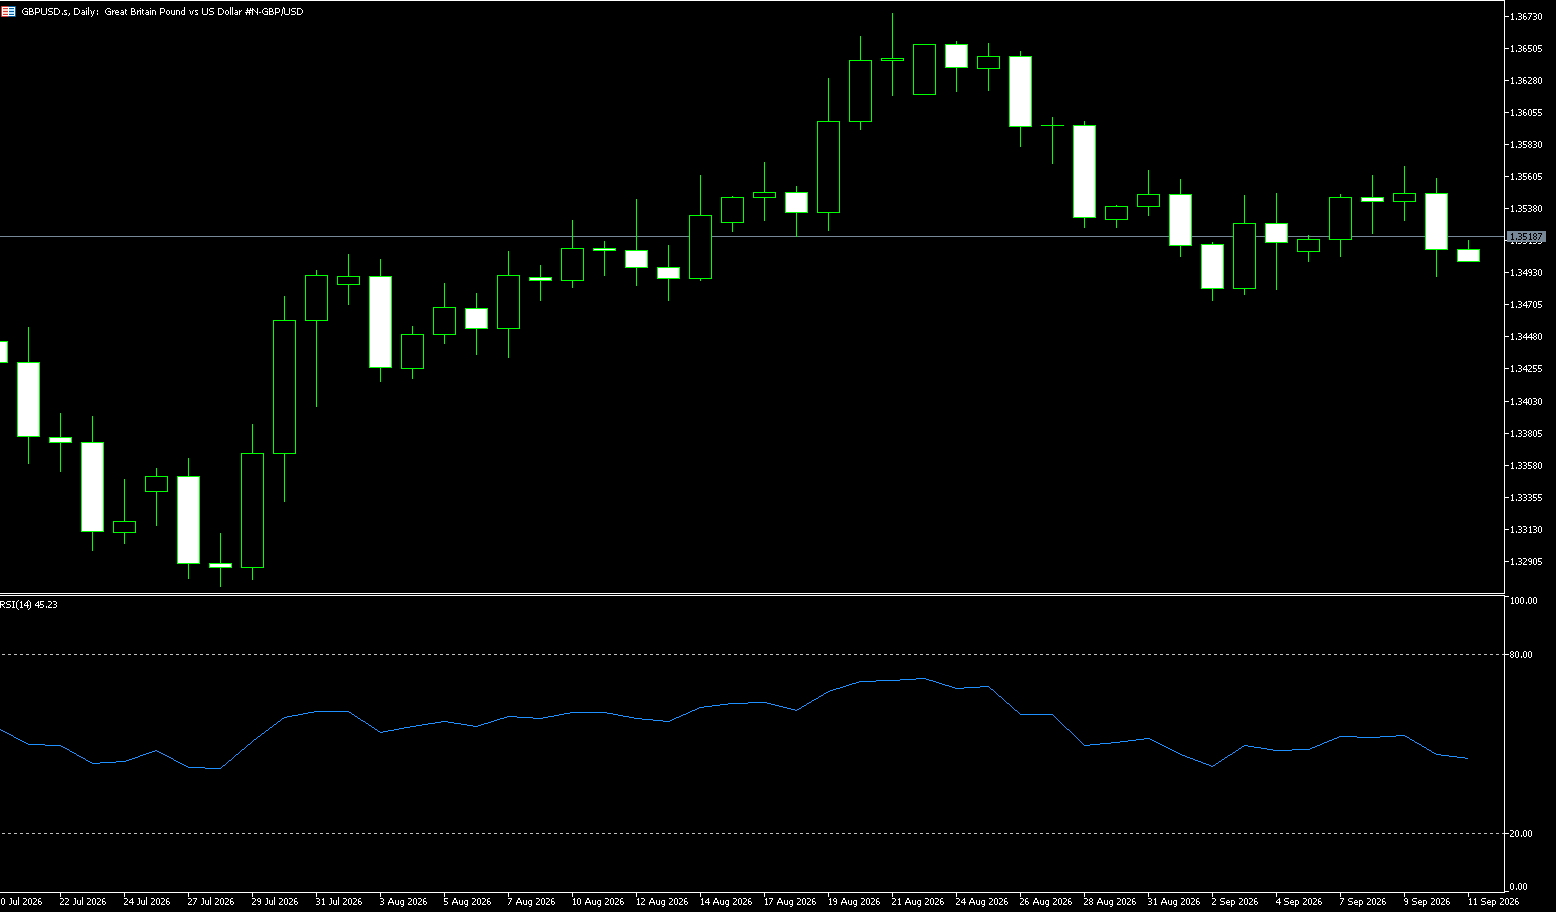
GBP/USD continued to weaken during the Asian session on Thursday, hovering near 1.3230 and remaining under pressure for a second consecutive day. The US dollar has shown relative resilience, supported significantly by US Treasury yields remaining near highs not seen since 2002. Meanwhile, a recent rebound in international oil prices has reignited concerns that energy costs could delay the decline in inflation, thereby reinforcing expectations that major central banks will maintain higher interest rates. With the US dollar's interest rate advantage showing no signs of significant erosion, any short-term rebound in GBP/USD faces resistance. The pressure on the pound stems not only from dollar strength but also from the UK's own economic outlook. Should energy costs remain elevated, the Bank of England may face a trade-off between curbing inflation and avoiding a further economic slowdown; while maintaining higher rates helps control price pressures, it could also increase the financing burden on households and businesses. If economic growth suffers a more pronounced hit, the pound may not be able to rely solely on rising UK gilt yields for sustained support.
From a technical perspective, the recent range-bound trading observed over the past two weeks or so can be characterized as a bearish consolidation phase following the decline from the August swing high. The upper boundary of this range now aligns with the 100-period simple moving average (SMA) on the 4-hour chart, suggesting that rebounds are likely to be capped and the broader structure remains tilted to the downside. Meanwhile, the Moving Average Convergence Divergence (MACD) indicator remains in negative territory—albeit with signs of slight convergence—indicating that downward momentum persists but is not particularly strong. Additionally, the Relative Strength Index (RSI) stands at 35.74, remaining below the midline, which further reinforces the mildly bearish bias. This supports the likelihood of an eventual breakdown below the trading range support levels near 1.3180 (the October 1 low) and 1.3105 (the lower Bollinger Band). On the upside, confluent resistance at 1.3250 (the 14-day Simple Moving Average) may cap any attempted rebound. To alleviate current pressure and initiate a more constructive phase, a sustained break above the 1.3300 level is required.
Consider going long on GBP at 1.3220 today; Stop-loss: 1.3210; Targets: 1.3270, 1.3260.
USD/JPY
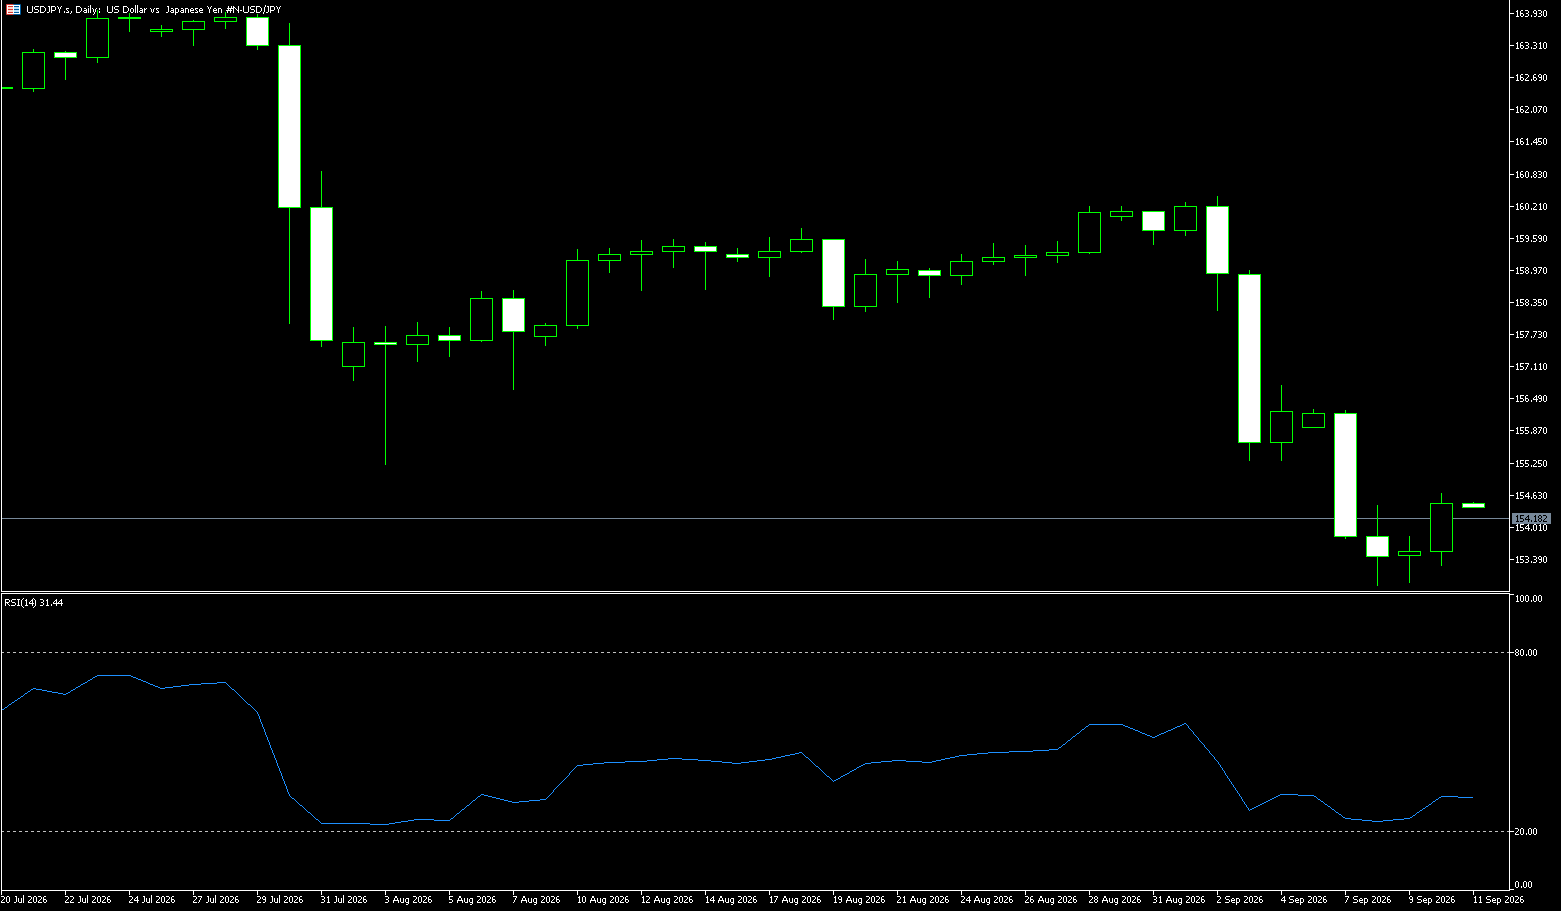
On Thursday, the USD/JPY exchange rate held steady below the 158.00 mark, remaining within a narrow range following the release of economic data. Figures showed Japan's current account surplus for August rising to ¥4.062 trillion, exceeding the expected ¥3.194 trillion. However, the yen remains under pressure due to the wide yield gap between the US and Japan, combined with Japan's relatively low domestic interest rates and heavy debt burden. Sanae Takaichi continues to advocate for expansionary fiscal policies, pledging to cut consumption tax on food while emphasizing that the government will fund these measures without issuing additional bonds—a move intended to reassure financial markets. Meanwhile, Bank of Japan board member Ayano Sato—who previously opposed the September rate hike—stated this week that she supports a gradual, phased approach to raising rates, further reinforcing expectations of a potential future hike by policymakers.
On the daily chart, USD/JPY is trading near 158.00. The pair remains above the 14-day Simple Moving Average (SMA) of 157.76, indicating a constructive short-term tone and reinforcing the bullish bias as the price moves away from recent corrective lows. The Relative Strength Index (RSI) stands at 55.15; while in positive territory, it has not yet reached overbought levels, suggesting upward pressure exists without the market being overextended. On the downside, immediate support lies at the 14-day SMA of 157.76, followed by the current level of 157.09 (Bollinger Bands midline). Additionally, the 157.00 level acts as a key pivot point, where buyers have recently managed to halt the decline. As long as USD/JPY maintains a daily close above the 14-day Simple Moving Average (SMA) at 157.76, the September 24 high of 159.04 serves as a critical resistance level; a breakout above this would target the upper Bollinger Band at 159.77.
Consider going short on USD/JPY at 158.05 today; stop-loss: 158.20; target: 157.30. 157.20
EUR/USD
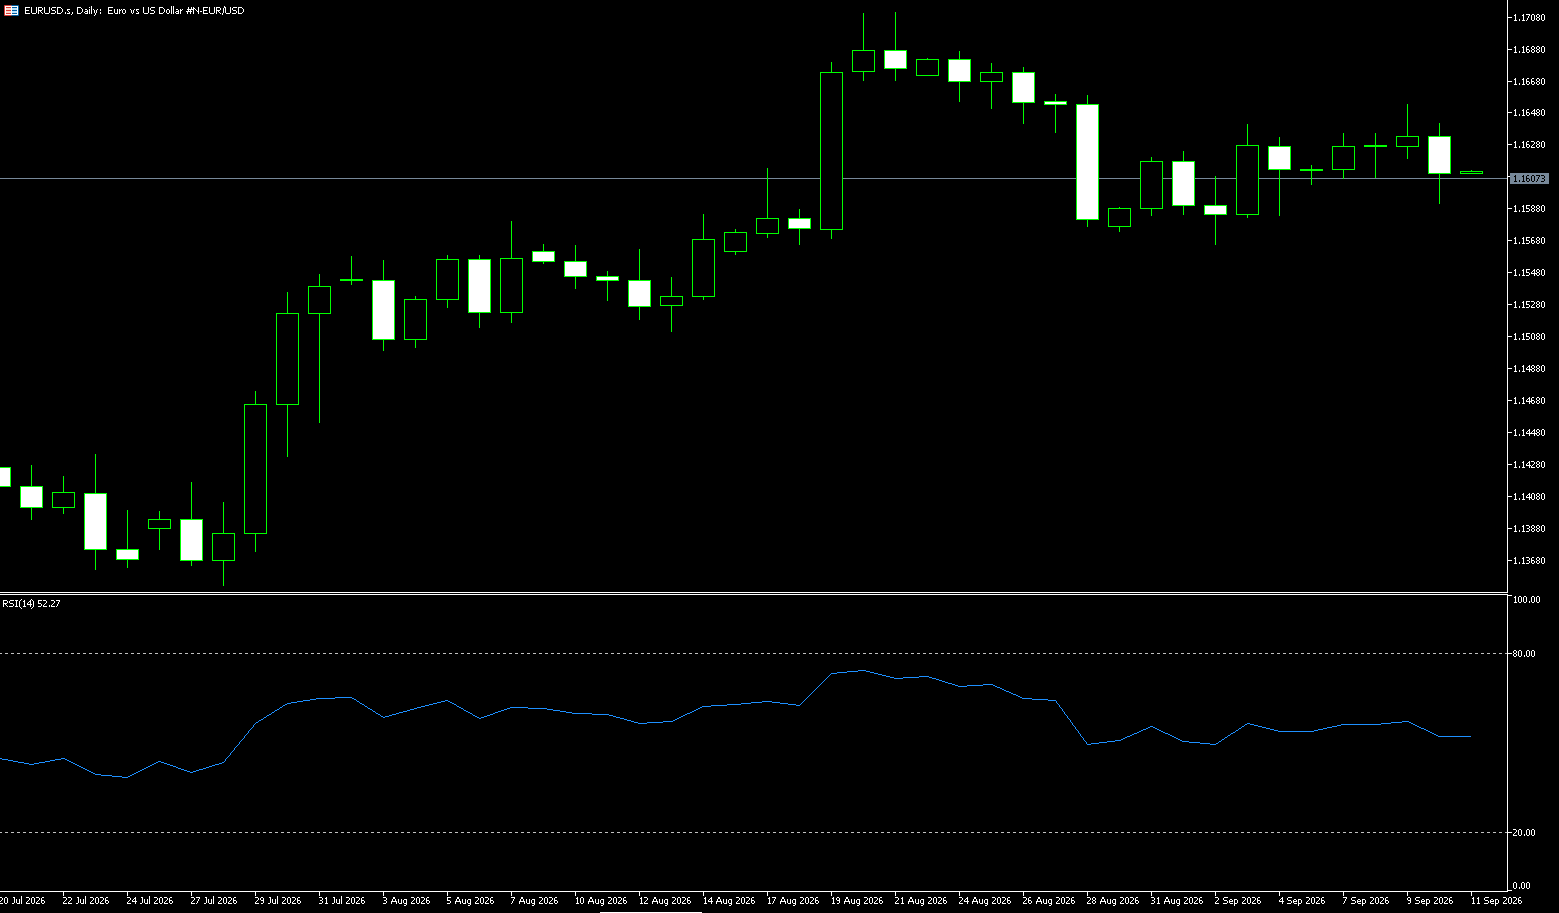
EUR/USD has lost momentum and is trading near 1.1200 after holding that level earlier on Thursday. Market risk aversion, ongoing concerns regarding the fiscal outlooks of France and Italy, and political turmoil in Spain have made it difficult for the Euro to gain upward traction. Later in the session, the European Central Bank (ECB) will release the minutes of its September policy meeting. ECB President Mario Draghi stated at a press conference that policymakers assessed current interest rate levels as sufficiently flexible, allowing the central bank to respond appropriately should the macroeconomic environment change. This stance implies that the ECB has not locked interest rates at a fixed point for the time being, nor will it simply embark on a cycle of continuous rate cuts or hikes. Taken together, Draghi's remarks indicate that the ECB is maintaining policy flexibility at this stage; current rate levels leave room for adjustment, avoiding a pre-determined policy path. However, significant external challenges remain; geopolitical risks and high energy prices continue to disrupt prices, making the path of disinflation in the Eurozone a bumpy one. Furthermore, regarding the division of responsibilities, the ECB is not responsible for fiscal regulation, meaning there are limits to its policy toolkit.
On the daily chart, EUR/USD has fallen below both the 9-day simple moving average (1.1268) and the middle Bollinger Band (1.1379), maintaining a distinct bearish bias. The price is currently holding just above the lower Bollinger Band support at 1.1140. Meanwhile, the 14-day Relative Strength Index (RSI) stands at approximately 22.34, highlighting oversold conditions; while this may slow the decline, it is insufficient to signal a sustainable reversal as long as the pair remains weighed down by the overhead moving average structure. Near-term support lies at the lower Bollinger Band (1.1140) and the 1.1100 psychological level. If oversold conditions persist, sellers may begin to take profits. On the upside, initial resistance lies at the 9-day simple moving average (1.1268), followed by the 1.1300 round-number level and the area near the Bollinger Bands' middle line (1.1379); only by reclaiming these successive resistance levels would bearish pressure be alleviated, paving the way for a more constructive medium-term outlook.
Consider going long on the EUR at 1.1202 today; stop-loss: 1.1190; targets: 1.1260, 1.1250.
Stock Analysis:
Australia ASX 200 Index
Market Overview:
The ASX 200 index fell 67 points (0.8%) on Thursday to close at 8,661, marking its second consecutive day of decline and pushing it close to a one-week low. US stock index futures dipped—weighing on market sentiment—after US President Donald Trump ruled out the possibility of reaching a deal with Iran; meanwhile, reports emerged that the US military is preparing for a potential strike prior to the midterm elections. Domestically, October inflation expectations rose to a four-month high, highlighting persistent price pressures driven by high global energy costs, even as the Reserve Bank of Australia continues to tighten policy. Losses were widespread across sectors, with technology, non-energy mining, industrial services, and logistics leading the decline.
Shares of the "Big Four" banks each fell by approximately 1.5%, while BHP Group dropped 2.0% and Rio Tinto fell 2.9%. Fortescue declined 1.4% amid a deadlock with China Mineral Resources Group over long-term iron ore contracts. Other notable decliners included The Lottery Corporation (-3.8%), Xero (-3.0%), and Endeavour Group (-1.7%).
Sector Performance:
Top Performers: Mining (BHP, Rio Tinto) showed resilience supported by iron ore prices; gold-related stocks remained relatively robust, benefiting from gold price trends; the banking sector saw minor fluctuations.
Top Laggards: Banking, non-energy mining, technology, industrial services, and logistics. The "Big Four" banks fell by an average of approximately 1.5%; BHP (-2%) and Rio Tinto (-2.9%) declined; Xero (-3%) and The Lottery Corporation (-3.8%) weakened significantly. The two major heavyweight sectors—resources and financials—were the primary drags on the index. Technical Analysis:
The ASX 200 closed at 8,660.90 on Thursday, down 0.80% (67 points). This marked the second consecutive day of losses, pulling the index back to weekly lows amidst a broad market decline. After opening higher, the index trended downward, repeatedly hitting new intraday lows; there was no significant recovery toward the close, resulting in a finish near the day's low with a solid bearish candle. The price fell below the short-term 20-day moving average, which has turned downward, creating immediate resistance. Having dropped below the 20-day EMA and remaining beneath the 50-day and 200-day EMAs, the short-term trend has shifted to a weak correction phase. The RSI (14) has retreated to around 40—leaning bearish but not yet in oversold territory (<30)—indicating room for further downside.
Friday Technical Outlook—Scenario Analysis: The short-term trend is expected to be weak and volatile, with an initial test of support levels; a failure to hold support would accelerate the decline, while a rebound requires stabilizing above 8,720. Base Case (High Probability): Repeated testing of the 8,620 support level; consolidation within the 8,620–8,720 range; continuation of the pullback with choppy trading at low levels, closing as a small bearish candle or a Doji. Bullish Reversal Scenario: A rapid post-opening rebound that firmly establishes the price above 8,720 would halt the decline and trigger a recovery toward 8,780; this depends on a recovery in US overnight futures and a rebound in iron ore prices. Bearish Breakdown Scenario: A drop below 8,620 with a close beneath that level would confirm a breakdown, targeting 8,570 and opening up further downside potential. Core Logic: The market is currently in a short-term correction phase without clear signs of a bottom; avoid "buying the dip" prematurely. The index remains highly sensitive to US stock futures, iron ore prices, and the AUD exchange rate. Trading Strategy (Short-term Perspective)
Range Trading Approach (Primary strategy; currently most suitable)
Bullish Strategy (Enter only upon confirmation of stabilization; do not attempt to "catch the bottom")
• Avoid premature "bottom-fishing." Choose one of two entry conditions: ① Price pulls back to the 8620 support level, forms a stabilization candle with a long lower wick and shrinking volume—enter a light long position; stop-loss below 8570; target 8720. ② Price breaks above 8720 on high volume and holds the level upon pullback—enter a long position following the trend; stop-loss 8670; target 8780.
Bearish Strategy (Trend-following focus)
• Short Entry Trigger: Consider shorting if the price rebounds to the 8700–8720 range but faces resistance/stalls and the RSI shows capped upside; place stop-loss above 8780.
• Targets: First target 8620; if broken, second target 8570.
• Exit Strategy: If the price breaks above 8768 on high volume and holds, short positions must be closed (stop-loss); do not hold losing positions.
Key Risk Warnings:
1. Market Risk: The ASX200 is heavily weighted toward the banking and mining sectors. Fluctuations in iron ore prices, international commodities, US Treasury yields, and overnight US stock movements can cause significant opening price gaps. Such gaps can invalidate technical levels, and stop-loss orders are subject to slippage risk.
2. Macro Risk: Rising Australian inflation expectations and fluctuating RBA hawkish sentiment; geopolitical conflicts affecting global risk appetite; sudden news can rapidly reverse market trends.
3. Trading Risk: Leveraged trading (CFDs/Futures) magnifies both profits and losses. Given the high volatility of short-term trading, strict stop-loss management is essential; avoid heavy position sizing.
New Zealand Stock Index (NZX 50)
Market Overview:
The NZX 50 index rose 8 points—or 0.1%—to close at 13,692 on Thursday, halting the downward trend seen in the previous session and early trading. The gains were driven primarily by the telecommunications services, consumer staples, and utilities sectors. However, declines in the financial, technology, and consumer discretionary sectors capped the overall rise. The index's upward momentum was also tempered by a rise in overnight US Treasury yields and a lackluster performance on Wall Street. Market caution intensified following the release of Federal Open Market Committee (FOMC) minutes, which indicated that the Federal Reserve might raise interest rates again this year. Rising oil prices also limited gains, as they heightened market concerns regarding inflation and interest rate hikes. Last month, the Reserve Bank of New Zealand raised the Official Cash Rate by 25 basis points to 2.75%—marking its second consecutive hike—in an effort to steer inflation back toward the 2% target midpoint.
Top-performing stocks included Australian Foundation Investment Company (1.5%), a2 Milk Company (1.4%), Guinness Peat Group (1.4%), Australian Pharmaceutical Industries (1.3%), Contact Energy (1.3%), South Port New Zealand (1.2%), Henderson Far East Income Fund (1.0%), and Fisher & Paykel (0.9%). Sector Performance:
Top-performing sectors: Utilities, Consumer Staples, and Communication Services. Representative stocks such as A2 Milk, Contact Energy, AFT Pharmaceuticals, and Australian Foundation strengthened, with defensive sectors providing a floor for the broader market.
Worst-performing sectors: Financials, Technology, and Consumer Discretionary. These weighed on the index, limiting further upside and capping the scope for a rebound.
Technical Analysis:
The NZX50 closed at 13,691.85 on Thursday, up 0.06% (+7.81 points). After dipping intraday, the index recovered to close slightly higher, halting its decline for a modest rebound; overall, the market is undergoing a period of consolidation and recovery, though the rebound momentum remains weak. Trading began with a continuation of the previous day's weakness—opening lower and testing the downside—before gradually recovering lost ground. It closed slightly positive with a small bullish candle featuring a long lower shadow, indicating a "resistance rebound" rather than a strong reversal. Daily volatility was limited; the rebound was capped by overhead resistance, and bullish momentum was insufficient. External factors—including overnight weakness in US equities, rising US Treasury yields, FOMC minutes signaling a potential further rate hike this year, and rising oil prices fueling inflation expectations—dampened risk appetite and constrained the NZX50's rebound. Domestically, a hawkish interest rate stance in New Zealand also weighed on equity valuations. Key takeaway from Thursday's session: signals of a turnaround were weak; the movement was merely a technical rebound driven by defensive sectors supporting the market. There was no trend reversal, and the broader outlook remains one of consolidation with a bearish bias.
Friday Technical Outlook—Scenario Analysis: Bullish Scenario (Low Probability): Overnight US markets recover and US Treasury yields fall; the NZX50 opens firmly above 13,720 and tests the 13,802 level. A sustained move above 13,802 on high volume is required to confirm the continuation of the short-term rebound; otherwise, the index is likely to face resistance and pull back. Base-Case Scenario (Highest Probability): Continued range-bound trading between 13,607 and 13,802. Defensive stocks continue to provide support, but the market is seesawing within a narrow range as financial and technology sectors act as a drag, reflecting a balance between bulls and bears. Bearish scenario: If external markets weaken further and the index breaks below the 13,607 support level, a downward trend will resume, targeting 13,534. The RSI is likely to fluctuate around 40; if the MACD fails to form a "golden cross," the sustainability of any rebound remains doubtful. Unless the price rises above short-term moving averages, the movement is characterized as a rebound within a downtrend rather than the start of a new upward trend.
Trading Strategy:
1. Bullish Approach (Light-position long entry)
• Entry Conditions: Price stabilizes near 13,607 and forms a reversal candlestick (indicating a halt to the decline), with no significant negative news from overnight external markets;
• Take Profit: 13,760–13,800; Stop Loss: Below 13,580;
• Principles: Maintain light positions only; do not chase highs; do not mistake a rebound for a trend reversal.
2. Bearish Approach
• Entry Conditions: Price faces resistance and retreats after rising to the 13,790–13,802 range;
• Take Profit: 13,620–13,607; Stop Loss: If price rises above 13,830;
• Logic: The primary trend is weak; shorting at resistance levels aligns with the prevailing trend.
Key Risk Warnings:
1. External Risks (Major Variables): Fluctuations in US stocks, US Treasury yields, and oil prices, as well as changes in Federal Reserve rate-hike expectations, will directly impact sentiment in Asia-Pacific stock markets; domestic inflation data from New Zealand and RBNZ interest rate expectations could cause market volatility at any time.
2. Sector-Specific Risks: The NZX50 is heavily weighted toward dairy, utilities, infrastructure, and banking; unexpected earnings reports or news regarding heavyweight stocks like A2 Milk and Fisher & Paykel could trigger significant index fluctuations. 3. Liquidity Risk: Overall liquidity on the NZX is lower compared to US or Hong Kong stock markets, leading to amplified volatility and greater slippage risk; with leveraged trading, even minor market fluctuations can easily trigger stop-loss orders.
Disclaimer: The information contained herein (1) is proprietary to BCR and/or its content providers; (2) may not be copied or distributed; (3) is not warranted to be accurate, complete or timely; and, (4) does not constitute advice or a recommendation by BCR or its content providers in respect of the investment in financial instruments. Neither BCR or its content providers are responsible for any damages or losses arising from any use of this information. Past performance is no guarantee of future results.
More Coverage





2026 © - All Rights Reserved by BCR Co Pty Ltd
Risk Disclosure:Derivatives are traded over-the-counter on margin, which means they carry a high level of risk and there is a possibility you could lose all of your investment. These products are not suitable for all investors. Please ensure you fully understand the risks and carefully consider your financial situation and trading experience before trading. Seek independent financial advice if necessary before opening an account with BCR.
BCR Co Pty Ltd (Company No. 1975046) is a company incorporated under the laws of the British Virgin Islands, with its registered office at Trident Chambers, Wickham’s Cay 1, Road Town, Tortola, British Virgin Islands, and is licensed and regulated by the British Virgin Islands Financial Services Commission under License No. SIBA/L/19/1122.
Open Bridge Limited (Company No. 16701394) is a company incorporated under the Companies Act 2006 and registered in England and Wales, with its registered address at Kemp House, 160 City Road, London, England, EC1V 2NX. Open Bridge Limited acts solely as a payment processor for BCR Co Pty Ltd and does not provide any financial, trading, or investment services on its behalf. Open Bridge Limited's role is limited to payment processing.


 English
 简体中文
简体中文
 繁體中文
繁體中文
 Bahasa
Melayu
Bahasa
Melayu
 Tiếng
Việt
Tiếng
Việt
 ไทย
ไทย
 日本語
日本語
 한국어
한국어
 ភាសាខ្មែរ
 español