


0
US Dollar Index
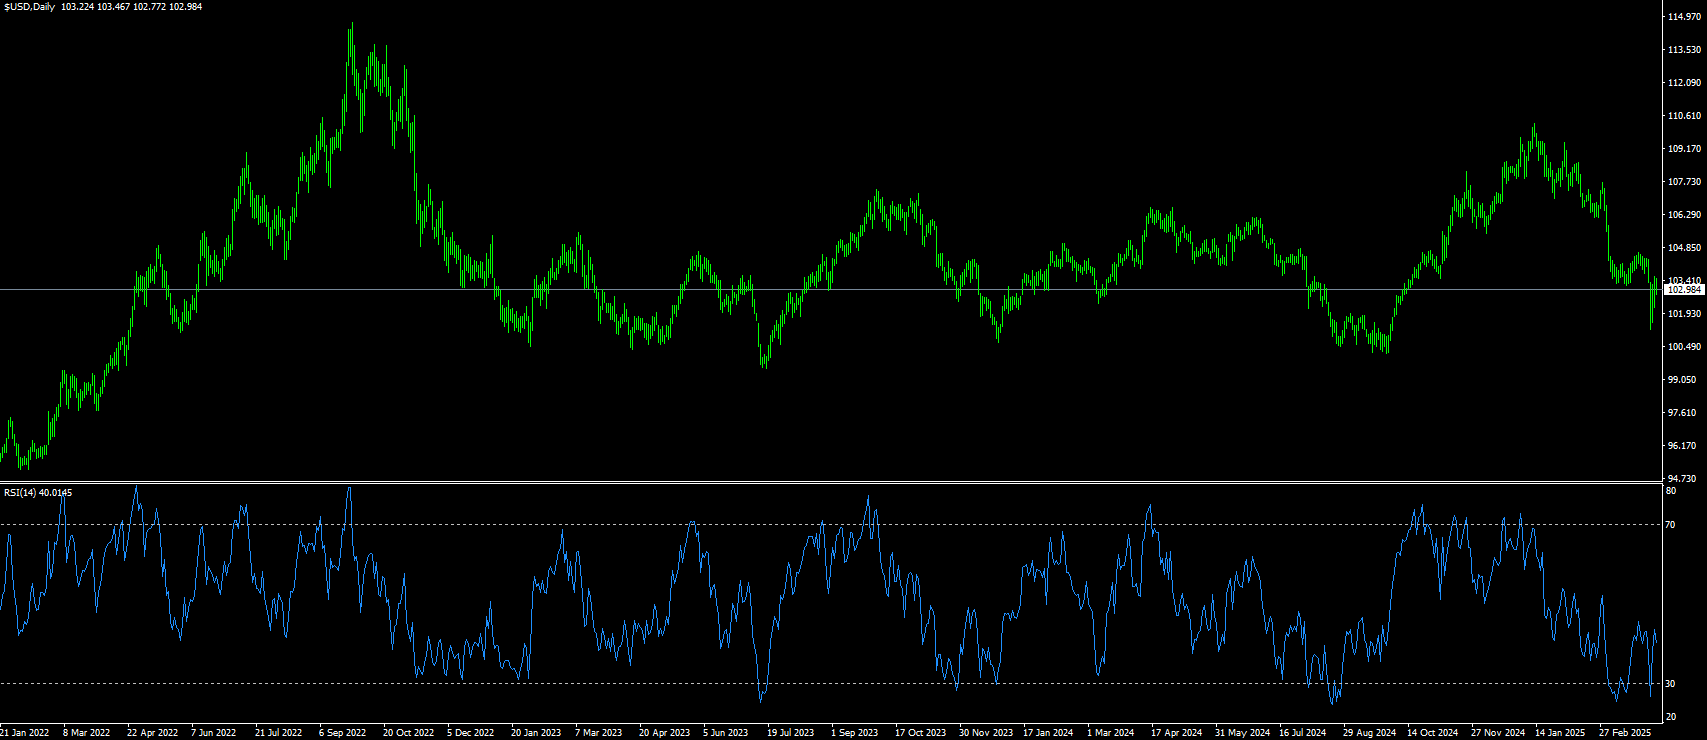
The US Dollar Index is trading close to the 103.00 area in Tuesday's trading. Last week's upbeat labor market data boosted sentiment, helping the index rebound from recent lows. Investors welcomed the remarks of US Trade Representative (USTR) Jamison Greer before the Senate Finance Committee, where he said the US is in tariff discussions with nearly 50 countries. However, selling pressure re-emerged after the US confirmed that it will impose additional tariffs on China on April 9. Catch the recovery towards 103.00 last Friday at the beginning of the week. The market is selling the dollar again as stocks, yields and precious metals fall. This comes after US President Trump said over the weekend that he will stick to his tariff plans, while financial backer and billionaire Bill Ackman warned the president that he is losing the confidence of business leaders. On the economic front, all eyes will be on this week's US Consumer Price Index (CPI) data. The March inflation indicator will be the first release where the Trump administration may have had some impact. In several weekly summaries published on social media, the White House announced that Trump has succeeded in lowering the price of all food items, such as eggs or gasoline at the pump. This can be seen through the upcoming
The US dollar index is trying to continue to rise on the basis of the rebound on Friday, hovering at the top of the intraday range before oscillating at 103.50. The technical indicators on the daily chart, the moving average convergence/divergence (MACD) signal shows potential upside push, while the relative strength index (RSI) remains neutral around 38. Nevertheless, the 9-day (103.53), and 20-day (103.71) simple moving averages still send downside risk signals. Momentum indicators diverge, and the 10-period momentum indicator recommends buying, but other indicators such as the Williams percentage range show neutrality. Therefore, the short-term resistance levels this week are 103.53, 103.71 and 104.00 (round numbers), while the immediate support levels are at 102.75 (Tuesday's low); 102.50 level.
Today, consider shorting the US dollar index around 103.10, stop loss: 103.30, target: 102.60, 102.40
WTI spot crude oil
On Thursday (March 27), international oil prices rose slightly as market participants were evaluating the impact of tightening global crude oil supply and the latest US tariffs on the global economy and energy demand. On Tuesday, international crude oil prices fell sharply. Despite a rebound in global stock markets, concerns about a global recession caused by the escalation of the Sino-US trade conflict dominated market sentiment, causing oil prices to fall back to their lowest level in four years. Due to concerns that US President Trump’s latest trade tariffs could push the global economy into recession and reduce global demand for energy. Earlier news reports said that Trump was considering suspending tariffs for 90 days. White House officials quickly denied the report, sending crude oil prices back into decline. A document seen by Reuters showed that the European Commission proposed on Monday to impose a 25% counter-tariff on a range of US goods in response to President Trump’s steel and aluminum tariffs. Goldman Sachs forecasts lowered its oil price forecast. Citigroup and Morgan Stanley also lowered their forecasts for Brent. Saudi Arabia announced a sharp cut in crude oil prices for Asian buyers on Sunday, bringing May crude oil prices to the lowest level in four months.
The current crude oil market is experiencing the concentrated release of multiple negative factors. From a technical perspective, WTI crude oil continuous contracts show typical bearish signals in the 60-minute, 240-minute and daily level charts, and the trend pressure is clear. On the 4-hour chart, WTI crude oil prices struggled to continue to rise above $72.00 last week. Prices formed a short-term top and started a new round of decline, falling below $70.00. Oil prices fell steadily, breaking the key point of $65.60. The bears even pushed the price down to below $62.10. In the end, the price tested the $58.78 line. The recent volatility low was formed near $60, and the price is currently consolidating its downward trend. On the upside, the immediate resistance level is near the $61.51 (14-hour moving average) level. Immediate support is around the $60 (market psychological level). The next major support for WTI is around $56.00 (round number). If the price breaks down, it may fall to the $55.00 level.
Today, consider going long on crude oil around 57.60, stop loss: 57.40; target: 59.00; 59.20

Spot gold
On Tuesday, although the weaker dollar and escalating trade tensions supported gold prices, gold narrowed its earlier gains as U.S. Treasury yields rose. Spot gold traded near $3,000 on Tuesday, falling nearly 2% on Monday as investors turned to the dollar as a safe haven after the full imposition of tariffs by the United States sparked concerns about a global recession. However, analysts remain bullish on gold given the dire economic situation. Amid market turmoil, investors turned to cash and other safe-haven currencies such as the Swiss franc and the yen, which caused gold to retreat, bringing the risk of a deeper correction. It should be noted that although Fed Chairman Powell did not say that the Fed was eager to resume rate cuts, traders in federal funds rate futures increased their bets on the number of rate cuts the Fed will make this year. Traders currently expect a 95 basis point rate cut by the end of the year, with the first rate cut most likely in June, lower than the 122 basis point rate cut pricing a few hours ago. The market believes that the probability of a rate cut in the United States in May is about 57%. Rate cuts will increase the appeal of non-interest-bearing gold.
Recently, the spot gold price once fell below the psychological barrier of $3,000, triggering technical concerns in the market about whether the gold bull market has peaked. However, the technical indicators have shown obvious divergence. On the daily chart, gold prices have formed a clear upward channel since mid-March, but recently hit the upper track of the Bollinger Band and began to fall. After breaking through the historical high of 3167.60, gold prices have shown a typical upward exhaustion pattern. The MACD indicator of technical indicators shows DIFF:43.46, DEA:48.65, MACD:-10.39, and the green kinetic energy column begins to expand, indicating that short-term downward momentum is accumulating. The current gold price faces multiple technical resistances, among which $3,038.00 (20-day simple moving average) and $3,055.00 (14-day simple moving average) constitute the main resistance range for short-term rebound. The support below is mainly concentrated in the $2,972-2,971 area, which is the multi-week low hit earlier on Monday. Now it seems to protect the upcoming downward space, followed by the 50-day simple moving average, which is about $2,942.70. As a recent low, if it is lost, it may trigger a deeper adjustment.
Consider going long on gold today before 2,978, stop loss: 2,974; target: 3,000.00; 3.005.00

AUD/USD
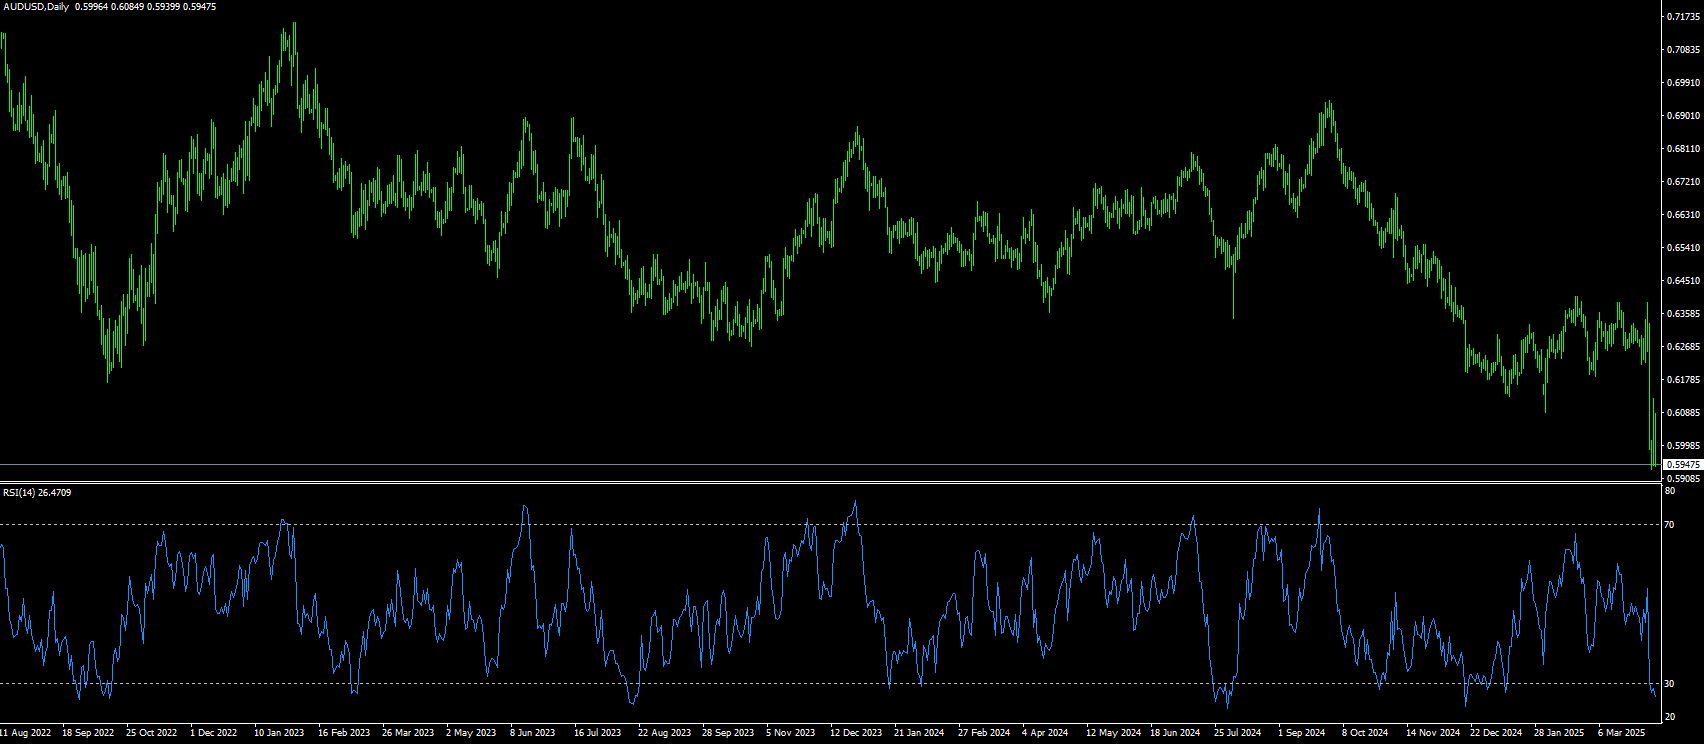
The latest round of tariff announcements from Washington - cumulative import duties on Chinese goods exceeding 100% - continue to exert downward pressure. Technically, AUD/USD remains tilted to the downside, but mixed signals from oscillators suggest that consolidation may occur in the short term. AUD/USD recovered some lost ground around 0.6050 during the Asian intraday session on Tuesday. USD/USD briefly moved higher as the broad tariffs imposed by US President Trump on trading partners sparked fears of a US recession. Uncertainty surrounding Trump's new tariff policy could increase inflation and make a US recession more likely. Traders are increasing bets that the US Federal Reserve will cut interest rates aggressively this year. On the Australian dollar front, rising speculation that the Reserve Bank of Australia may cut interest rates faster and more aggressively than previously expected could weaken the Australian dollar in the short term. Meanwhile, China announced last Friday that it will impose a 34% reciprocal tariff on the United States, effective Thursday, as a retaliatory response to Trump's tariffs. The escalating trade war between the world's two largest economies will hurt the Australian economy and put pressure on the Australian dollar, as China is its largest trading partner.
The technical backdrop for AUD/USD remains distinctly bearish at the start of the week. The pair is hovering in the middle of the day's range, bouncing slightly off early lows. However, bearish momentum remains entrenched, with the technical indicator MACD on the daily chart printing a new red bar and retaining a clear sell signal. The 14-day relative strength index (RSI) is at 25.95, temporarily in oversold territory, although the decline has slowed slightly compared to Friday. Despite the downward pressure, some mixed signals have emerged. The Commodity Channel Index (CCI) unexpectedly points to a possible oversold bounce, while bull/bear power remains flat, suggesting temporary consolidation. The overall trend remains negative, with sell signals clearly visible on the major moving averages. The 10-day exponential moving average and the 20-day; 100-day and 200-day simple moving averages are all aligned downward, further reinforcing the dominant downtrend. Therefore, the target below is 0.5932 (low at the beginning of the week) level, and then 0.5900 (round mark). On the upside, focus on 0.6000 (round psychological mark), and 0.6085 (Tuesday's high).
Today, consider going long on the Australian dollar before 0.5940, stop loss: 0.5925; target: 0.6000; 0.6020.
GBP/USD
The British pound recovered some gains against the US dollar on Tuesday, rising 0.34% on renewed hopes that tariffs are indeed being used as a negotiating tool, with US President Trump saying "many countries are negotiating deals with us." GBP/USD traded at 1.2765, rebounding from intraday lows around 1.2700. GBP/USD rebounded towards the 1.28 level on Tuesday after a sharp fall at the beginning of the week. After a brief respite, the US dollar has regained its dominance over risk-averse flows, and weakening investor sentiment has supported the dollar across the board. After a week of tension, the US has fully shifted to a protectionist trade stance, and after imposing an additional 34% tariff on Chinese goods, China has also hit back with a retaliatory tariff of 34% on all goods from the United States. Lacking other means of resolving the problem, the Trump administration has threatened to impose an additional 50% tariff on all Chinese goods, which is expected to take effect on April 8. US data is in the spotlight again this week; US CPI inflation data is scheduled to be released on Thursday, and US PPI inflation and the University of Michigan Consumer Confidence Index survey results will be released on Friday.
The 14-day relative strength index (RSI) indicator, a technical indicator on the daily chart, fell to around 44.00, indicating that GBP/USD is weak in the short term. At this stage, the pair has broken through the 200-day simple moving average of 1.2812 and aims to challenge the 50-day simple moving average of 1.2738. If broken, the next target will be 1.2700, followed by the 100-day simple moving average of 1.2628. In the event of an unexpected rebound in GBP, the first resistance will be the psychological level of 1.2800, followed by the 200-day simple moving average of 1.2812. Further upside targets are at 1.2934 (Monday's high).
Today's recommendation is to go long GBP before 1.2765, stop loss: 1.2750, target: 1.2820, 1.2830

USD/JPY
JPY/USD retreated slightly, paring some of its modest intraday gains, but the short-term bias still seems to favor bullish traders. Concerns that tougher US reciprocal tariffs could have a negative impact on the Japanese economy, coupled with a slight improvement in global risk sentiment, acted as a headwind for the safe-haven yen. However, the market's growing acceptance of the Bank of Japan's expectations of continued rate hikes until 2025, along with signs of expanding inflation, could curb aggressive bets on yen shorts. Meanwhile, U.S. President Donald Trump’s widespread reciprocal tariffs have raised the risk of a global economic slowdown. This further limited any notable losses for the yen and coupled with the emergence of a fresh round of dollar selling, kept the USD/JPY pair below 148.00 during the Asian session. Traders increased bets that a tariff-driven slowdown in the U.S. economy could force the Federal Reserve to resume its rate-cutting cycle soon. This puts the dollar bulls on the defensive and further favors the low-yielding yen.
From a technical perspective, the USD/JPY pair failed to find acceptance above the 148.00 mark and the subsequent slide warranted caution for bullish traders. Moreover, oscillators on the daily chart remain in negative territory and are still some distance from the oversold zone, validating the pair’s short-term negative outlook. However, a sustained break above the Asian session high, around the 148.12 area, could trigger a short-term covering rally and push the spot price to the intermediate resistance of 148.70 and, in turn, towards the 149.00 round mark. The next relevant resistance is in the 149.35-149.40 area, which, if broken, will pave the way for retaking the 150.00 psychological level. On the other hand, the 146.00 level may provide some support, and if it falls below it, the USD/JPY may accelerate its decline back to the 145.40 area. Some follow-up selling may make the spot price vulnerable and it may further break below the 145.00 psychological level to test the multi-month lows hit on Monday, around the 144.55 area. The subsequent decline may drag the currency pair towards the 144.00 level.
Today, it is recommended to short the US dollar before 146.50, stop loss: 146.70; target: 145.50, 145.30

EUR/USD
The euro regained momentum against the dollar on Tuesday, rising back to 1.0960 after two consecutive days of correction, benefiting from the overall weakness of the dollar and investors' optimistic expectations for the future path of the Fed's rate cuts. According to market surveys, as expectations of four rate cuts by the Federal Reserve this year have increased, the US dollar index has fallen under pressure, providing a respite for the euro. At the same time, US President Trump's actions to increase tariffs have triggered market concerns about an economic slowdown, further weakening risk appetite for US dollar assets. EUR/USD has been fluctuating in a wide range of 1.0880-1.1040 since the weekend, and is currently trading just below 1.0950. It is worth noting that the short-term fair value of EUR/USD has remained relatively stable below 1.090 in the past week. When the currency pair soared to 1.110, it was in a severely overvalued area. The short-term fair value is highly dependent on the two-year swap rate spread, which is currently around 145 basis points. As the ECB is increasingly likely to cut interest rates next week, and the Fed has not yet sent any signals to justify the market's pricing of four rate cuts in 2025, EUR/USD may face slight downside risks from an interest rate perspective.
The short-term trend of EUR/USD has regained its footing above technical support, and the overall trend is biased to the upside, coupled with the support of the weak US dollar and safe-haven fund flows. From a technical perspective, EUR/USD found obvious support near the 20-day moving average (1.2860) at the beginning of the week and successfully stopped falling and rebounded. The technical indicators of the daily chart (such as MACD and RSI) remain positive, indicating that short-term bulls are dominant. If the euro can successfully break through the psychological level of 1.1000 and the short-term downward trend line resistance {1.1000 is a double resistance in terms of sentiment and technology. Once it breaks through, it will attract a large number of momentum traders to enter the market}, it will open up further upside space, with targets pointing to 1.1050 and the year's high of 1.1147 respectively. Although the euro is technically bullish, it still faces some risk factors that limit its upside space. If global risk sentiment improves or trade concerns are temporarily eased, the US dollar may rebound temporarily, thus suppressing the euro. The current short-term support level is at the 1.0900 mark. If it falls below, it is likely to drop to 1.0860 (20-day moving average). If the euro falls below the 20-day moving average, it will further test the 1.08 market psychological mark, which is an important dividing line for the medium and long-term trend. If it is effectively broken, the euro will face the risk of trend reversal.
Today, it is recommended to go long on the euro before 1.0950, stop loss: 1.0935, target: 1.1000, 1.1020.

Disclaimer: The information contained herein (1) is proprietary to BCR and/or its content providers; (2) may not be copied or distributed; (3) is not warranted to be accurate, complete or timely; and, (4) does not constitute advice or a recommendation by BCR or its content providers in respect of the investment in financial instruments. Neither BCR or its content providers are responsible for any damages or losses arising from any use of this information. Past performance is no guarantee of future results.
Lebih Liputan


Pendedahan Risiko:Instrumen derivatif diniagakan di luar bursa dengan margin, yang bermakna ia membawa tahap risiko yang tinggi dan terdapat kemungkinan anda boleh kehilangan seluruh pelaburan anda. Produk-produk ini tidak sesuai untuk semua pelabur. Pastikan anda memahami sepenuhnya risiko dan pertimbangkan dengan teliti keadaan kewangan dan pengalaman dagangan anda sebelum berdagang. Cari nasihat kewangan bebas jika perlu sebelum membuka akaun dengan BCR.

 English
 简体中文
简体中文
 繁體中文
繁體中文
 Bahasa
Melayu
Bahasa
Melayu
 Tiếng
Việt
Tiếng
Việt
 ไทย
ไทย
 日本語
日本語
 한국어
한국어
 ភាសាខ្មែរ
 español