


0
US Dollar Index
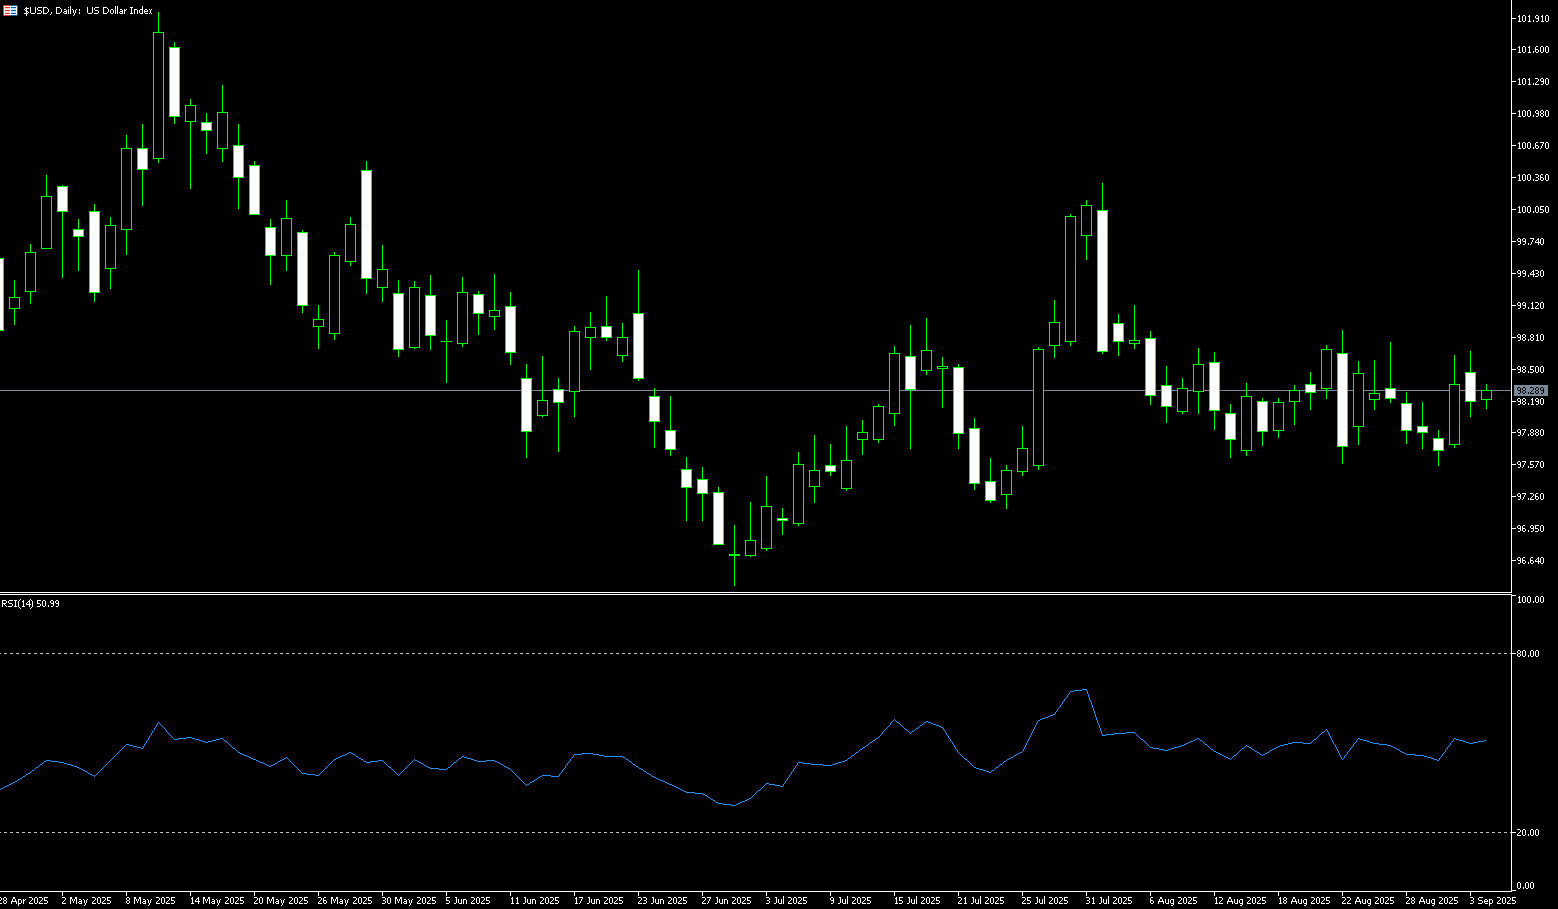
The US dollar index rebounded sharply last week from its post-Federal Reserve rate cut low of 96.22 to 98.80 before the weekend, as the Fed signaled a less dovish policy stance than the market expected. Fed Chairman Powell framed the move as a risk-management measure amid a slowing labor market, emphasizing the need for hasty policy easing. Elsewhere, the Bank of Canada cut interest rates, while the Bank of England maintained its policy unchanged. The US dollar index is expected to be largely flat this week, erasing most of its losses from the previous period. The path of the Fed's rate cuts is a key variable for the US dollar. The September 25 basis point rate cut is partially priced in, with markets anticipating another 25-50 basis point cut in November or December. If the pace of rate cuts meets expectations (50-75 basis points cumulatively), the US dollar index could fall to the 98-100 range. If it exceeds expectations (e.g., by more than 75 basis points), it could fall below 98, testing the secondary support level of 95.80. A tightening of liquidity towards the end of the quarter (e.g., a surge in SRF usage) could temporarily push up US dollar funding costs, supporting a test of 102-103 for the US dollar index by the end of September. However, synchronized easing by global central banks (such as those in the Eurozone and Japan) may maintain the dollar's relative appeal and limit its downside.
Last week, the US dollar index rebounded sharply from its post-Federal Reserve rate cut low of 96.22 to 97.80 before the weekend. Currently, the US dollar index has been fluctuating between 99.05 and 96.22 since August. The US dollar index is currently trading around 97.70-97.75, near the middle axis of the Bollinger Band (97.75). Technically, the US dollar index has formed a range of congestion in recent weeks between 96.87 (the lower Bollinger Band line) and 98.23 (the 89-day simple moving average). The 14-day Relative Strength Index (RSI) on the daily chart is near 48, in a neutral to weak range, indicating a temporary balance between bulls and bears. The moving average system is in a bearish configuration, but the short-term moving average is converging with the current price, indicating insufficient momentum. A directional breakout requires fundamental catalysts. If the US Dollar Index fails to break through the 98.00 round-number mark and the 98.23 (89-day simple moving average), short-term volatility is likely, with a high risk of false breakouts. Key support lies at 97.00 (round-number mark) and 96.85 (Bollinger Bands). A break below these levels could lead to a retest of last week's low of 96.22.
Today, consider shorting the US Dollar Index at 97.80, with a stop-loss at 97.90 and targets at 97.20 or 97.10.
WTI Spot Crude Oil
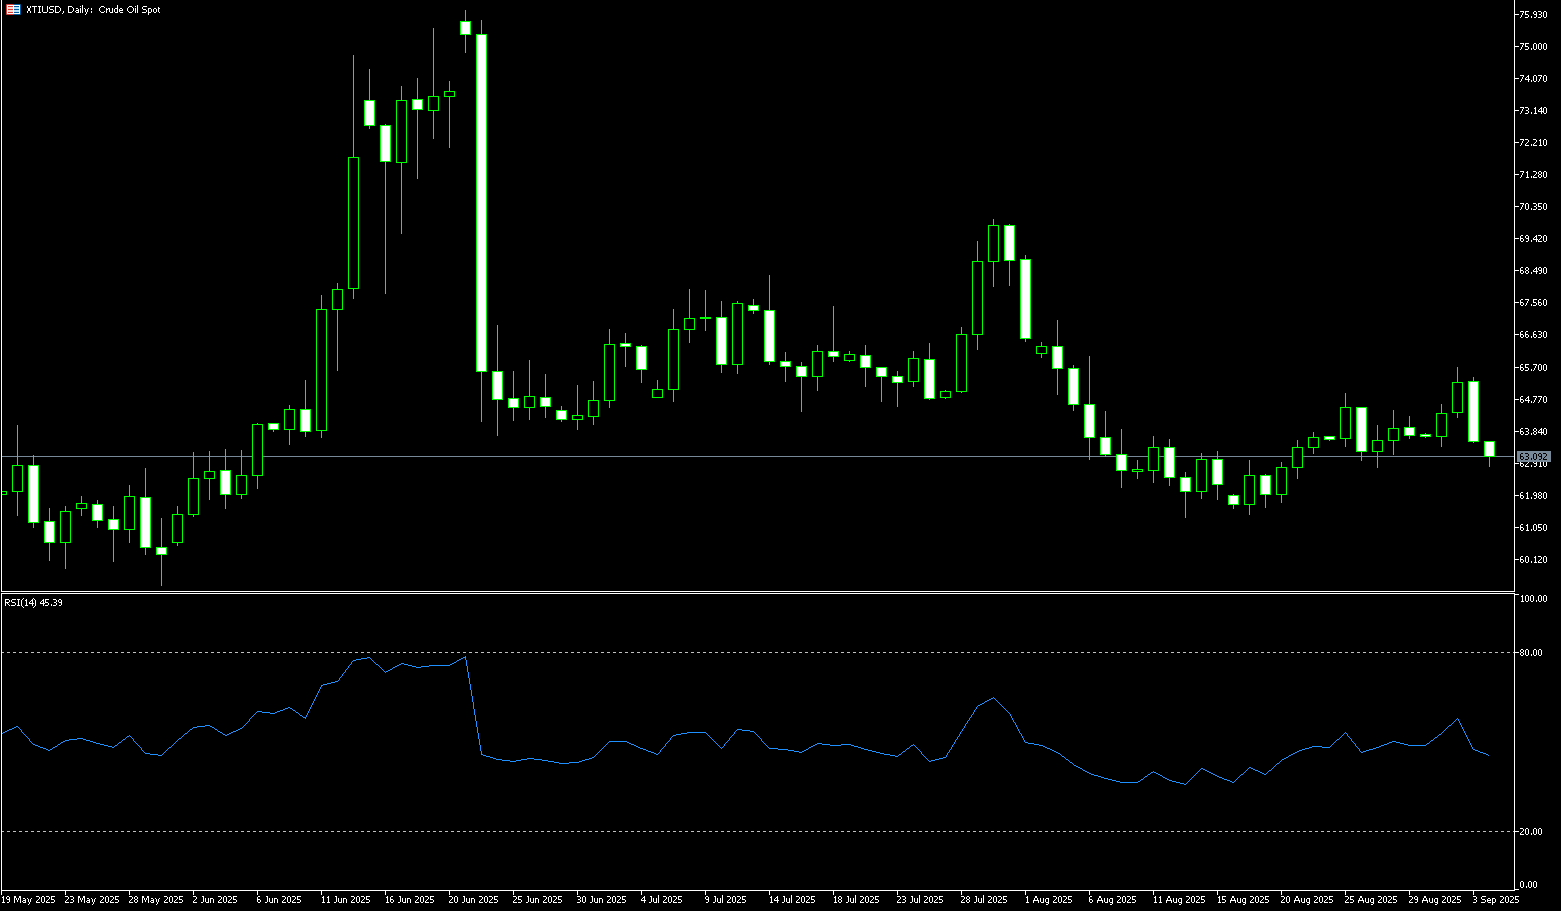
Last week, WTI crude oil fell slightly by 0.07% to close at $62.32 per barrel, marking its third consecutive day of decline as ample supply and concerns about weak demand outweighed hopes that the Federal Reserve's recent interest rate cut would boost consumption. Strong global production, ongoing refinery maintenance, and rising US distillate inventories continue to limit short-term price gains. Repeated attacks on Russian energy infrastructure in Ukraine and potential international tariffs provided some support, but persistent oversupply concerns kept prices in check. Traders also focused on developments in US-China-India relations, which could affect Russian crude flows, while a stronger dollar dampened demand for dollar-denominated commodities. Despite the Federal Reserve's 25 basis point rate cut, signs of labor market weakness and slowing economic activity dampened optimism for a sustained rebound. On the other hand, while the Federal Reserve cut interest rates as expected, investors are viewing this as a "risk-management" move aimed at mitigating downside risks to the economy, rather than as part of a larger easing strategy. This rate cut, along with the two expected rate cuts this year, will be a positive factor, offsetting supply pressures from the gradual lifting of OPEC+ production cuts.
From the daily chart, US crude oil prices have been consolidating and fluctuating within the lower end of the $62.00-$64.40 range (around $62.32) in recent weeks. The 14-day relative strength index (RSI) is currently around 44.75, indicating a stalemate between bulls and bears at the current level, with bears having a slight advantage. Currently, WTI has failed to break through the psychologically important $64.00 level. Until the market sustains a breakout above the 100-day simple moving average (SMA) at $64.31, the market remains at risk of a downside breakout. If support at last week's low of $62.28 and this week's low of $62.28 fails, bearish risk will intensify, potentially accelerating the decline to $60.78 (June 2 low). Stronger support lies at the psychologically important $60.00 level. Above, resistance is concentrated at $64.00 (a psychologically important level) and the 100-day SMA at $64.31. A break above this level could challenge $65.61 (the 50.0% Fibonacci retracement level from $70.02 to $61.20). A break below this level could lead to a move towards $66.65 (the 200-day SMA).
Consider a long position in crude oil at $62.15 today. Stop loss: $62.00, target: $63.50. 63.80
Spot Gold
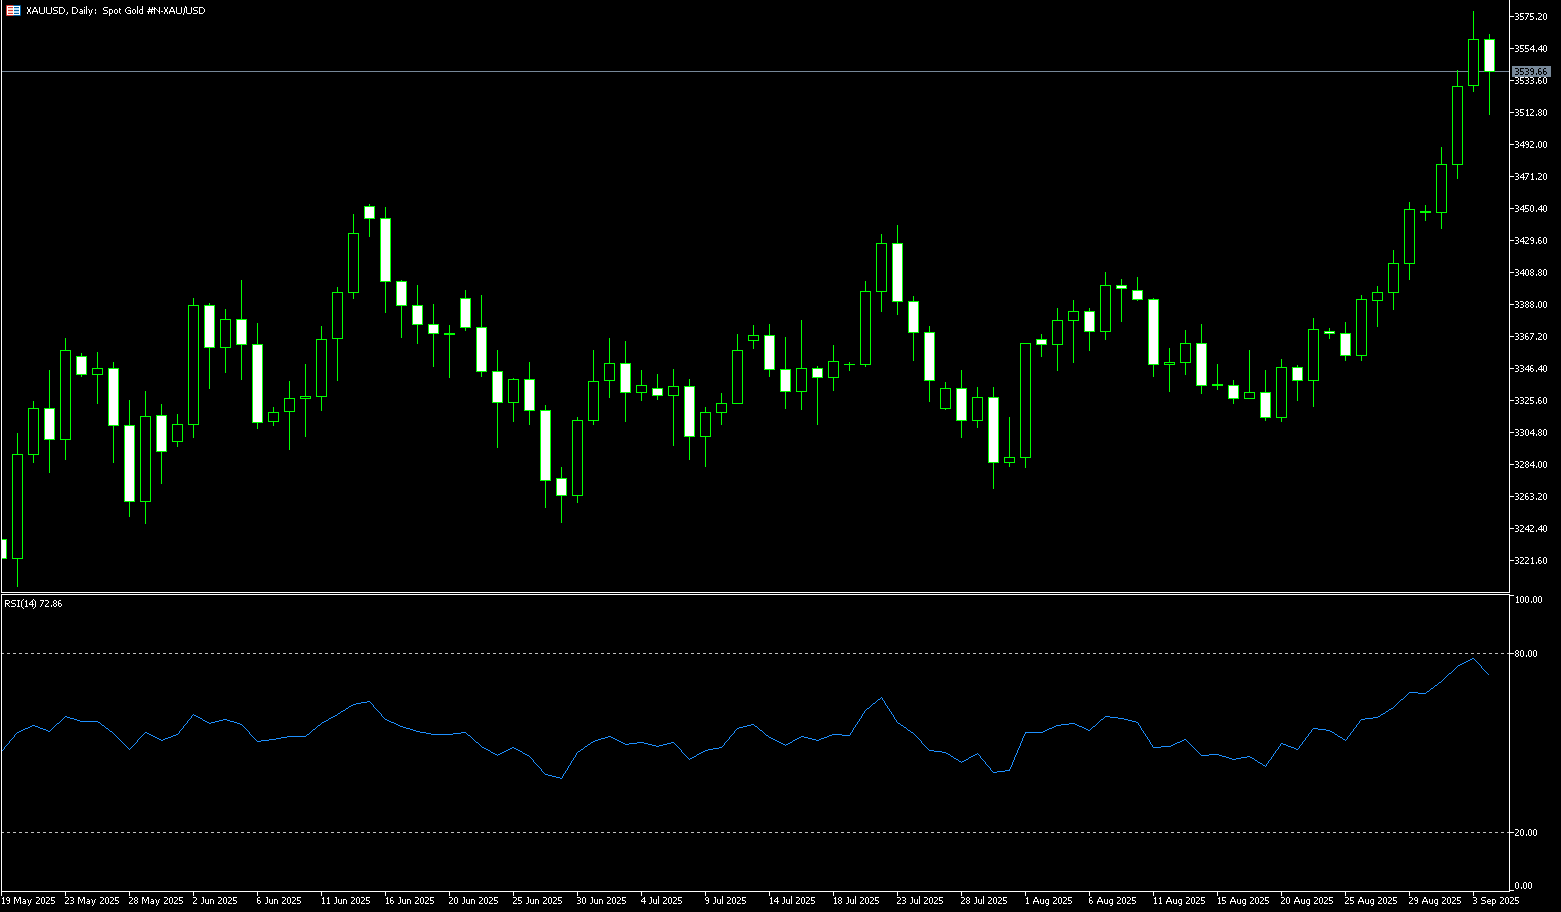
After hitting a new all-time high of $3,707.70 mid-week, gold prices continued to experience a technical correction in the second half of the week, reaching a low of $3,626.60, signaling continued profit-taking by bulls at high levels. Before the weekend, gold prices resumed their upward trajectory, reaching a high of $3,685. This marked the fifth consecutive week of gains, as investors reacted to the Federal Reserve's first rate cut of the year and focused on future policy signals. After the Fed lowered its benchmark interest rate for the first time since December, the market continued to price in the central bank's outlook, leaving room for further rate cuts. However, policymakers warned that persistent inflation could slow the pace of future rate cuts. Chairman Jerome Powell also framed the move as a cautious response to a cooling labor market, emphasizing that the Fed does not intend to accelerate the pace of its rate cut cycle and will proceed cautiously. Despite this, gold has risen approximately 39% year-to-date, repeatedly hitting record highs amidst Fed rate cuts, ongoing geopolitical tensions, and strong Fed demand expectations. On the other hand, heightened geopolitical tensions in the Middle East could boost the price of gold, a traditional safe-haven asset.
Gold prices have shown a clear bullish trend on the daily chart in recent weeks. After hitting an all-time high of $3,707.70 mid-week, prices began to correct, falling to a low of $3,628.00 before rebounding sharply to around $3,685. Currently, Gold prices are finding support near $3,626.60 (last week's low) and $3,625.30 (the 14-day simple moving average). This level, previously a resistance level, has now become key support, limiting short-term downside. The daily candlestick chart shows consecutive bullish breakouts followed by minor pullbacks, forming a typical "bull flag" consolidation structure. The 14-day Relative Strength Index (RSI) is in the overbought zone, indicating short-term profit-taking pressure, but the overall trend remains bullish. Short-term resistance is concentrated at $3,700, a break of which could revisit the all-time high of $3,707.70, and the $3,750 area. A break above this range could extend gold's recent upward momentum. A break below $3,645 could target $3,626.60 (last week's low) in the short term. and the $3,625.30 (14-day simple moving average) area. It could eventually test the $3,600 level.
Consider a long position in gold at $3,680 today, with a stop-loss at $3,675 and targets at $3,698 and $3,705.
AUD/USD
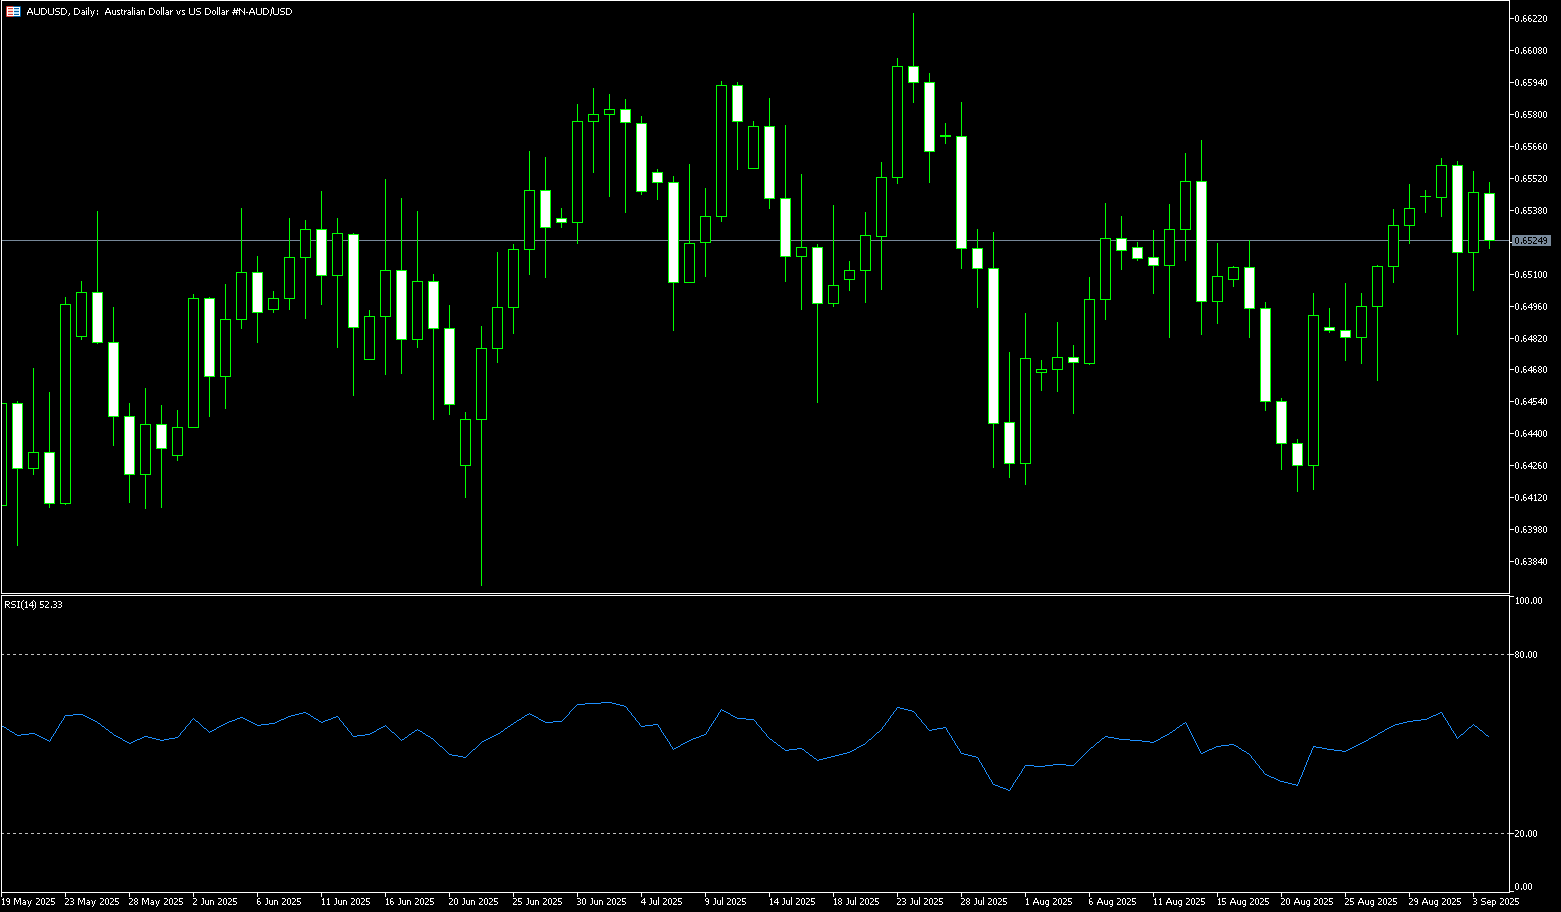
The Australian dollar fell from $0.6707 to below $0.6600 last week, reaching a low of $0.6593, and earlier dipped to $0.6585. This marked the third consecutive day of decline, retreating from an 11-month high reached mid-week. The Australian dollar is also poised for its first weekly decline in four weeks, pressured by a weaker-than-expected jobs report. The report showed Australia's seasonally adjusted employment change was -5.4K in August, down from 26.5K in July (revised from 24.5K), while the market consensus was for 22K. Meanwhile, the unemployment rate remained stable at 4.2% in August, as expected. The likelihood of further Reserve Bank of Australia rate cuts has decreased. The Australian dollar has found support amidst a weak performance. Markets are now pricing in only a 20% chance of a rate cut in September, with a 70% probability for a November rate cut. Above-target inflation is keeping policymakers cautious. The central bank noted that monthly data is less reliable. Investors also await next week's Purchasing Managers' Index data to assess the country's economic health.
AUD/USD plummeted last week from an 11-month high of 0.6707, falling below the psychological level of 0.6600 to 0.6585. Technical analysis on the daily chart suggests that despite a sharp reversal in the latter part of last week, However, the 14-day Relative Strength Index (RSI) remains near 53, suggesting that AUD/USD's upward momentum remains intact, reinforcing the bullish bias. However, short-term price momentum has weakened. The pair may find initial support at the psychological level of 0.6577 and the lower line of the ascending channel at 0.6585. A break below these levels would weaken the bullish bias and lead AUD/USD to test the 34-day simple moving average, around 0.6543, and further down to the 0.6500 round-figure mark. On the upside, the pair could target the 5-day simple moving average of 0.6644. A break above this level would improve short-term price momentum and support the pair towards the 0.6700 level, the 11-month high of 0.6707 reached on September 17, and then the upper line of the ascending channel at 0.6720.
Consider a long position on the Australian dollar at 0.6580 today, with a stop-loss: 0.6570, Target: 0.6640, 0.6650
GBP/USD
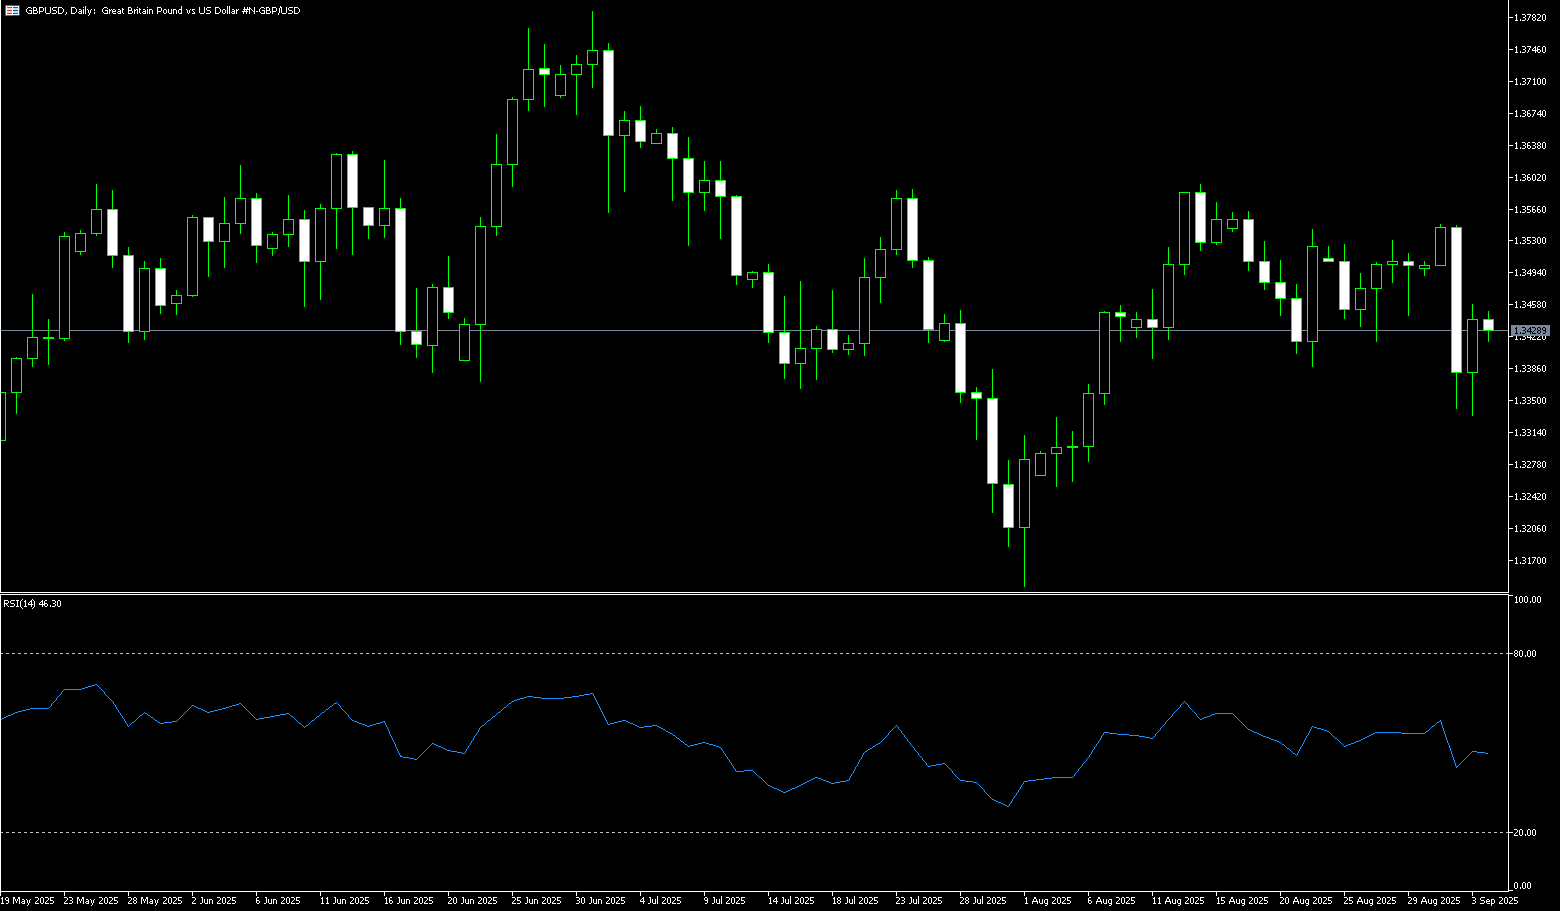
The British pound fell sharply against major currencies to a near three-week low of 1.3463 before the weekend as long-term UK gilt yields surged due to a surge in public sector borrowing in August. The yield on 30-year UK gilts jumped over 1%, approaching 5.50%. Data showed that public sector net borrowing reached £18 billion, the highest level for the month in five years. Economists expected government borrowing to be significantly lower, at £12.8 billion. The UK's ballooning fiscal woes are expected to force the government to The government is expected to cut public spending, raise taxes, or both in the upcoming autumn budget. Data shows that sales remain strong for retailers without physical stores, such as online sellers and stalls. Demand also remains strong for textile, clothing, and footwear stores. Meanwhile, Bank of England officials have agreed to slow the pace of quantitative tightening. In its monetary policy announcement last Thursday, the Bank of England said it would sell £70 billion worth of UK gilts between October 2025 and September 2026, down from £100 billion sold over the previous 12 months.
The daily chart shows that Before the weekend, GBP/USD retreated from a near two-month high of 1.3726 to a three-week low of 1.3463. Earlier, GBP/USD faced strong selling pressure after a false breakout from the resistance level of an ascending triangle pattern. The 14-day Relative Strength Index (RSI) has fallen sharply from a high of 62.50, below 50.00 to negative territory at 46.00. A break below 40.00 would signal renewed bearish momentum. Meanwhile, GBP/USD has fallen below its 9-day simple moving average, trading around 1.3498, suggesting a potential short-term bearish trend. Therefore, a clear break below 1.3498 and the 1.3500 level would be a key support level. Further downside resistance could threaten a challenge to the 1.3400 level. and 1.3395 (the lower Bollinger Band line). A break below this level would target 1.3333 (the low of September 3). On the upside, the 9-day simple moving average at 1.3568 will act as key resistance. A break below this level would retest 1.3645 (the upper Bollinger Band line), ultimately targeting last week's high of 1.3726.
Consider going long on the GBP at 1.3458 today, with a stop-loss at 1.3445 and a target at 1.3520. 1.3535
USD/JPY
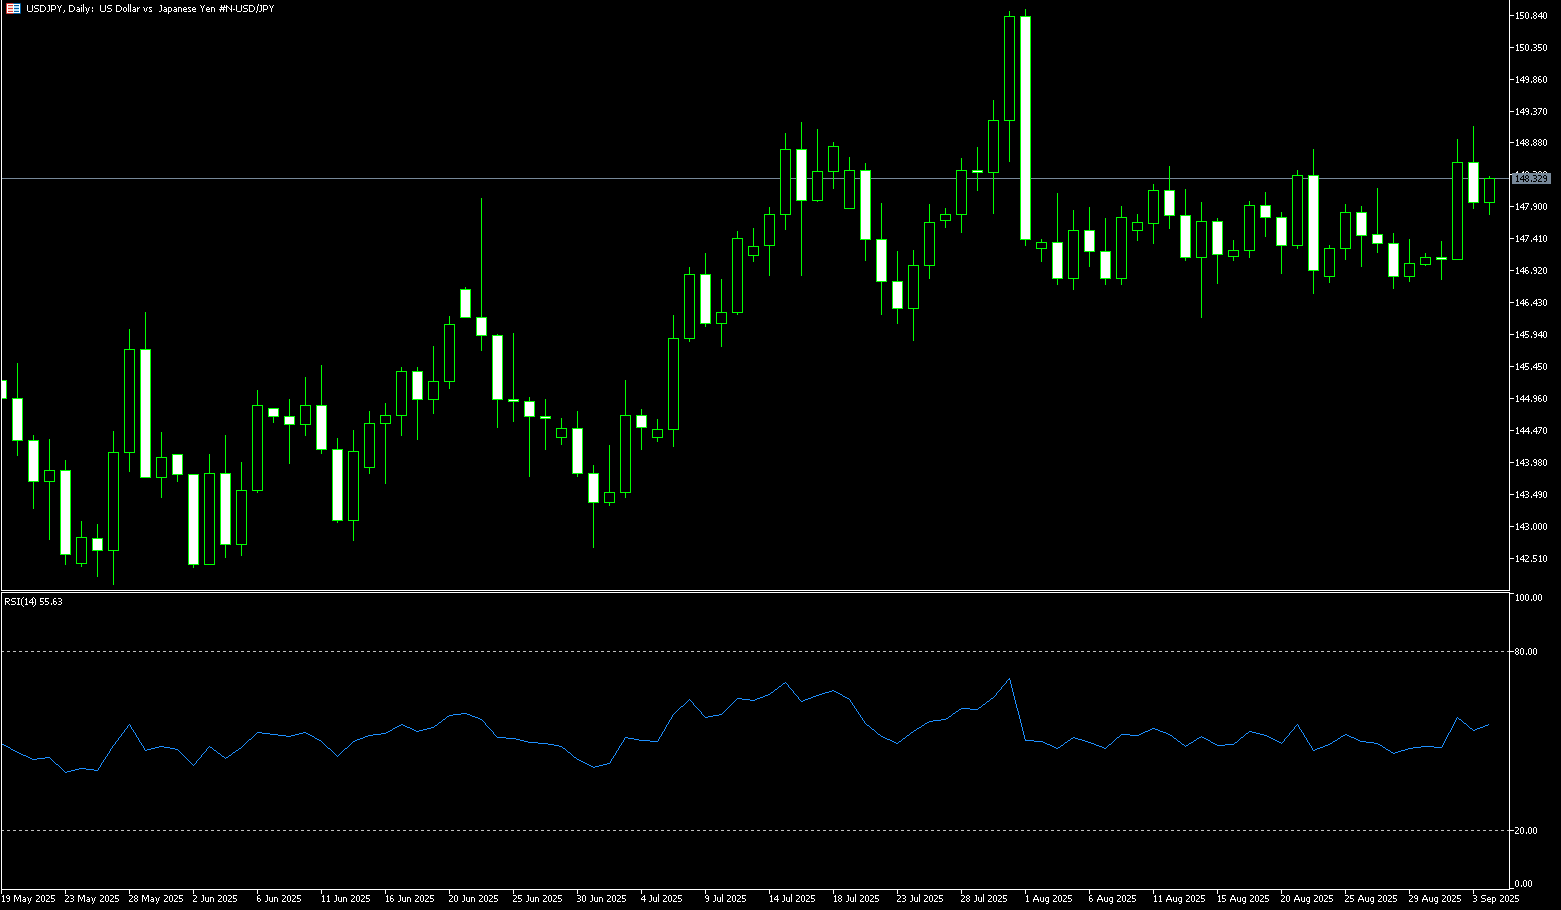
The Bank of Japan announced last Friday that board members decided to maintain their short-term interest rate target at 0.4%-0.5% following a two-day monetary policy review. This decision was in line with market expectations. The Bank of Japan maintained a pause in its interest rate hike cycle for the fifth consecutive meeting, following a 25 basis point increase in January. USD/JPY came under renewed selling pressure, testing buying support below 147.50. This ended a two-day decline after the Bank of Japan, as expected, held its policy rate at 0.5% for the fifth consecutive meeting. The central bank stated that the economy is gradually recovering, but noted some weaknesses and warned of risks posed by global trade policies. The central bank also announced a unanimous decision to begin selling its ETF and J-REIT holdings. Meanwhile, data showed that Japan's core inflation rose by 2.7% in August, falling for the third consecutive month to its lowest level since November 2024. The yen had fallen by about 1% in the previous two trading days, as the US dollar strengthened after the Federal Reserve signaled a less dovish outlook than expected. Earlier this week, the Federal Reserve cut interest rates by 25 basis points and projected two more rate cuts this year, while also indicating only one more rate cut in 2026.
The 14-day Relative Strength Index (RSI) on the daily chart is near the mid-53 level. Coupled with last Friday's close of a "doji" pattern, the short-term trend is unclear, with the pair currently trading within a narrow range. From a technical perspective, USD/JPY's resistance around last week's high of 148.28 represents a bullish bet. The pair may first face strong resistance in the 148.00-148.28 area. A sustained breakout above this resistance level could push the spot price to the 200-day simple moving average of 148.64, potentially challenging the round number of 149.00 and the monthly high of 149.15. On the downside, key support lies at 147.00 and the 75-day simple moving average of 146.83. Any significant decline could find some support at 146.25 (the 100-day simple moving average), followed by the 146.00 round-figure mark. A break below the latter would expose last Wednesday's low, around 145.48. Below this level, the pair could accelerate its decline, challenging the psychological level of 145.00.
Consider shorting the USD at 148.18 today. Stop loss: 148.35, target: 147.20, 147.00.
EUR/USD
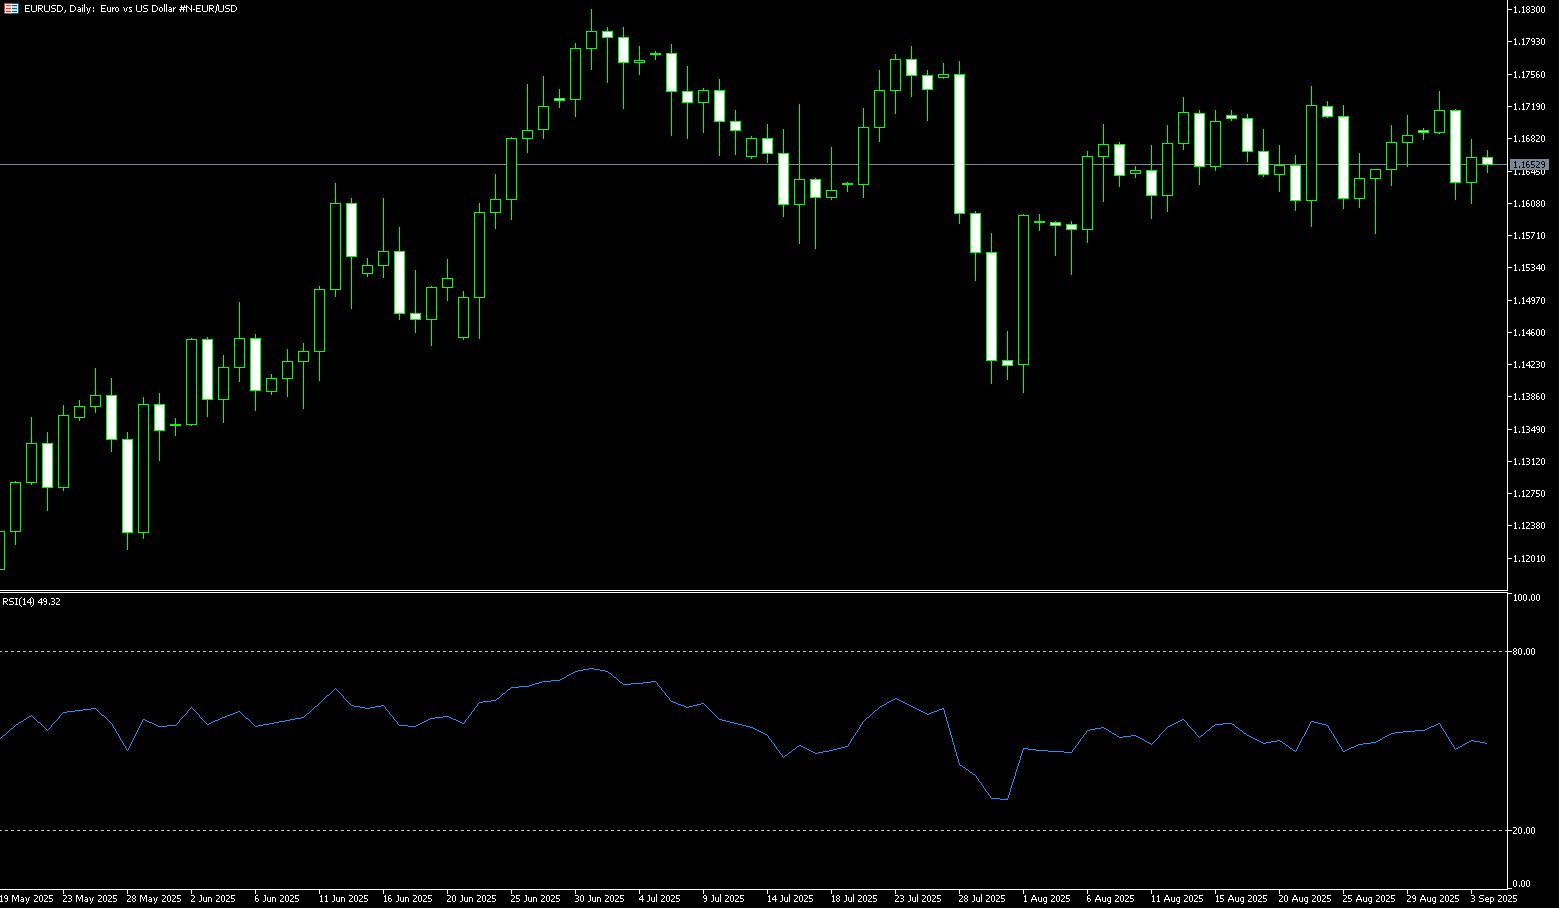
The EUR/USD pair exhibited a "high-rise-lower" pattern last week. It reached a four-year high of 1.1919 before retracing below 1.1800 to a low of 1.1729, but the overall bullish bias remained. And it closed higher for the third consecutive week. A sharp drop in U.S. initial jobless claims and a strong rebound in the Philadelphia Fed manufacturing survey provided additional support to the dollar. In Europe, there were fewer events on the calendar, but a new wave of anti-austerity protests in France was gaining momentum, which put pressure on the euro. Hundreds of thousands of people gathered in major French cities on Thursday to pressure French President Emmanuel Macron and new Prime Minister Sebastien Le Cornu to cancel the spending cuts proposed by former Prime Minister François Bailleul. Meanwhile, the U.S. Supreme Court said it would decide on trade on November 5. The legality of tariffs, one of the key measures of U.S. President Donald Trump's second term, has been challenged after a lower court ruled that Trump exceeded his authority under federal law established under the emergency situation.
Last week, EUR/USD surged and retreated on the daily chart, reaching a four-year high of 1.1919 before retracing below 1.1800 to a low of 1.1729. However, the pair maintained an overall bullish bias despite the formation of an "evening star" pattern midweek. While this is a bearish candlestick pattern, bears must break through the low of the 20-day simple moving average at 1.1704 and the 1.1700 round-number mark. If so, the next target is 1.1660 (the low of September 11). Next is the 100-day simple moving average, around 1.1561. The 14-day relative strength index (RSI) supports further gains, remaining below overbought territory (currently at 52.70). Conversely, if EUR/USD rebounds above the psychological level of 1.1800, further gains to 1.1837 (the upper Bollinger Band) are possible. A break below this level could re-test the year's high of 1.1919.
Consider a long position on the euro at 1.1732 today, with a stop-loss at 1.1720 and a target at 1.1790 or 1.1800.
Disclaimer: The information contained herein (1) is proprietary to BCR and/or its content providers; (2) may not be copied or distributed; (3) is not warranted to be accurate, complete or timely; and, (4) does not constitute advice or a recommendation by BCR or its content providers in respect of the investment in financial instruments. Neither BCR or its content providers are responsible for any damages or losses arising from any use of this information. Past performance is no guarantee of future results.
More Coverage


Risk Disclosure:Derivatives are traded over-the-counter on margin, which means they carry a high level of risk and there is a possibility you could lose all of your investment. These products are not suitable for all investors. Please ensure you fully understand the risks and carefully consider your financial situation and trading experience before trading. Seek independent financial advice if necessary before opening an account with BCR.

 English
 简体中文
简体中文
 繁體中文
繁體中文
 Bahasa
Melayu
Bahasa
Melayu
 Tiếng
Việt
Tiếng
Việt
 ไทย
ไทย
 日本語
日本語
 한국어
한국어
 ភាសាខ្មែរ
 español