


0
US Dollar Index
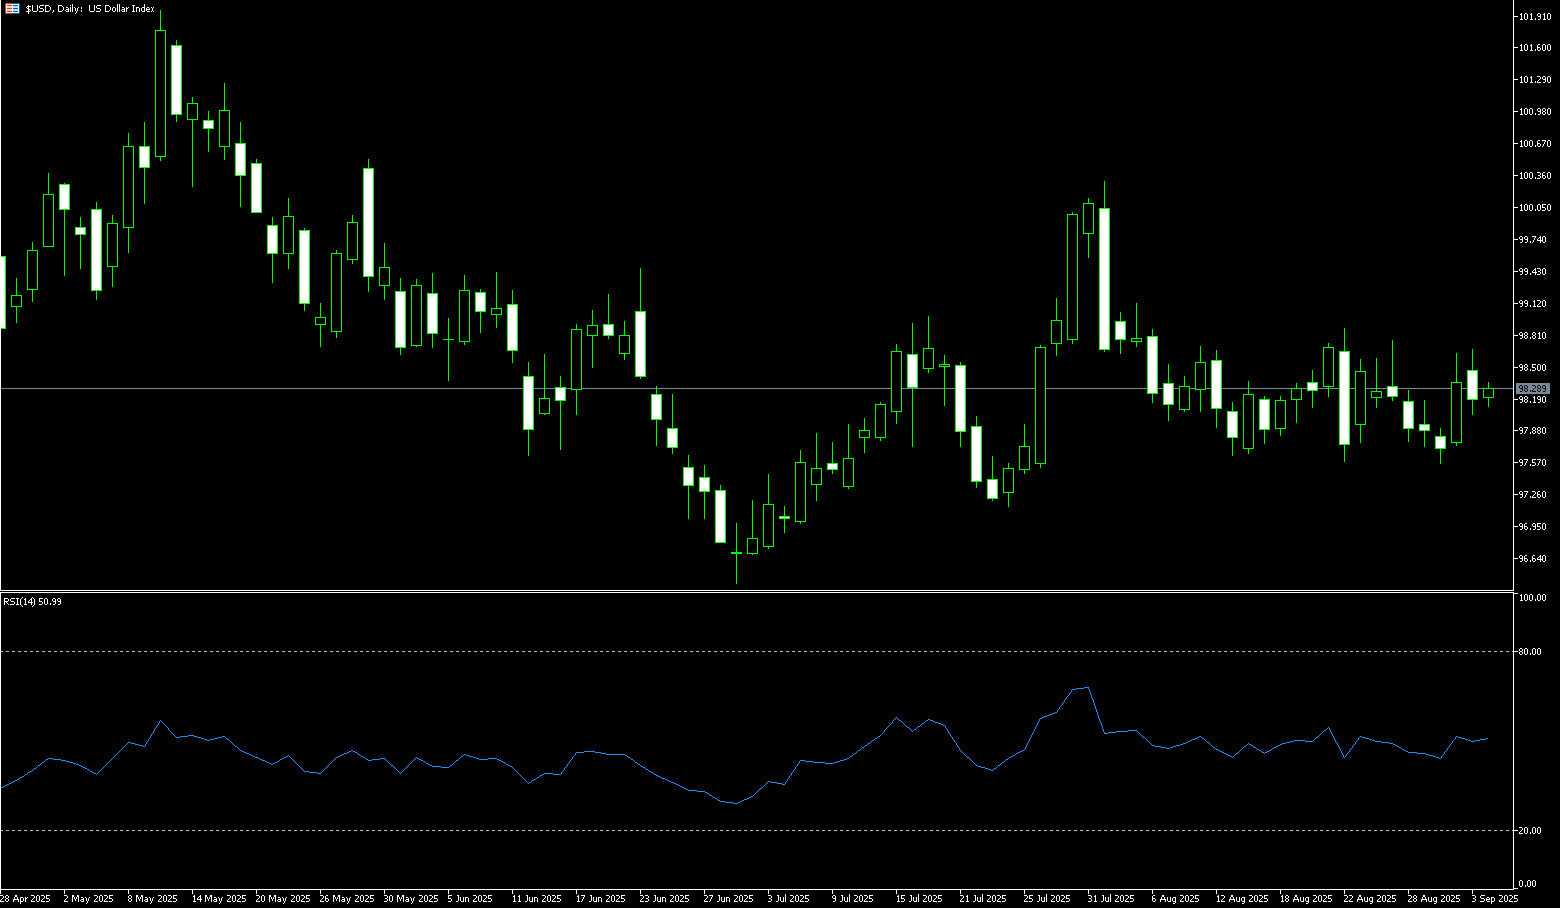
The US dollar index fell to around 97.20 on Tuesday, following losses the previous day as traders interpreted the Federal Reserve's comments on interest rate signals. Last week, the dollar index rallied on strong US economic data and rising Treasury yields, but bullish momentum has faded as interest rate expectations have wavered. Alberto Musallem, president of the St. Louis Fed, a voting member this year, said there is "limited room" for further rate cuts without overly accommodative policy. Furthermore, US Treasury yields remained largely unchanged, and Deutsche Bank, based on recent inflation data, predicts weaker PCE data than feared, potentially easing pressure on the Fed to act again in the near term. Markets still expect two more rate cuts this year, but the ultimate path will be determined by subsequent data and Fed comments.
In the short term, the US dollar index may enter a period of consolidation, with its direction determined by Friday's PCE inflation data and Powell's speech. The psychological resistance level around 98.00 will be a key test for bulls. Technically, the US dollar index faces the risk of a short-term bearish reversal. The US Dollar Index is testing key technical levels, potentially forming a bearish closing reversal top pattern. If this pattern is confirmed, it could trigger a pullback. The 14-day Relative Strength Index (RSI) on the daily chart has fallen to around 43.00, indicating weakness. If the US Dollar Index can successfully break below the 97.00 round-figure mark and the 96.81 Bollinger Band lower line, the next level to watch is 96.22, the September 17 low. If support is found within this range, new resistance could be triggered towards the 97.64 20-day simple moving average and the 98.00 level.
Consider shorting the US Dollar Index at 97.34 today. Stop-loss: 97.50. Target: 96.80, 96.90.
WTI Spot Crude Oil
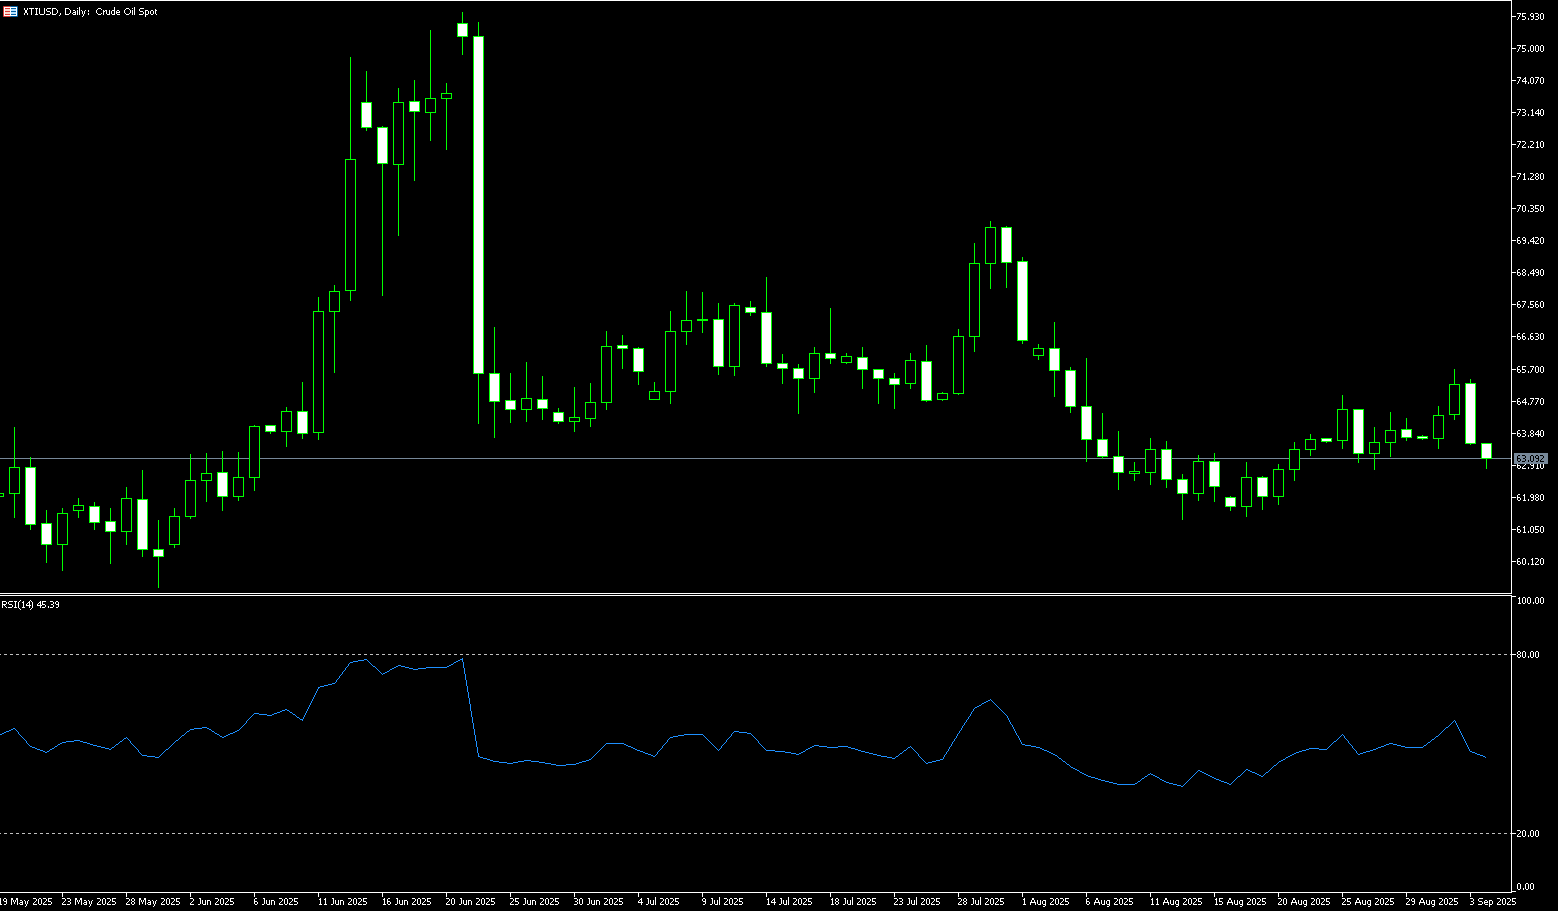
WTI crude oil rose 2.10% to close at $63.60 per barrel on Tuesday, rebounding from a four-day losing streak as geopolitical risks and stalled supply talks overshadowed oversupply concerns. NATO's pledge of a "robust" response to Russian airspace violations, coupled with Ukrainian drone attacks on Russian refineries and pipelines, raised concerns about energy flows. Meanwhile, exports from Iraq's Kurdistan Region remained stagnant, removing approximately 230,000 barrels per day of production from the market and supporting prices. Despite the rebound, rising OPEC+ and non-OPEC production, slowing demand growth, and the adoption of electric vehicles continue to weigh on the outlook. Traders are closely watching inventory data, potential new sanctions on Russian oil, and any Middle East tensions that could impact the market. US crude oil prices surged and then retreated at the start of the week. The daily chart shows that prices have rebounded above $63.00 ahead of schedule, influenced by weekend events in Russia and Poland. The chart shows that the rebound, which occurred before reaching the lower line of the "horizontal channel" at $61.40, prompted short sellers to increase their short positions. This, combined with panic selling following the recent sharp drop in oil prices, pushed prices down to last week's low of $61.00, with $60.78 (the June 2 low) in the foreground. Stronger support lies at the psychologically important $60.00 level. On the other hand, given the repeated failure to break below the lower line of the "horizontal channel" and the significant short-term decline in crude oil prices, coupled with a high deviation rate, there is hope for a rebound above the psychologically important $64.00 level and the 100-day simple moving average at $64.41. A breakout could challenge $65.61 (the 50.0% Fibonacci retracement level from $70.02 to $61.20). A breakout could lead to $66.58 (the 200-day simple moving average).
Consider going long on crude oil at $63.35 today. Stop-loss: $63.20, target: $64.80, $65.30.
Spot Gold
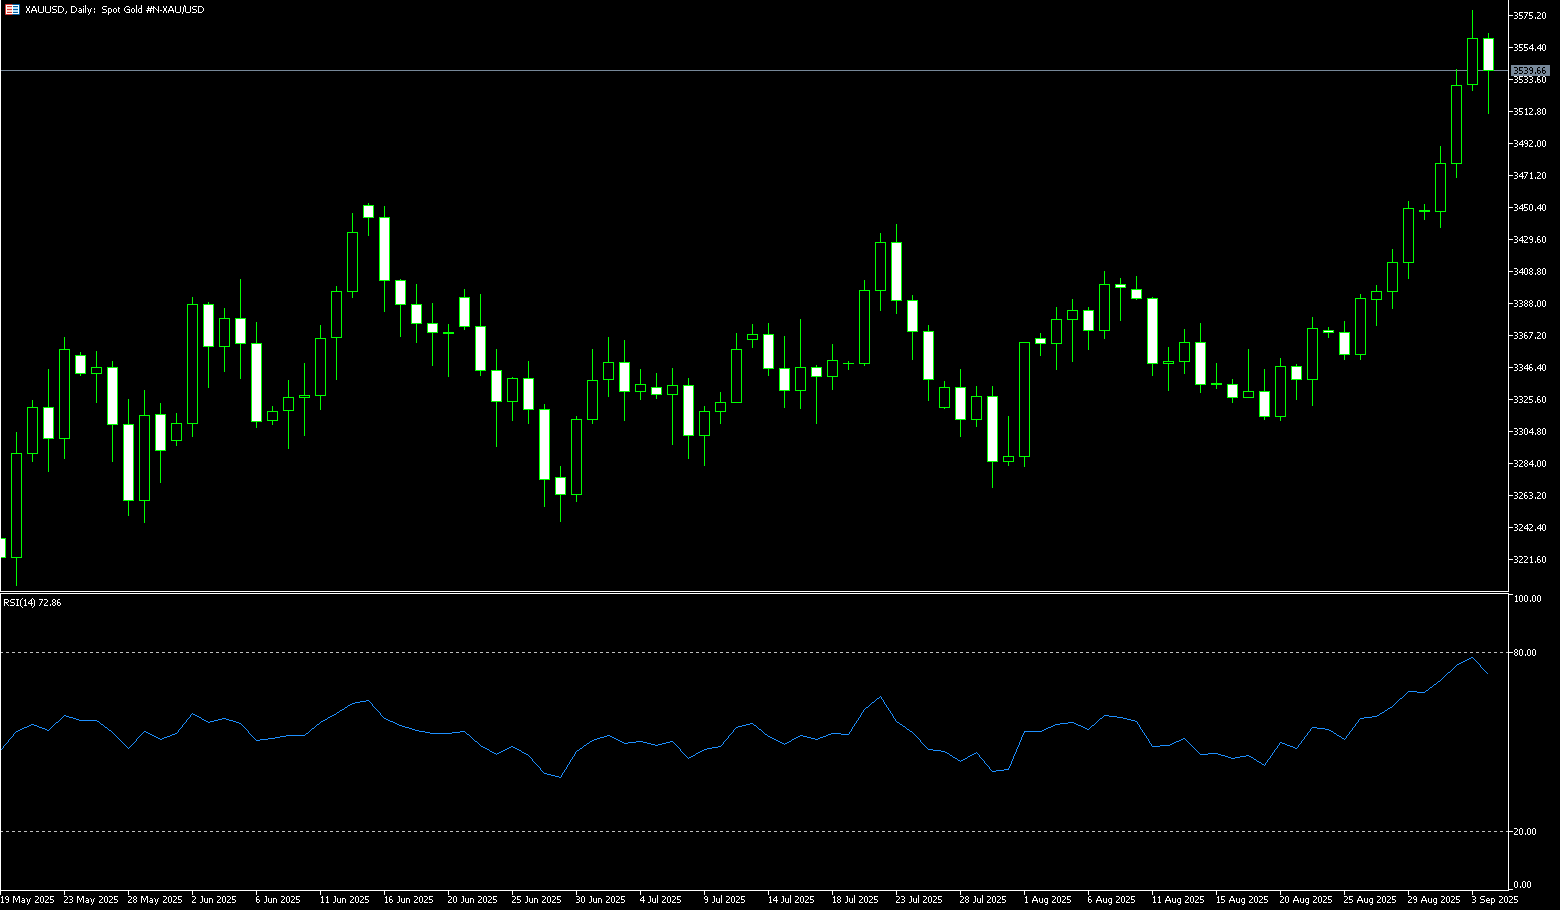
Spot gold prices performed strongly during Tuesday's Asian and European trading sessions. They fluctuated upward within a $20 range in the morning and have now rapidly risen to a new all-time high of $3,791/oz. Monday's nearly 2% rise to a new all-time high was primarily driven by rising expectations of further US interest rate cuts and continued safe-haven demand amidst political uncertainty. In addition to these key factors, a number of other key drivers are driving gold prices. Investors' strong expectations of further Federal Reserve rate cuts, coupled with continued safe-haven demand driven by geopolitical uncertainty, have attracted a significant influx of funds into the gold market, driving its price soaring. The most direct driver of this round of gold price increases is undoubtedly the market's strong expectations of further interest rate cuts by the Federal Reserve. Geopolitical tensions, such as the Russia-Ukraine conflict and the Gaza Strip in the Middle East, remain volatile, prompting investors to invest in gold, a traditional "safe haven."
On a daily chart, the continued widening of the Bollinger Band width confirms a release of volatility. The price is currently stabilizing above the $3,698 (5-day simple moving average) and the $3,700 (market psychological level), just a stone's throw away from the upper Bollinger Band band of $3,800.30. Short-term resistance initially lies at the upper Bollinger Band band of $3,800.30 and the dynamic resistance of the $3,800.00 round-figure mark. A break below this level could target the $3,850 level. On the support front, the first target is $3,750, followed by $3,698 (5-day simple moving average). The $3,700 psychological level has already transitioned from resistance to support, making it a prime target for a first-order retracement. In the event of a sudden move, the $3,654.50 14-day simple moving average corresponds to the trend level and acts as a more defensive line.
Today, consider going long on gold at $3,755, with a stop-loss at $3,750 and targets at $3,780 and $3,785.
AUD/USD
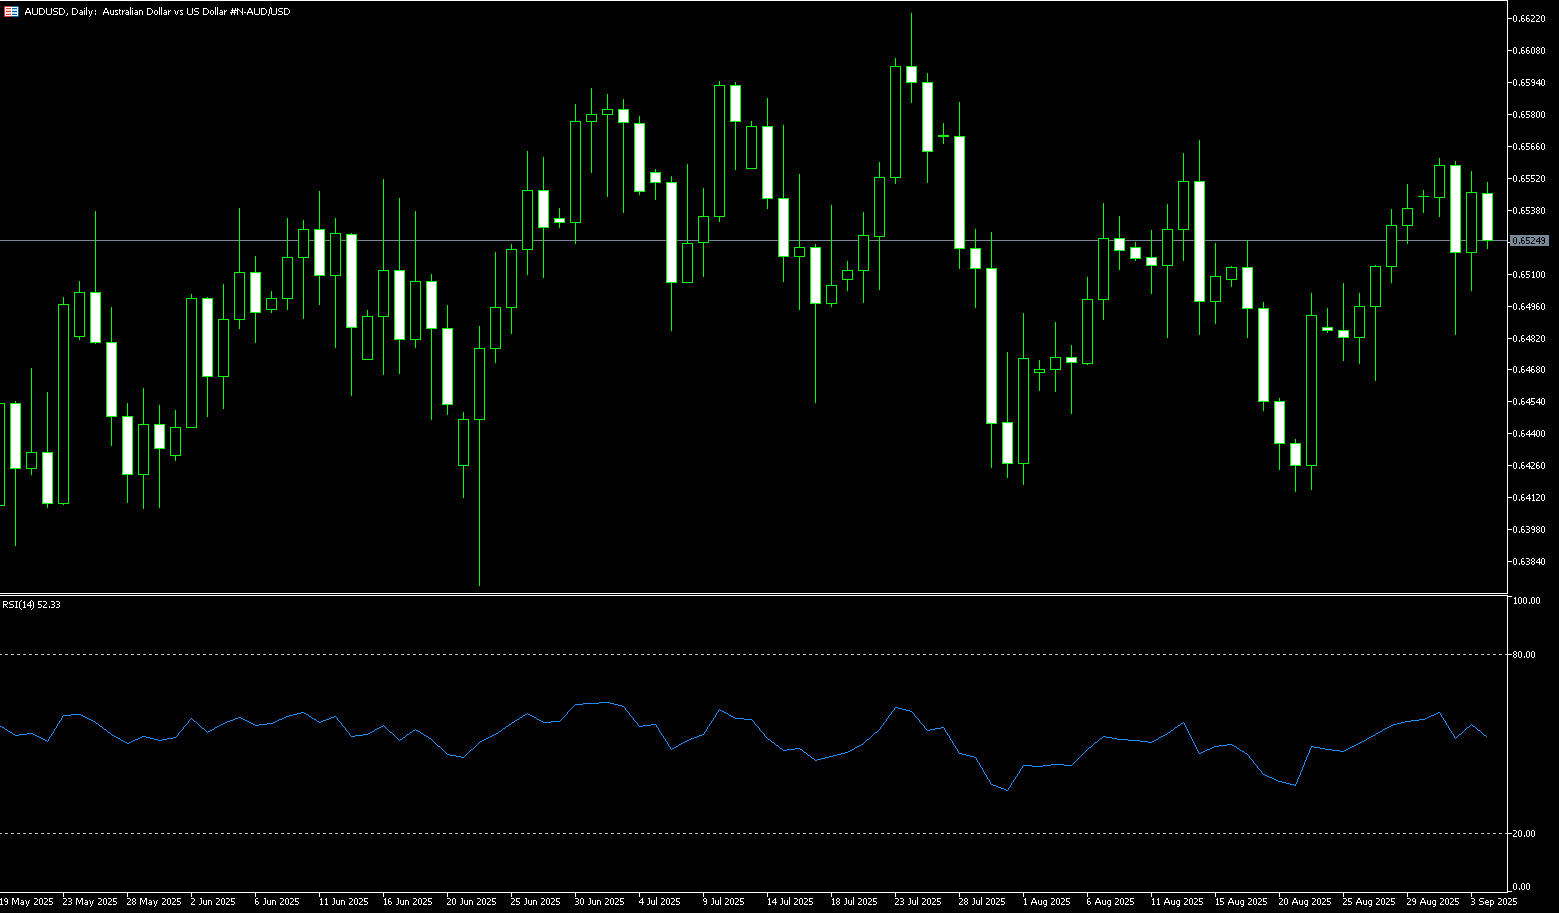
The Australian dollar strengthened slightly against the US dollar on Tuesday following the release of preliminary Australian S&P Global Purchasing Managers' Index (PMI). However, downside for AUD/USD may be limited due to expectations of further interest rate cuts in the US dollar. The Australian S&P Global Composite PMI fell to 52.1 in September, down from 55.5 in the previous month, marking its lowest level in three months. The preliminary S&P Global Services PMI showed a slight slowdown to 52 in September, down from 55.8 in August. Meanwhile, the Manufacturing PMI fell to 51.6 from 53.0. Reserve Bank of Australia Governor Michelle Bullock told Parliament on Monday that labor market conditions had eased slightly, with the unemployment rate rising. However, markets remained tight, near full employment. Bullock noted that recent interest rate cuts should support household and business spending, while emphasizing that the RBA must remain vigilant to changing conditions and be prepared to respond if necessary.
AUD/USD briefly traded above 0.6600 on Tuesday. Technical analysis on the daily chart shows the pair trading slightly below an ascending channel pattern, suggesting a growing bearish bias. However, the 14-day Relative Strength Index (RSI) remains slightly above 50, suggesting continued bullish sentiment. AUD/USD may find initial support at the key level of 0.6550, which aligns with the 34-day simple moving average of 0.6549. A break below this support zone would weaken medium-term price momentum and exert downward pressure on the pair, pushing it towards the 0.6500 level. On the upside, the 34-day simple moving average at 0.6634 will act as key resistance, followed by the round-number mark at 0.6700 and last week's high at 0.6706.
Consider a long position on the Australian dollar at 0.6588 today, with a stop-loss at 0.6575 and targets at 0.6640 and 0.6650.
GBP/USD
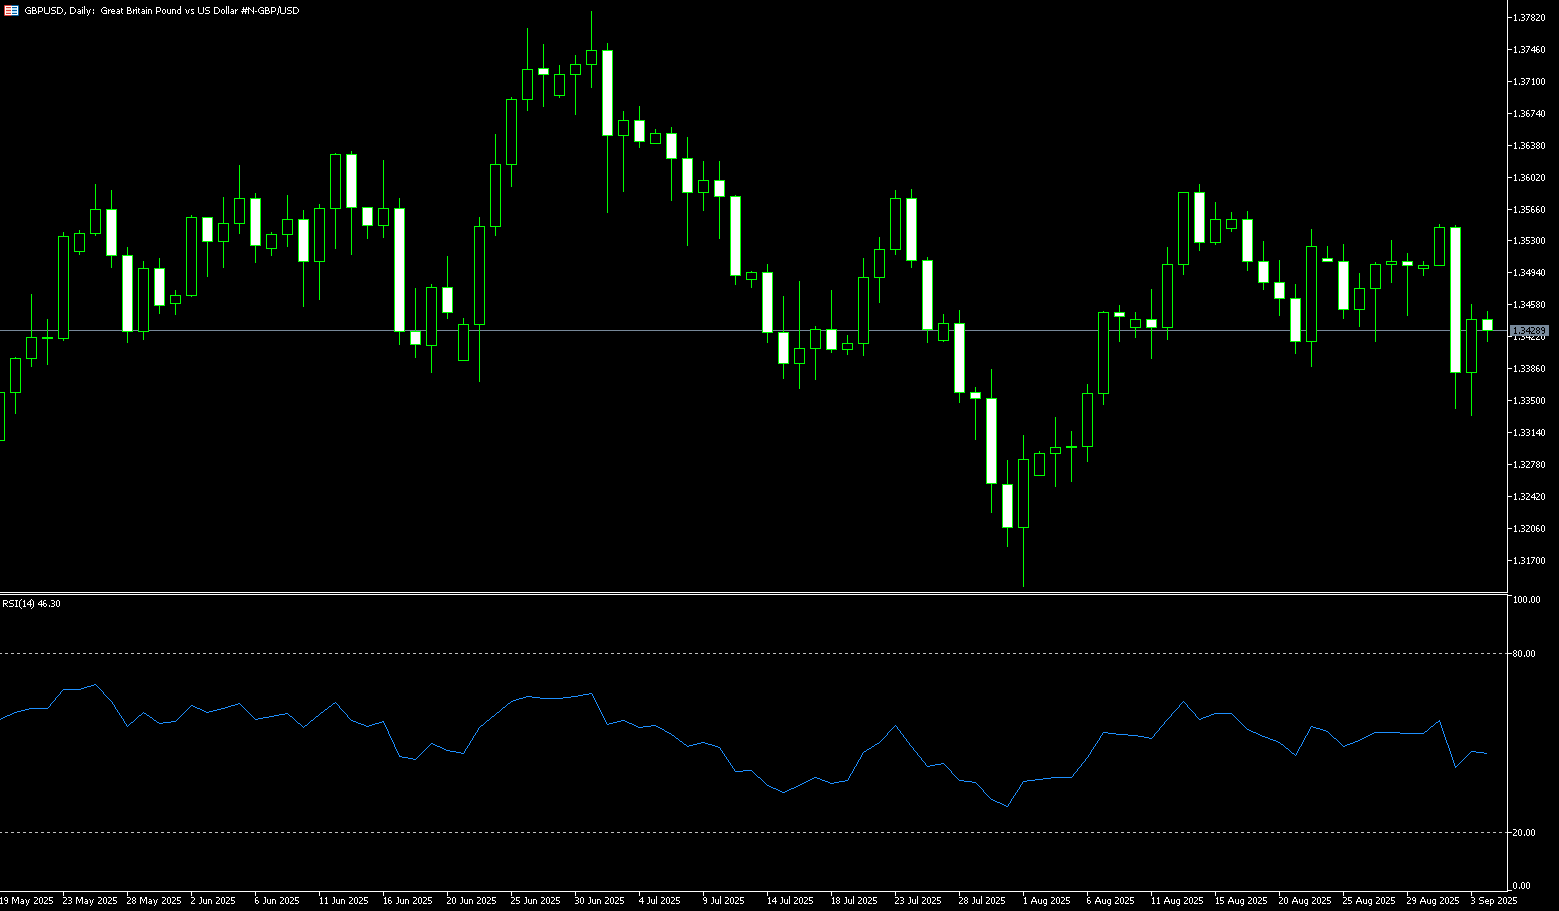
The British pound faced strong selling pressure against other currencies following the release of weak preliminary S&P Global Purchasing Managers' Index (PMI) data on Tuesday. The S&P Global Composite PMI came in at 51.0, below expectations of 52.7 and down from 53.5 in August, indicating an expansion in overall business activity, albeit at a modest pace. The slowdown in overall business activity was attributed to continued weakness in the manufacturing sector. The manufacturing PMI contracted to 46.2, compared to expectations of a reading of 47.0. A reading below 50.0 is considered a contraction in business activity. Meanwhile, the services PMI fell to 51.9, down from an expected reading of 53.5 and a previous reading of 54.2. The UK flash PMI report for September brought concerning news, including as investors sought fresh clues about whether the Bank of England would cut interest rates again at its remaining policy meetings this year. Last week, the BoE kept interest rates unchanged at 4%, as expected, maintaining a "gradual and cautious" approach to monetary easing.
GBP/USD's latest bullish reversal raises hopes for a continued technical rebound around the 1.3500 round-figure mark and the 1.5008 (9-day simple moving average). However, the psychological 1.3600 level remains a significant technical barrier to the pair's near-term performance. Currently, despite its upward trend, GBP/USD faces resistance at the 14-day simple moving average of 1.3542. Failure to close above 1.3500 could extend the short-term downtrend, testing the 50-day simple moving average at 1.3469. Bears will then focus on the 1.3400 round-figure mark as the next area of interest. Otherwise, if GBP/USD closes above 1.3500 in early-week trading, it is expected to challenge Friday's high of 1.3559. A breakout would pave the way for further gains towards the psychologically important 1.3600 level.
Consider a long position on GBP at 1.3513 today. Stop-loss: 1.3500. Target: 1.3560, 1.3570.
USD/JPY
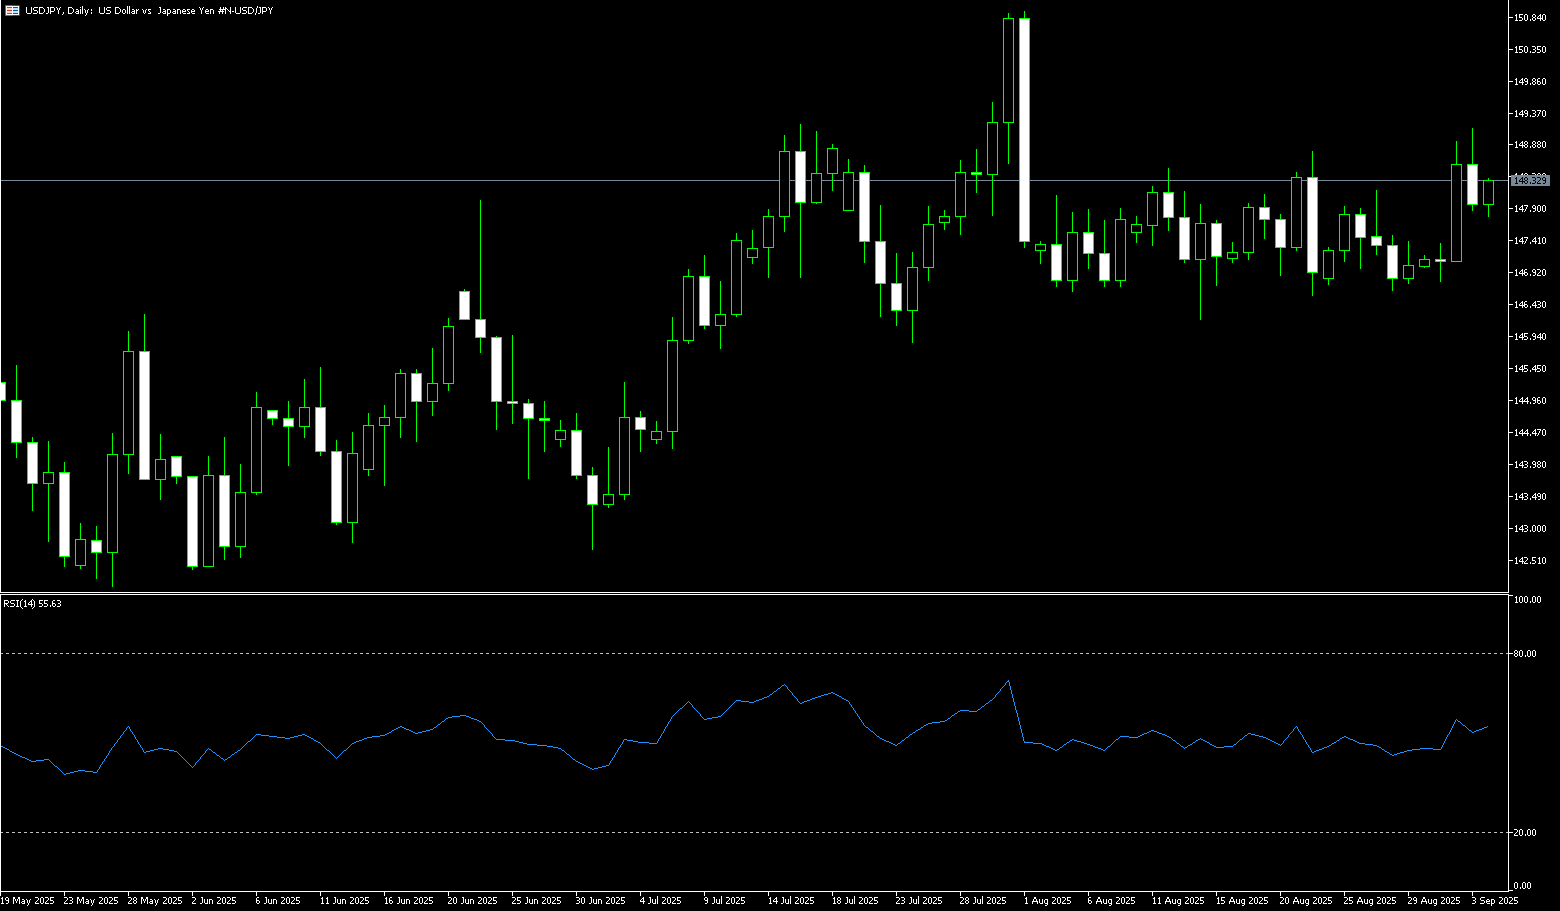
USD/JPY lost ground near 147.65 in early Tuesday trading. The US dollar weakened against the yen as investors digested comments from Federal Reserve officials regarding their latest monetary policy stance. Last week, the Bank of Japan maintained its interest rate at 0.5% in a sharply divided vote, but simultaneously announced the launch of a sell-off in exchange-traded funds and real estate investment trusts, signaling a hawkish stance on monetary policy normalization. This asset sales, tightening liquidity, had previously contributed to a brief strengthening of the yen. However, at the beginning of the week, USD/JPY rebounded further from Friday's level to 148.37. The core reason lies in the conflict between hawkish expectations and lagging policy implementation. While the market expects the Bank of Japan to raise interest rates before the end of the year, the current decision to keep rates unchanged has left the yen lacking sustained upward momentum. As a component of the US Dollar Index, the yen's retreat from gains directly supports the index.
From a technical perspective, a move above the 148.00 round-figure mark would favor bulls. Furthermore, oscillators on the daily chart have just begun to gain positive momentum, supporting the possibility of further appreciation. This means that any subsequent gains are likely to encounter strong resistance near the 200-day simple moving average, currently at 148.58. A sustained strong breakout would reaffirm the positive bias and allow spot prices to climb further towards the 149.00 round-figure mark, testing the monthly swing high around 149.20. On the other hand, the 147.00 area could offer immediate support, below which the pair could accelerate its decline towards 147.00. A break below this level would expose support at 146.77 (the September 18 low), which would then allow spot prices to continue their downward trend towards 146.00.
Consider shorting the US dollar at 147.85 today. Stop-loss: 148.10, targets: 147.00, 146.80.
EUR/USD
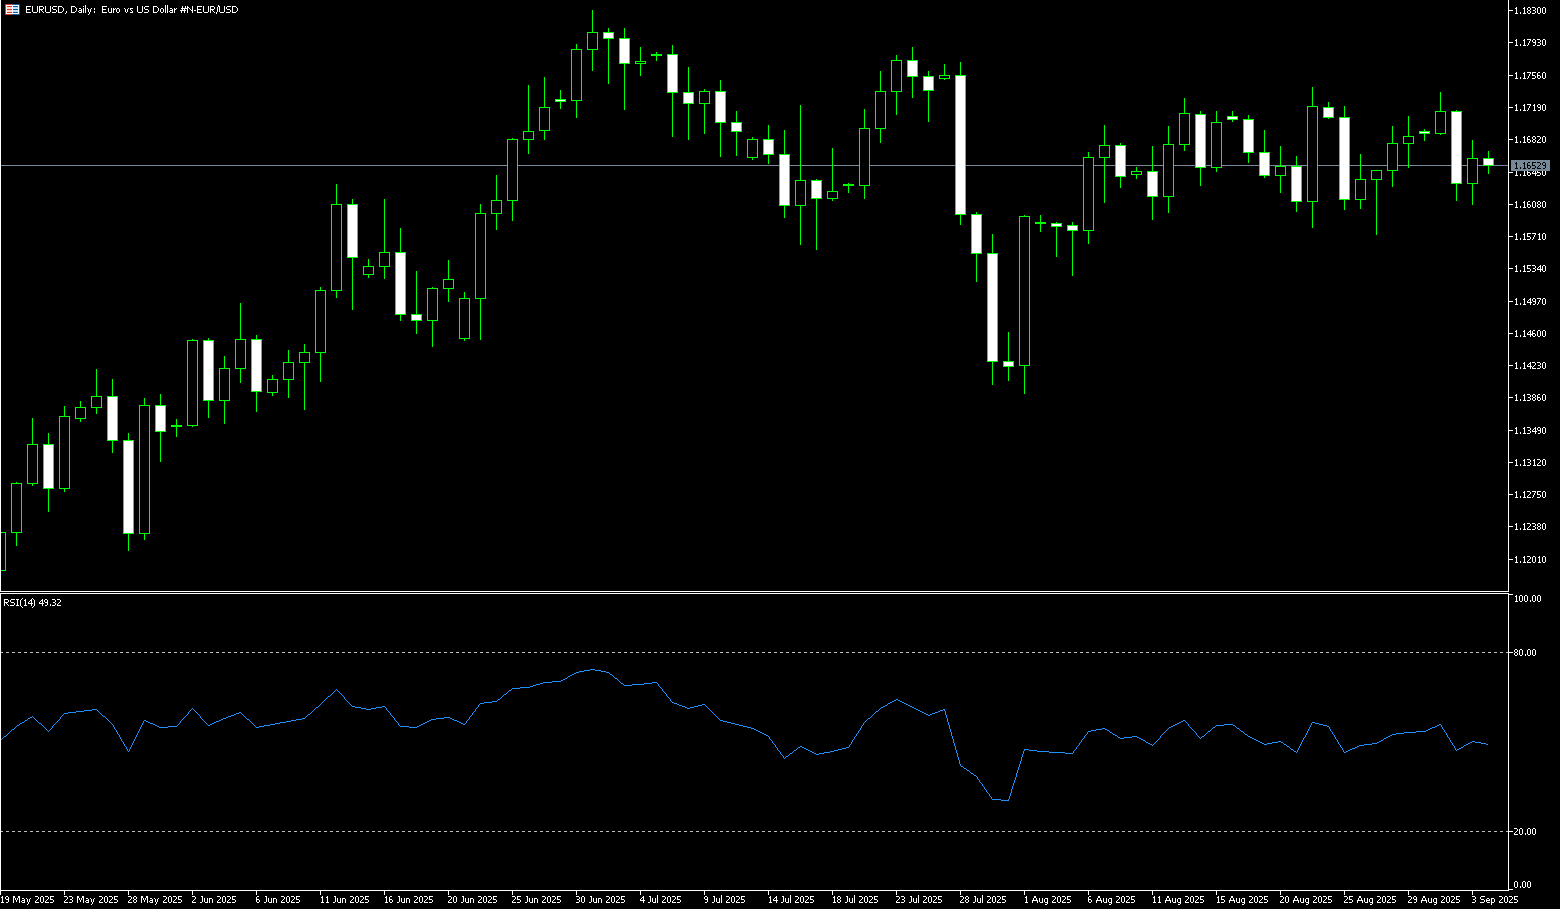
EUR/USD rose slightly, returning to near 1.1800 after rebounding from the 1.1785 low. Mixed Eurozone business activity data provided some support for the euro, but the market remained cautious about risks. Preliminary PMI data from the Eurozone showed an unexpected contraction in manufacturing activity in September, while growth in the services sector accelerated more than expected. German data showed a similar pattern, with a decline in manufacturing offset by strength in the services sector. In France, both manufacturing and services contracted, raising concerns about the region's second-largest economy. Focus now shifts to key data points ahead of Friday's release of the Personal Consumption Expenditures (PCE) price index. Markets are eager to test the resilience of the US economy under higher trade tariffs, particularly ahead of a speech by Federal Reserve Chairman Powell, which could further inform the bank's forward guidance.
EUR/USD maintains an upside bias after forming a bearish "piercing head" pattern at the start of the week, suggesting buyers are poised to push the exchange rate higher. As momentum builds, the 14-day Relative Strength Index (RSI) on the daily chart is rising in bullish territory. A break above 60.00 (currently at 57.20) would signal a strengthening trend. If EUR/USD decisively breaks through 1.1800, the first resistance level will be 1.1850, followed by the year-to-date high of 1.1919. A break above the latter would expose the psychologically important 1.2000 market barrier. Conversely, a break below 1.1750 would open the door to further declines. The first support level would be 1.1700, followed by the 50-day simple moving average at 1.1675.
Consider a long EUR at 1.1802 today, with a stop loss at 1.1790 and a target at 1.1860 or 1.1850.
Disclaimer: The information contained herein (1) is proprietary to BCR and/or its content providers; (2) may not be copied or distributed; (3) is not warranted to be accurate, complete or timely; and, (4) does not constitute advice or a recommendation by BCR or its content providers in respect of the investment in financial instruments. Neither BCR or its content providers are responsible for any damages or losses arising from any use of this information. Past performance is no guarantee of future results.
More Coverage


Risk Disclosure:Derivatives are traded over-the-counter on margin, which means they carry a high level of risk and there is a possibility you could lose all of your investment. These products are not suitable for all investors. Please ensure you fully understand the risks and carefully consider your financial situation and trading experience before trading. Seek independent financial advice if necessary before opening an account with BCR.

 English
 简体中文
简体中文
 繁體中文
繁體中文
 Bahasa
Melayu
Bahasa
Melayu
 Tiếng
Việt
Tiếng
Việt
 ไทย
ไทย
 日本語
日本語
 한국어
한국어
 ភាសាខ្មែរ
 español