


0
US Dollar Index
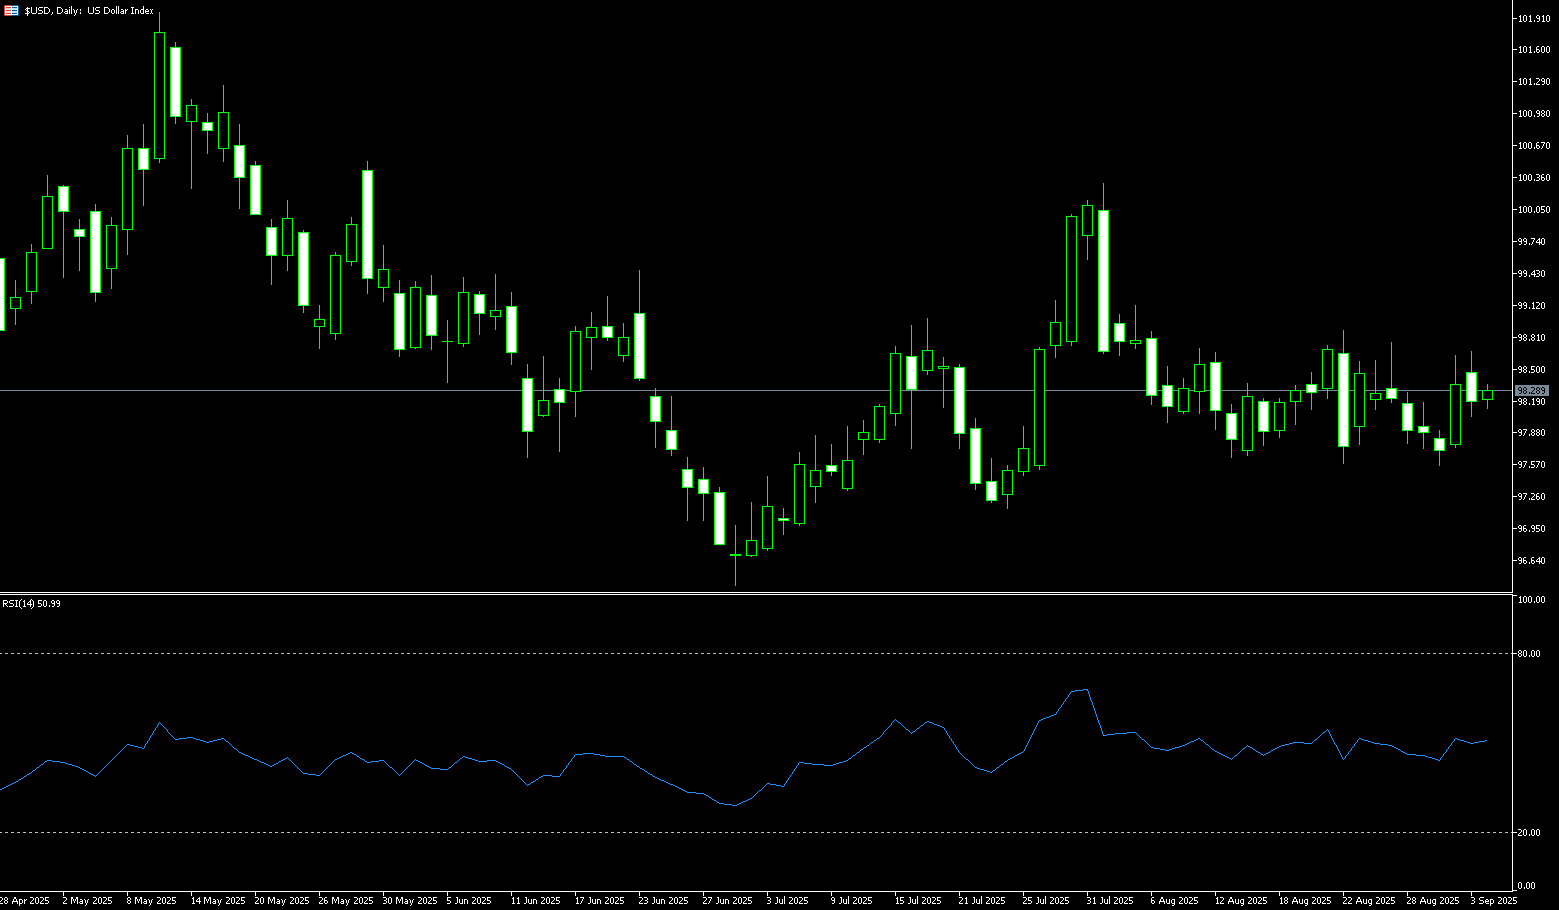
Federal Reserve Chairman Powell dampened market expectations for a significant rate cut, pushing the US dollar index near the three-week high of 98.60 midweek. Powell warned against premature policy easing, citing persistent inflation risks and a weak labor market. He reiterated his cautious stance on further rate cuts, stating that despite a weak labor market, policymakers remain concerned about inflation. Following this statement, the US dollar resumed its upward trend. While the market is still pricing in two more 25 basis point rate cuts before the end of the year, Powell's comments significantly dampened dovish expectations. Meanwhile, upcoming US economic data, particularly Friday's PCE price index data, is expected to be a key factor in determining the direction of the US dollar index.
Looking at the daily chart, the US dollar index rose sharply midweek, up 0.61% to 98.60, breaking through key resistance at the 50-day simple moving average (SMA) at 98.04 and 98.24 (the 50% Fibonacci retracement level from 100.26 to 96.22). These two technical levels will provide key short-term support. A breakout would target the "double top" formations of 98.73 (August 23) and 98.68 (September 3), followed by the 99.00 round-figure mark. Currently, the US dollar index faces key support between the 50-day SMA (SMA) at 98.04 and the 23.6% Fibonacci retracement level at 98.17. A breakout of this range could lead to a test of the 98.00 round-figure support level.
Consider shorting the US Dollar Index at 98.60 today. Stop-loss: 98.72. Target: 98.100, 98.00.
WTI Spot Crude Oil
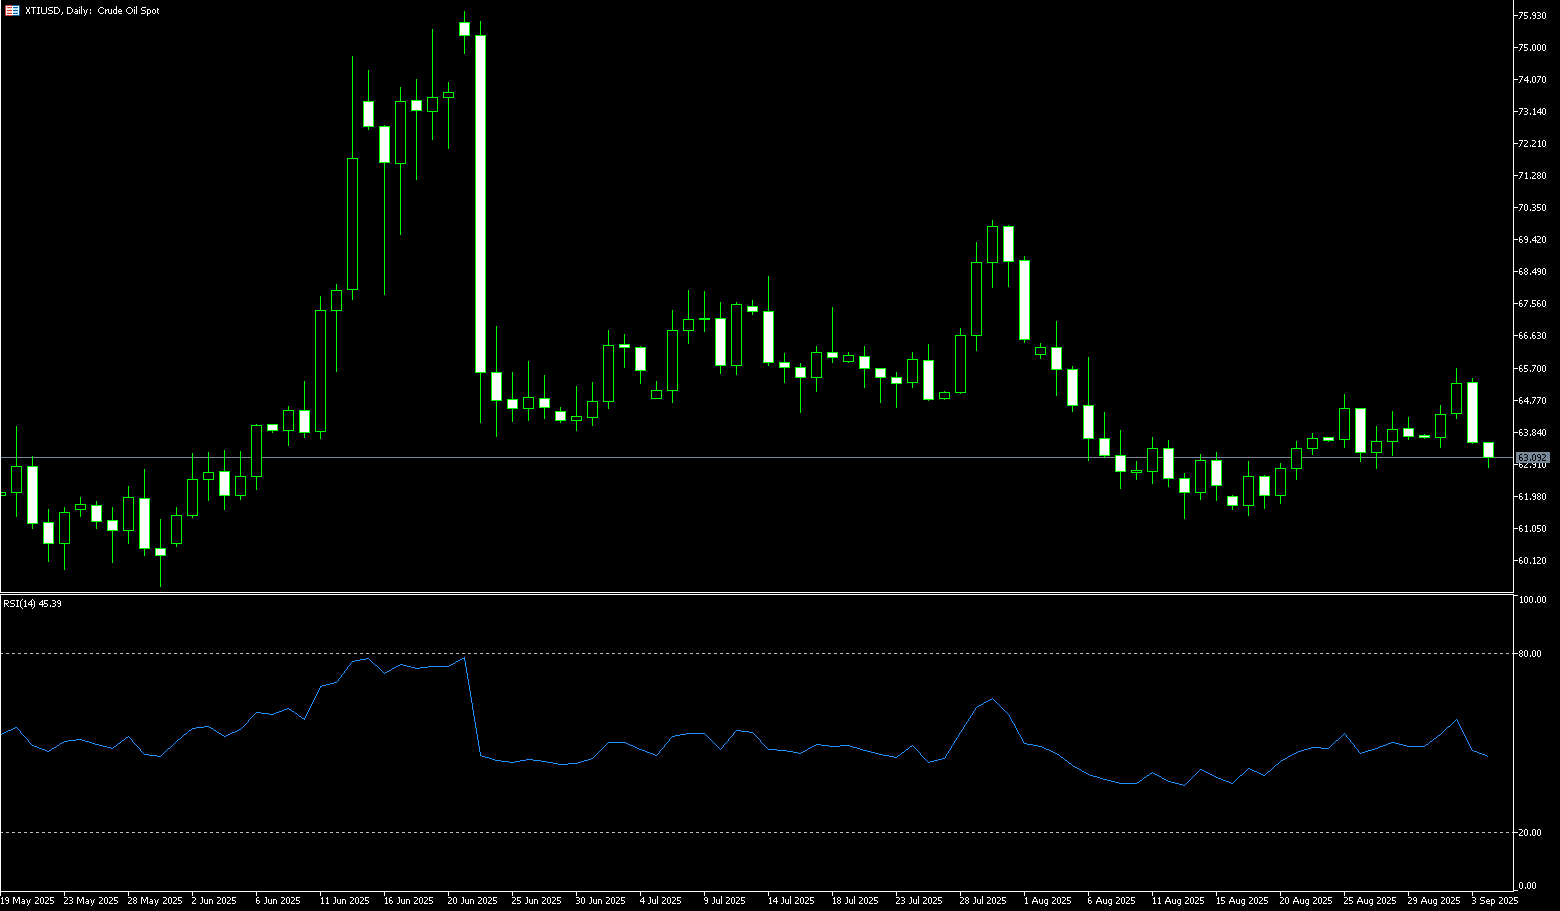
WTI crude oil traded around $65.00 per barrel on Thursday, rising nearly 0.60% to a seven-week high. A surprising drop in US crude oil inventories last week, coupled with export bottlenecks from Iraq, Venezuela, and Russia, has heightened market concerns about tightening supply. The US Energy Information Administration reported on Wednesday that US crude oil, gasoline, and distillate inventories all fell last week. The market generally believes that the main reason for the short-term rise is supply constraints. First, pipeline exports from Iraq's Kurdish region to Turkey have not yet resumed, and approximately 230,000 barrels per day of crude oil remain deadlocked. The Iraqi central government, the Kurdish regional government, and related oil companies have failed to reach an agreement on debt repayment guarantees. Given these multiple supply constraints, oil prices remain supported in the short term, but any official EIA data confirming an inventory increase could cap gains. Overall, the current rise in oil prices is driven not by improved demand but rather by supply disruptions. Oil prices remain supported in the short term, but volatility will increase.
Technically, WTI prices are fluctuating around $64, above the $64.00 level (round-number mark) and the 9-day moving average (63.50), indicating some upward momentum. Key support currently lies at the 9-day moving average (63.50). A break below this could trigger a further correction to $62.64 (the September 16 low) and the $62.00 level. Above this, $65.61 (the 50.0% Fibonacci retracement level from $70.02 to $61.20) presents significant resistance. A break above this level could propel oil prices to $66.53 (the 200-day moving average).
Consider going long on crude oil at 64.80 today. Stop-loss: 64.60, target: 66.00, 66.50.
Spot Gold
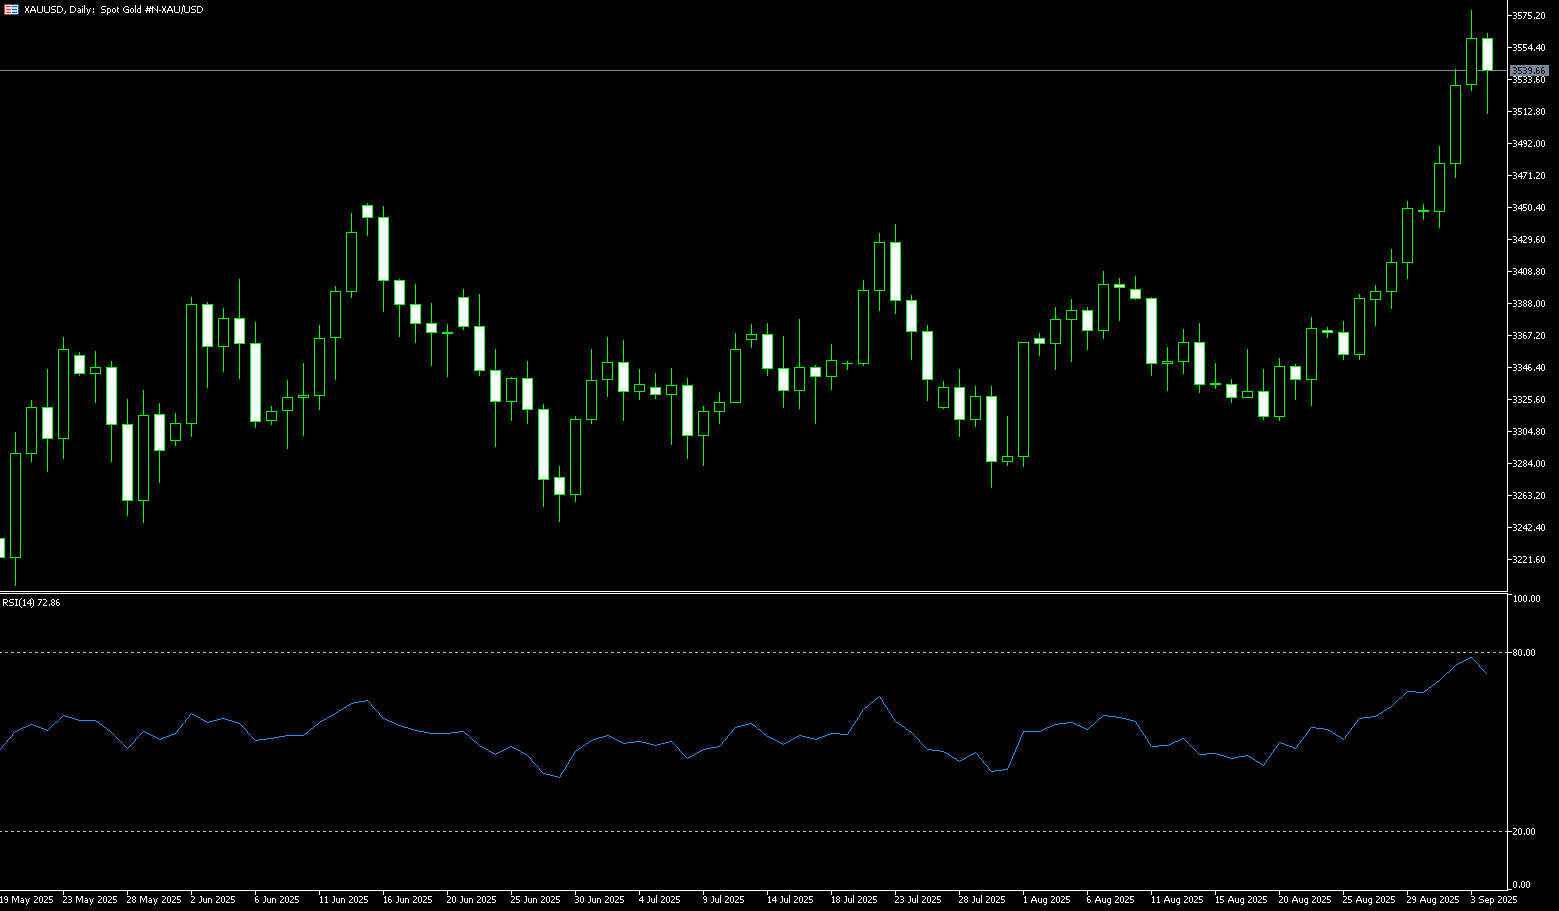
Gold's record-breaking rally paused after hitting a new all-time high of $3,791. The Federal Reserve's cautious stance and a stronger dollar are limiting gold's upside, while geopolitical tensions and expectations of rate cuts are providing downward support. Market focus has shifted to upcoming US economic data and speeches by Fed officials, with Friday's Personal Consumption Expenditures (PCE) inflation data set to be a key focus. Despite the Fed's 25 basis point rate cut last week, market expectations for further rate cuts before year-end remain firm. However, a rebounding dollar and rising US Treasury yields are limiting gold's upward momentum. However, ongoing geopolitical tensions, along with the overall fundamental and technical outlook, continue to mitigate downside risks for gold prices—even as momentum stalls near record highs, bargain hunters remain active.
After hitting a new all-time high of $3,791, spot gold has entered a period of consolidation. Bulls have so far successfully defended Thursday's low of $3,715.50 and the 5-day moving average of $3,732.50. While the overall bullish outlook remains intact, momentum indicators are showing initial signs of weakness, suggesting the market is digesting recent gains after a period of excessive gains. Key support lies between $3,717.50 and $3,732.50, followed by the psychological barrier of $3,700. A break below $3,700 could shift the market landscape and trigger a deeper correction to $3,650. However, gold prices remain firmly above both short-term and medium-term moving averages, underscoring the strength of the current uptrend. On the upside, key resistance lies at the all-time high of $3,791 and the psychological barrier of $3,800. A sustained breakout of this range would further confirm the upward trend.
Consider a long position in gold at 3,745 today, with a stop-loss at 3,740 and targets at 3,770 and 3,775.
AUD/USD
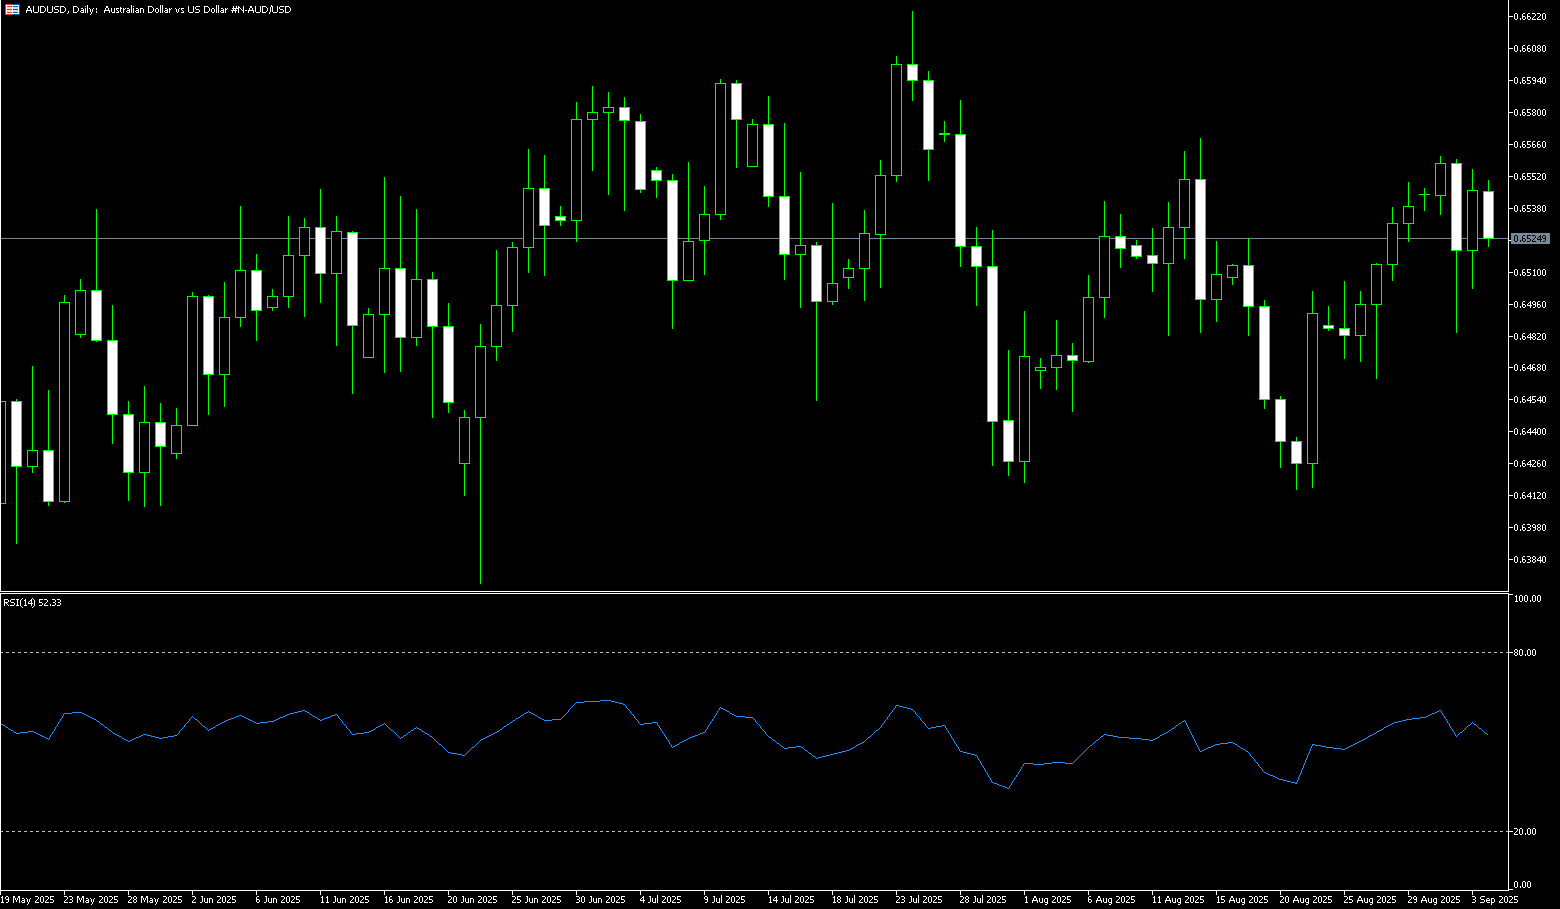
The Australian dollar fell sharply against the US dollar on Thursday, extending losses for the second consecutive trading day to its lowest level in nearly three weeks at 0.6526. This decline occurred following a broad rally in the US dollar following a series of stronger-than-expected US economic data, which boosted confidence in the resilience of the world's largest economy and dampened risk sentiment. AUD/USD traded near 0.6530, down 0.60% on the day. The US Bureau of Economic Analysis revised up second-quarter gross domestic product (GDP) to an annualized rate of 3.8%, exceeding expectations and exceeding 3.3%. The report also showed that the core personal consumption expenditures (PCE) price index rose from 2.5% to 2.6%, highlighting persistent inflationary pressures. Meanwhile, durable goods orders rebounded 2.9% in August, while weekly initial jobless claims fell to 218,000, below expectations for 235,000. Attention now turns to Friday's core PCE inflation report.
AUD/USD traded around 0.6540 on Thursday, its lowest level in nearly three weeks. Technical analysis on the daily chart shows the pair trading below 0.6600, suggesting weak short-term price momentum. However, the 14-day relative strength index (RSI) remains slightly above 50, suggesting a persistent bullish bias. The pair may find initial support at the 50-day simple moving average at 0.6538, which aligns with the psychological level of 0.6500. A break below this support zone would weaken medium-term price momentum to 0.6483 (the low of September 3). On the upside, initial resistance lies at the psychological level of 0.6600. A break above this level would improve short-term price momentum and bring the pair closer to the 0.6615 (9-day simple moving average).
Consider a long position on the Australian dollar at 0.6530 today, with a stop-loss at 0.6520 and targets at 0.6590 and 0.6600.
GBP/USD
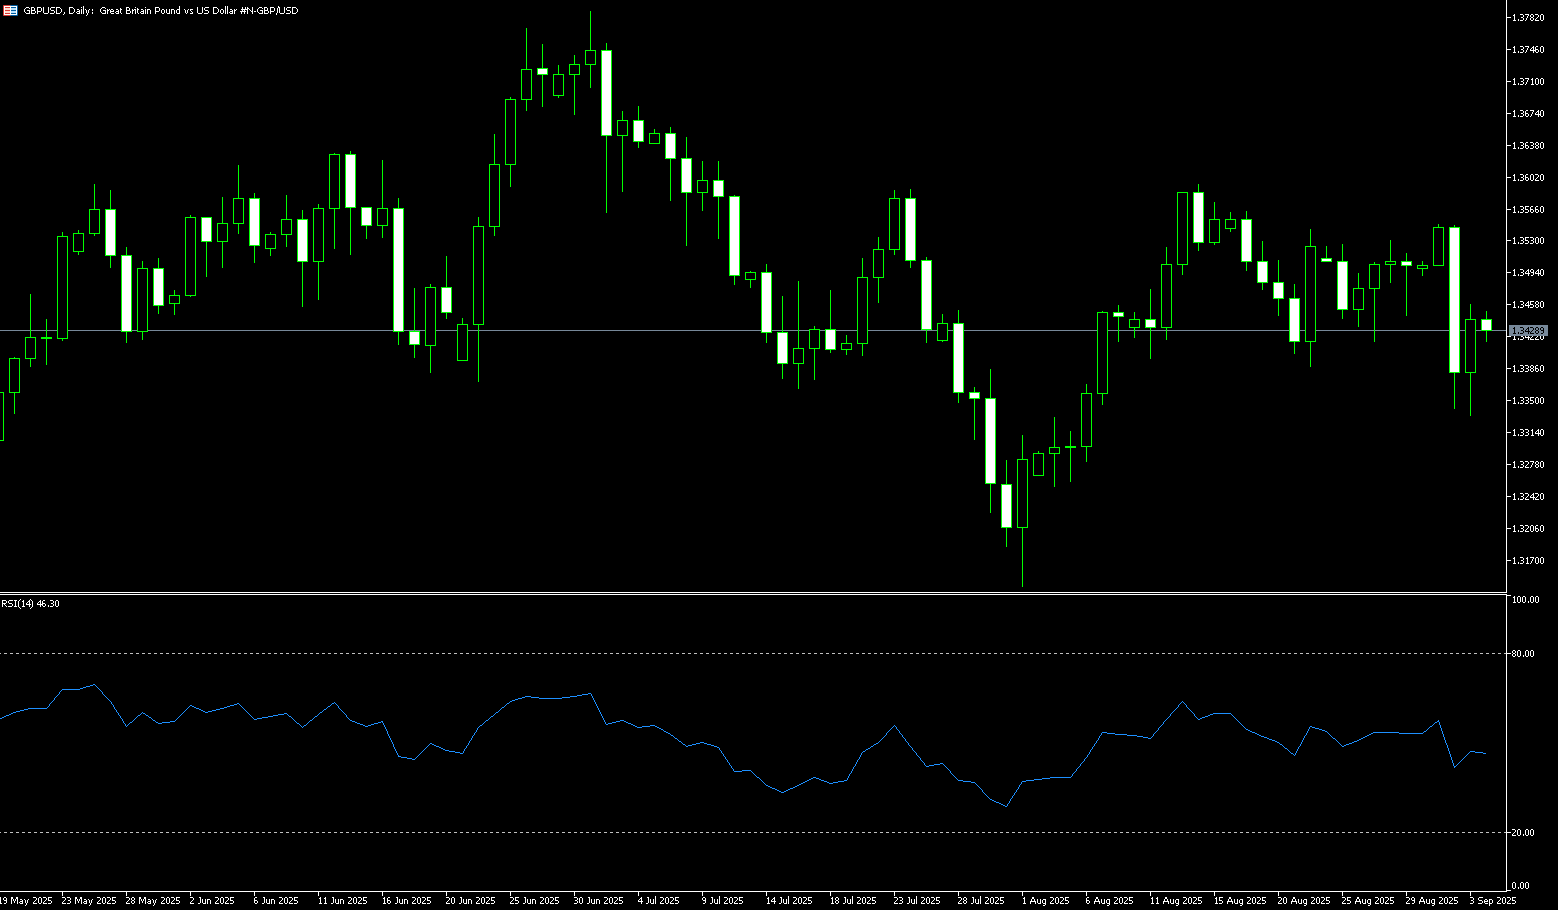
The British pound weakened against the US dollar on Thursday, with GBP/USD falling below the psychological 1.3400 level as a wave of stronger-than-expected US economic data revived demand for the greenback. GBP/USD traded as low as 1.3324, dropping to levels last seen three weeks ago and down nearly 0.76% on the day. Meanwhile, the US dollar index continued its rebound, surging to 98.60, its highest level since September 5. US data further reinforced the view that the economy remains robust. Initial jobless claims fell to 218,000, below the expected 235,000 and down from 232,000 the previous week. Meanwhile, second-quarter GDP growth was revised upward to 3.8% from 3.3%, easily beating expectations. Durable goods orders jumped 2.9% in August after a sharp decline in July, with orders excluding defense orders rising 1.9%. Traders remained cautious ahead of Friday's release of August's core PCE inflation data, which will have greater implications for the Federal Reserve's monetary policy outlook.
On the daily chart, GBP/USD continued its decline after reaching its highest level since early July at 1.3788 on September 17, as bears further tightened their grip. Momentum indicators confirm the downside bias. The 14-day relative strength index (RSI) hovers at 38 and is moving downward, indicating that sellers remain in control of the market. Meanwhile, the moving average convergence/divergence (MACD) has confirmed a bearish crossover, signaling growing bearish momentum and the potential for deeper losses. From a technical perspective, the pair has fallen below its 20-day and 34-day simple moving averages, at 1.3514 and 1.3506, respectively. Near-term support lies at 1.3300; a break below this level would expose the August low of 1.3250. On the upside, bulls need to recover above the 1.3400 round-figure mark to ease selling pressure. Next resistance lies near 1.3467 (Thursday's high).
Consider going long on the British pound at 1.3330 today, with a stop-loss at 1.3320 and a target of 1.3390 or 1.3400.
USD/JPY
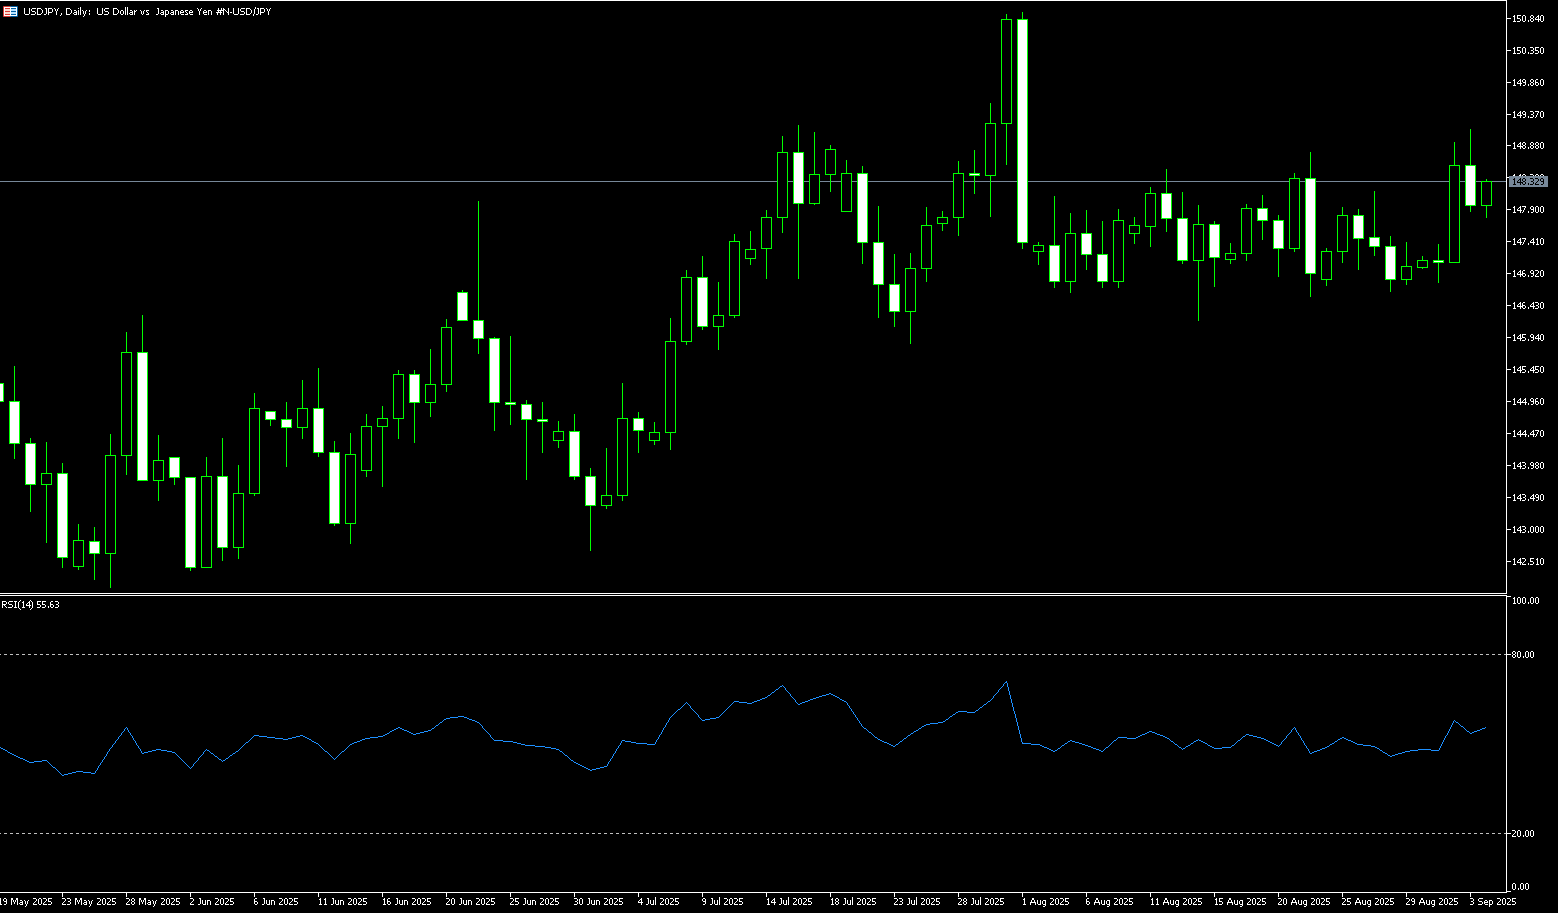
The yen weakened against the dollar on Thursday, sending USD/JPY soaring to a seven-week high. The pair traded around 149.90, up nearly 0.60% on the day, extending its gains for a second consecutive day after a series of stronger-than-expected US economic data bolstered the dollar. According to the Bureau of Economic Analysis, US gross domestic product (GDP) grew at an annualized rate of 3.8% in the second quarter, beating both the initial estimate of 3.3% and market expectations of 3.3%, driven by strong consumer spending and a sharp decline in imports. The core personal consumption expenditures (PCE) price index, embedded in the GDP report, rose 2.6% in the second quarter, slightly above the previous estimate and market forecast of 2.5%. Looking ahead, market focus shifts to Friday's release of the US core PCE price index, which will provide fresh clues on the policy outlook. In Japan, the Tokyo Consumer Price Index (CPI) for September will also be released on Friday, and the market will closely monitor its signals on underlying inflation trends and the Bank of Japan's next policy steps.
Due to renewed risk aversion in financial markets and the Federal Reserve's cautious stance in the previous trading day, the USD/JPY exchange rate surged to a seven-week high of 149.93. After this rapid rise, the exchange rate is currently entering a technical consolidation phase. Technically, USD/JPY is in a period of consolidation following a strong rally, and the pair is expected to continue its upward trend after this period of technical consolidation. Meanwhile, the 14-day relative strength index (RSI) on the daily chart is above its midline, suggesting a continued bullish bias for the currency pair. The MACD momentum indicator is nearing its zero line, suggesting the currency pair may maintain technical consolidation in the short term. Over the past two months, USD/JPY has generally fluctuated between 145.50 and 150.90. A break above 150 (round number) and 149.93 (September 25 high) would strengthen the pair's upward trend, further solidifying its bullish bias towards 150.93 (August 3 high). Downside targets include 149.00 and 148.56 (yesterday's low).
Consider shorting the US dollar at 149.98 today. Stop-loss: 150.20, target: 149.20, 149.00.
EUR/USD
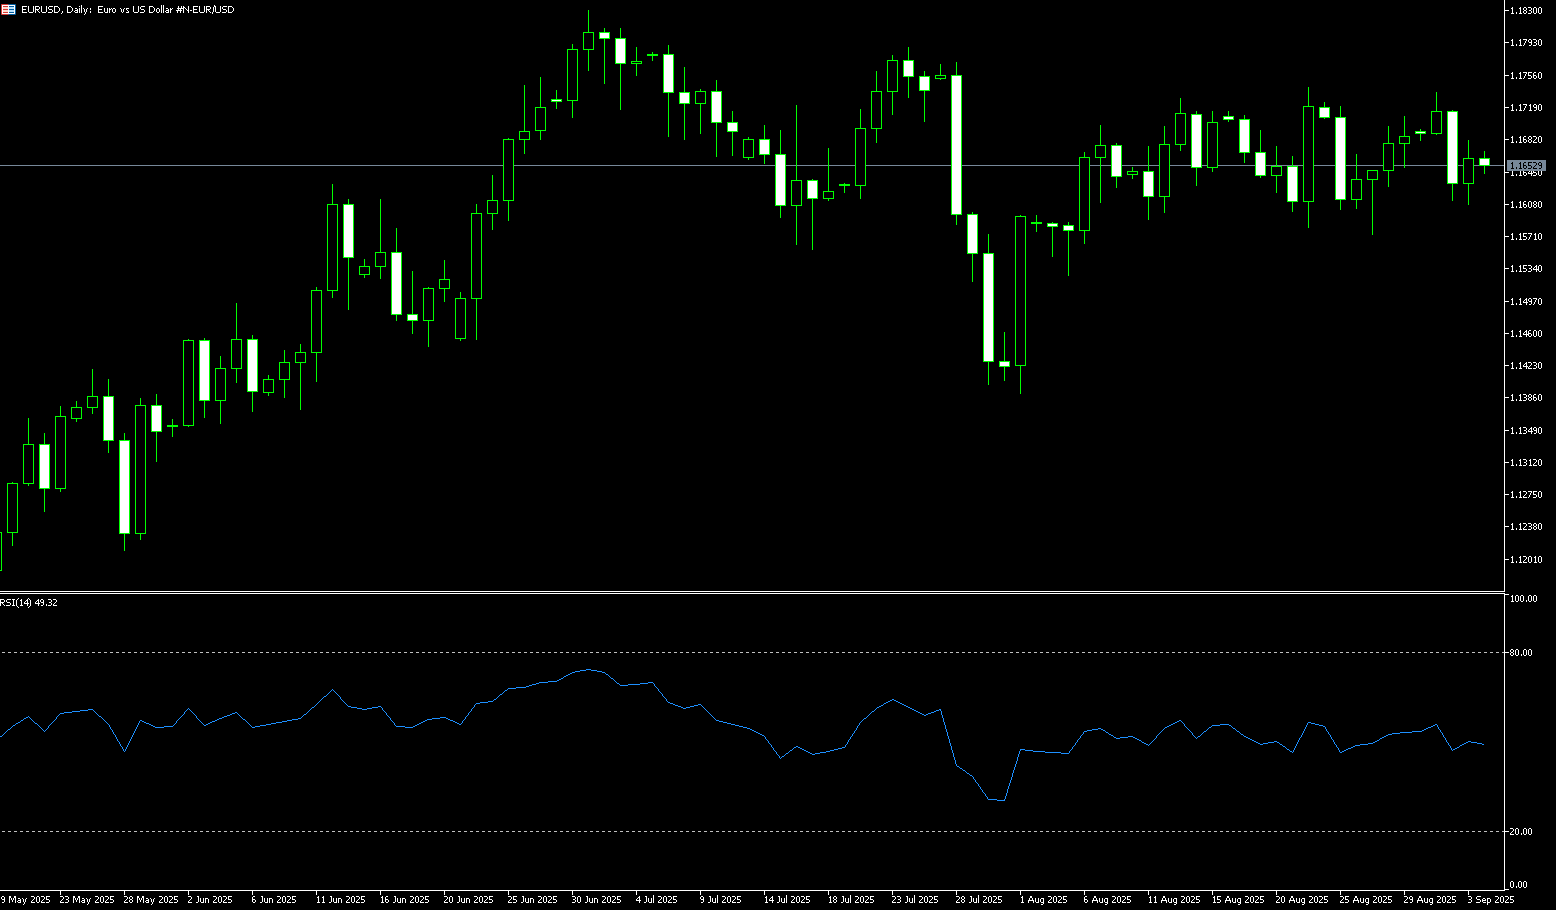
The euro fell against the US dollar for a second consecutive day on Thursday, dragged down by a series of upbeat US economic data that boosted the overall performance of the US dollar. EUR/USD hovered around 1.1655, down nearly 0.60% on the day and hitting its lowest level since September 11th, as traders reacted to stronger-than-expected US economic data. Meanwhile, the US dollar index continued its rebound, surging to 98.60, a 20-day high. The latest round of US data releases painted a picture of resilient growth and persistent inflation, further solidifying dollar buying. Meanwhile, the core personal consumption expenditures (PCE) price index, included in the second-quarter GDP report, rose slightly from 2.5% to 2.6%. However, investors are primarily focused on Friday's release of August core PCE inflation data, which will have a greater impact on monetary policy expectations.
The euro fell against the dollar midweek, but the overall trend remains upward. Meanwhile, the formation of an "evening star" pattern on the daily chart suggests a growing probability of a pullback. The previous session's close below the key 1.1750 level could open the door for further downside. The 14-day relative strength index (RSI) is nearing its midline, suggesting a lack of short-term momentum. On the downside, if the exchange rate breaks below 1.1700, initial support will be seen at 1.1630, the 89-day simple moving average, followed by the psychological support level of 1.1600. On the upside, if bulls push the price back above 1.1700, a move to 1.1754 (Thursday's high) is possible. Further resistance is expected at 1.1800.
Consider a long EUR at 1.1650 today, with a stop-loss at 1.1640 and a target of 1.1700 or 1.1710.
Disclaimer: The information contained herein (1) is proprietary to BCR and/or its content providers; (2) may not be copied or distributed; (3) is not warranted to be accurate, complete or timely; and, (4) does not constitute advice or a recommendation by BCR or its content providers in respect of the investment in financial instruments. Neither BCR or its content providers are responsible for any damages or losses arising from any use of this information. Past performance is no guarantee of future results.
More Coverage


Risk Disclosure:Derivatives are traded over-the-counter on margin, which means they carry a high level of risk and there is a possibility you could lose all of your investment. These products are not suitable for all investors. Please ensure you fully understand the risks and carefully consider your financial situation and trading experience before trading. Seek independent financial advice if necessary before opening an account with BCR.

 English
 简体中文
简体中文
 繁體中文
繁體中文
 Bahasa
Melayu
Bahasa
Melayu
 Tiếng
Việt
Tiếng
Việt
 ไทย
ไทย
 日本語
日本語
 한국어
한국어
 ភាសាខ្មែរ
 español